
|
|||||
|
 | |
| |
| |
| |
| |
| |
|
Gene: RHOH |
Gene summary for RHOH |
| Gene information | Species | Human | Gene symbol | RHOH | Gene ID | 399 |
| Gene name | ras homolog family member H | |
| Gene Alias | ARHH | |
| Cytomap | 4p14 | |
| Gene Type | protein-coding | GO ID | GO:0000902 | UniProtAcc | Q15669 |
Top |
Malignant transformation analysis |
| Identification of the aberrant gene expression in precancerous and cancerous lesions by comparing the gene expression of stem-like cells in diseased tissues with normal stem cells |
| Entrez ID | Symbol | Replicates | Species | Organ | Tissue | Adj P-value | Log2FC | Malignancy |
| 399 | RHOH | C21 | Human | Oral cavity | OSCC | 2.44e-05 | 2.31e-01 | 0.2678 |
| 399 | RHOH | C30 | Human | Oral cavity | OSCC | 1.99e-06 | 3.03e-01 | 0.3055 |
| 399 | RHOH | C38 | Human | Oral cavity | OSCC | 8.18e-03 | 6.15e-01 | 0.172 |
| 399 | RHOH | C09 | Human | Oral cavity | OSCC | 6.75e-08 | 1.54e-01 | 0.1431 |
| 399 | RHOH | LN46 | Human | Oral cavity | OSCC | 4.57e-05 | 2.79e-01 | 0.1666 |
| 399 | RHOH | EOLP-1 | Human | Oral cavity | EOLP | 5.92e-23 | 6.52e-01 | -0.0202 |
| 399 | RHOH | EOLP-2 | Human | Oral cavity | EOLP | 9.93e-17 | 6.00e-01 | -0.0203 |
| 399 | RHOH | NEOLP-1 | Human | Oral cavity | NEOLP | 1.79e-03 | 2.63e-01 | -0.0194 |
| 399 | RHOH | 047563_1562-all-cells | Human | Prostate | BPH | 3.77e-14 | 5.30e-01 | 0.0791 |
| 399 | RHOH | 052095_1628-all-cells | Human | Prostate | BPH | 2.16e-03 | 1.41e-01 | 0.1032 |
| 399 | RHOH | Dong_P1 | Human | Prostate | Tumor | 1.07e-04 | 9.24e-02 | 0.035 |
| 399 | RHOH | Dong_P5 | Human | Prostate | Tumor | 4.55e-03 | 5.75e-02 | 0.053 |
| 399 | RHOH | GSM5353216_PA_PB1A_Pool_1_3_S50_L002 | Human | Prostate | Tumor | 2.91e-04 | 7.23e-01 | 0.159 |
| Page: 1 |
| Tissue | Expression Dynamics | Abbreviation |
| Oral Cavity |  | EOLP: Erosive Oral lichen planus |
| LP: leukoplakia | ||
| NEOLP: Non-erosive oral lichen planus | ||
| OSCC: Oral squamous cell carcinoma | ||
| Prostate | 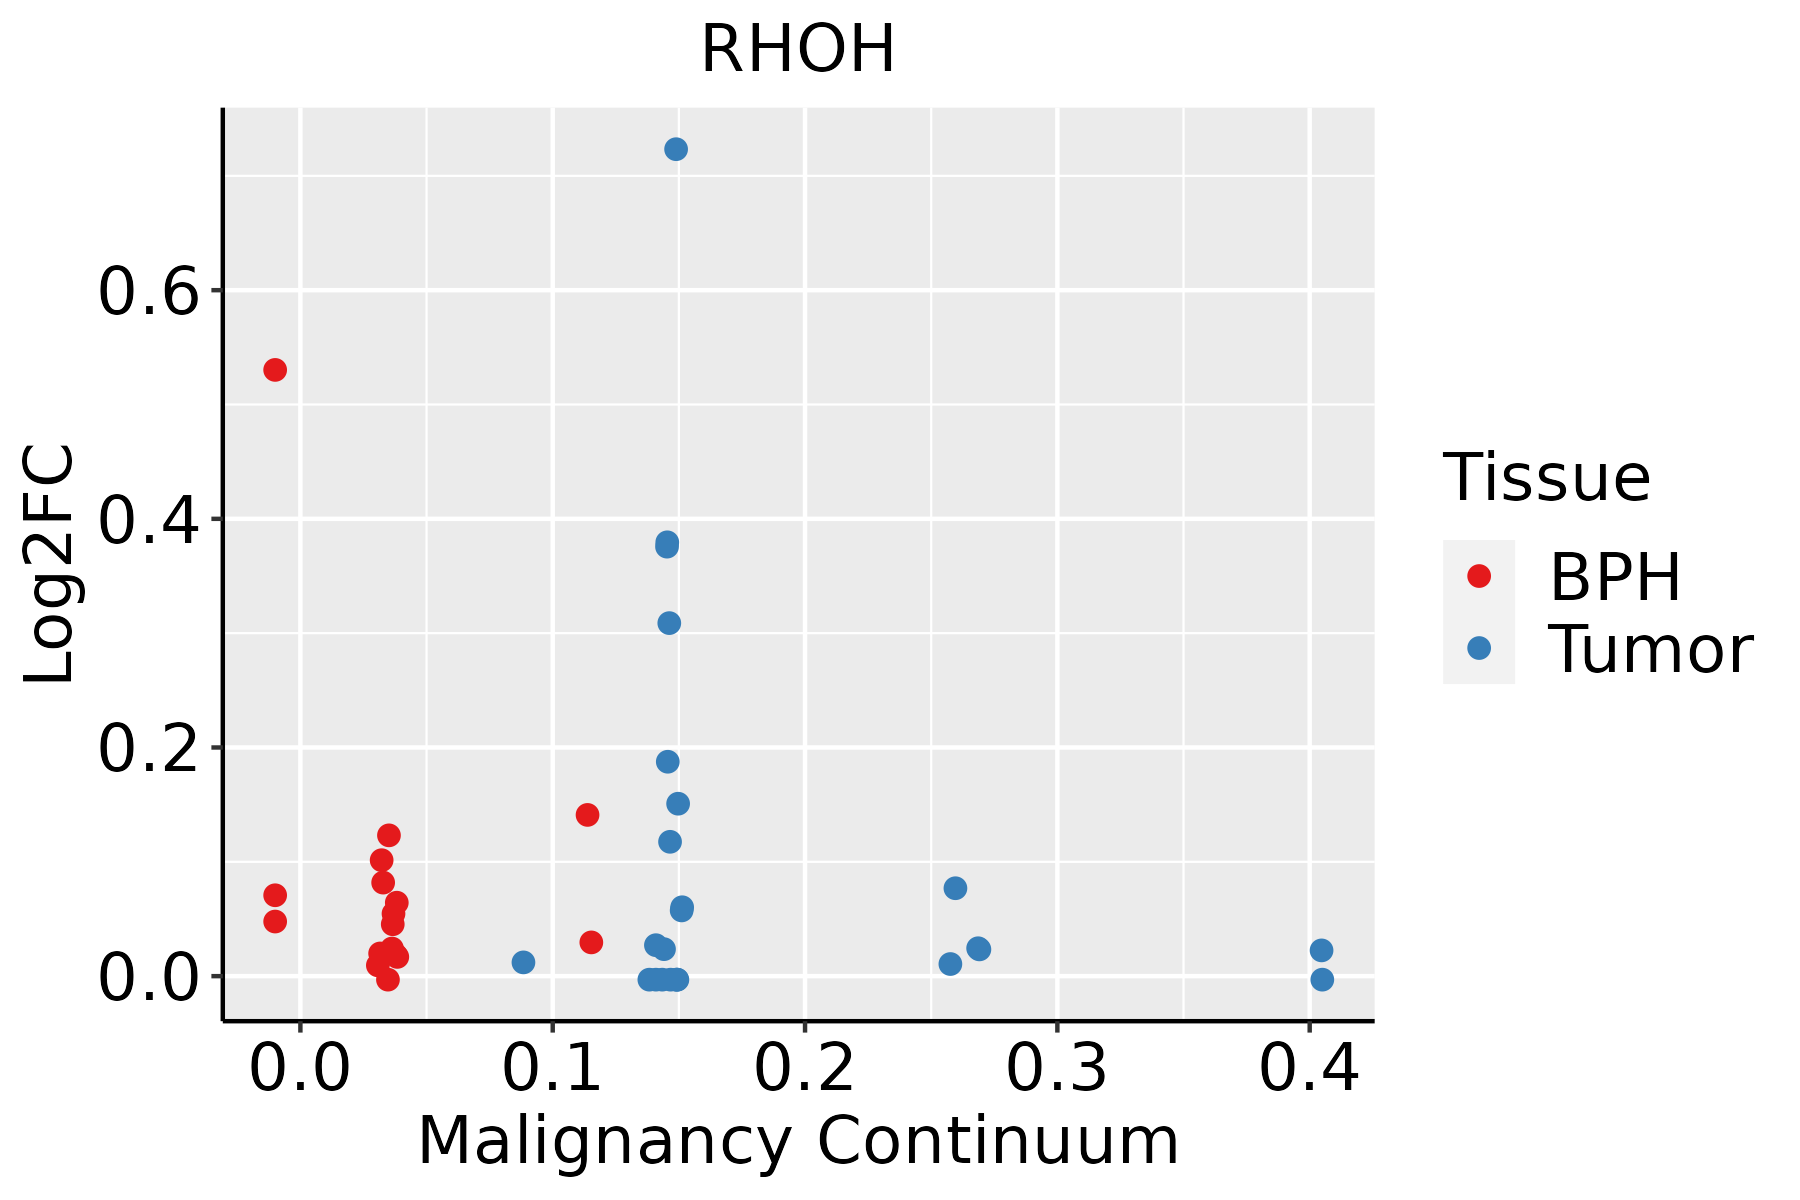 | BPH: Benign Prostatic Hyperplasia |
| ∗log2FC in expression of this searched gene in stem-like cells from each diseased tissue sample relative to stem-like cells in normal samples in each tissue plotted against the malignancy continuum. Samples are colored based on if they are from different disease stage. |
Top |
Malignant transformation related pathway analysis |
| Find out the enriched GO biological processes and KEGG pathways involved in transition from healthy to precancer to cancer |
| Tissue | Disease Stage | Enriched GO biological Processes |
| Colorectum | AD |  |
| Colorectum | SER |  |
| Colorectum | MSS |  |
| Colorectum | MSI-H |  |
| Colorectum | FAP |  |
| ∗Top 15 enriched GO BP terms are showed in the bar plot of each disease state in each tissue. Each row represents a significant GO biological process which is colored according to the -log10(p.adjust). |
| Page: 1 2 3 4 5 6 7 8 9 |
| GO ID | Tissue | Disease Stage | Description | Gene Ratio | Bg Ratio | pvalue | p.adjust | Count |
| GO:004312218 | Oral cavity | OSCC | regulation of I-kappaB kinase/NF-kappaB signaling | 155/7305 | 249/18723 | 7.79e-14 | 4.14e-12 | 155 |
| GO:000724910 | Oral cavity | OSCC | I-kappaB kinase/NF-kappaB signaling | 169/7305 | 281/18723 | 4.69e-13 | 2.25e-11 | 169 |
| GO:000716318 | Oral cavity | OSCC | establishment or maintenance of cell polarity | 129/7305 | 218/18723 | 1.16e-09 | 2.86e-08 | 129 |
| GO:00072659 | Oral cavity | OSCC | Ras protein signal transduction | 185/7305 | 337/18723 | 1.95e-09 | 4.60e-08 | 185 |
| GO:000701520 | Oral cavity | OSCC | actin filament organization | 230/7305 | 442/18723 | 1.37e-08 | 2.77e-07 | 230 |
| GO:003297020 | Oral cavity | OSCC | regulation of actin filament-based process | 209/7305 | 397/18723 | 1.89e-08 | 3.72e-07 | 209 |
| GO:004578520 | Oral cavity | OSCC | positive regulation of cell adhesion | 225/7305 | 437/18723 | 6.06e-08 | 1.09e-06 | 225 |
| GO:003295620 | Oral cavity | OSCC | regulation of actin cytoskeleton organization | 189/7305 | 358/18723 | 6.81e-08 | 1.21e-06 | 189 |
| GO:004211016 | Oral cavity | OSCC | T cell activation | 245/7305 | 487/18723 | 2.00e-07 | 3.22e-06 | 245 |
| GO:002260419 | Oral cavity | OSCC | regulation of cell morphogenesis | 163/7305 | 309/18723 | 5.66e-07 | 8.19e-06 | 163 |
| GO:003086510 | Oral cavity | OSCC | cortical cytoskeleton organization | 42/7305 | 61/18723 | 2.23e-06 | 2.84e-05 | 42 |
| GO:000836016 | Oral cavity | OSCC | regulation of cell shape | 88/7305 | 154/18723 | 3.73e-06 | 4.42e-05 | 88 |
| GO:19031316 | Oral cavity | OSCC | mononuclear cell differentiation | 210/7305 | 426/18723 | 8.44e-06 | 9.02e-05 | 210 |
| GO:002240718 | Oral cavity | OSCC | regulation of cell-cell adhesion | 218/7305 | 448/18723 | 1.71e-05 | 1.68e-04 | 218 |
| GO:190370618 | Oral cavity | OSCC | regulation of hemopoiesis | 180/7305 | 367/18723 | 5.16e-05 | 4.30e-04 | 180 |
| GO:005086315 | Oral cavity | OSCC | regulation of T cell activation | 161/7305 | 329/18723 | 1.44e-04 | 1.02e-03 | 161 |
| GO:000268510 | Oral cavity | OSCC | regulation of leukocyte migration | 108/7305 | 210/18723 | 1.63e-04 | 1.13e-03 | 108 |
| GO:000715916 | Oral cavity | OSCC | leukocyte cell-cell adhesion | 178/7305 | 371/18723 | 2.44e-04 | 1.57e-03 | 178 |
| GO:00166018 | Oral cavity | OSCC | Rac protein signal transduction | 28/7305 | 42/18723 | 2.61e-04 | 1.67e-03 | 28 |
| GO:00300983 | Oral cavity | OSCC | lymphocyte differentiation | 179/7305 | 374/18723 | 2.74e-04 | 1.74e-03 | 179 |
| Page: 1 2 3 4 5 6 7 8 9 |
| Pathway ID | Tissue | Disease Stage | Description | Gene Ratio | Bg Ratio | pvalue | p.adjust | qvalue | Count |
| hsa0513230 | Oral cavity | OSCC | Salmonella infection | 174/3704 | 249/8465 | 2.67e-17 | 1.49e-15 | 7.58e-16 | 174 |
| hsa0467030 | Oral cavity | OSCC | Leukocyte transendothelial migration | 63/3704 | 114/8465 | 8.46e-03 | 1.96e-02 | 9.95e-03 | 63 |
| hsa05132114 | Oral cavity | OSCC | Salmonella infection | 174/3704 | 249/8465 | 2.67e-17 | 1.49e-15 | 7.58e-16 | 174 |
| hsa04670113 | Oral cavity | OSCC | Leukocyte transendothelial migration | 63/3704 | 114/8465 | 8.46e-03 | 1.96e-02 | 9.95e-03 | 63 |
| hsa0513245 | Oral cavity | EOLP | Salmonella infection | 78/1218 | 249/8465 | 3.66e-12 | 2.37e-10 | 1.40e-10 | 78 |
| hsa04670210 | Oral cavity | EOLP | Leukocyte transendothelial migration | 37/1218 | 114/8465 | 7.00e-07 | 6.85e-06 | 4.04e-06 | 37 |
| hsa0513255 | Oral cavity | EOLP | Salmonella infection | 78/1218 | 249/8465 | 3.66e-12 | 2.37e-10 | 1.40e-10 | 78 |
| hsa0467038 | Oral cavity | EOLP | Leukocyte transendothelial migration | 37/1218 | 114/8465 | 7.00e-07 | 6.85e-06 | 4.04e-06 | 37 |
| hsa0513263 | Oral cavity | NEOLP | Salmonella infection | 67/1112 | 249/8465 | 3.05e-09 | 7.46e-08 | 4.69e-08 | 67 |
| hsa0467046 | Oral cavity | NEOLP | Leukocyte transendothelial migration | 31/1112 | 114/8465 | 4.39e-05 | 3.41e-04 | 2.14e-04 | 31 |
| hsa0513273 | Oral cavity | NEOLP | Salmonella infection | 67/1112 | 249/8465 | 3.05e-09 | 7.46e-08 | 4.69e-08 | 67 |
| hsa0467056 | Oral cavity | NEOLP | Leukocyte transendothelial migration | 31/1112 | 114/8465 | 4.39e-05 | 3.41e-04 | 2.14e-04 | 31 |
| hsa0513228 | Prostate | BPH | Salmonella infection | 99/1718 | 249/8465 | 7.26e-13 | 1.50e-11 | 9.27e-12 | 99 |
| hsa0467028 | Prostate | BPH | Leukocyte transendothelial migration | 41/1718 | 114/8465 | 6.86e-05 | 4.35e-04 | 2.69e-04 | 41 |
| hsa05132113 | Prostate | BPH | Salmonella infection | 99/1718 | 249/8465 | 7.26e-13 | 1.50e-11 | 9.27e-12 | 99 |
| hsa04670112 | Prostate | BPH | Leukocyte transendothelial migration | 41/1718 | 114/8465 | 6.86e-05 | 4.35e-04 | 2.69e-04 | 41 |
| hsa0513229 | Prostate | Tumor | Salmonella infection | 98/1791 | 249/8465 | 2.55e-11 | 5.28e-10 | 3.27e-10 | 98 |
| hsa0467029 | Prostate | Tumor | Leukocyte transendothelial migration | 41/1791 | 114/8465 | 1.80e-04 | 1.08e-03 | 6.68e-04 | 41 |
| hsa0513237 | Prostate | Tumor | Salmonella infection | 98/1791 | 249/8465 | 2.55e-11 | 5.28e-10 | 3.27e-10 | 98 |
| hsa0467037 | Prostate | Tumor | Leukocyte transendothelial migration | 41/1791 | 114/8465 | 1.80e-04 | 1.08e-03 | 6.68e-04 | 41 |
| Page: 1 |
Top |
Cell-cell communication analysis |
| Identification of potential cell-cell interactions between two cell types and their ligand-receptor pairs for different disease states |
| Ligand | Receptor | LRpair | Pathway | Tissue | Disease Stage |
| Page: 1 |
Top |
Single-cell gene regulatory network inference analysis |
| Find out the significant the regulons (TFs) and the target genes of each regulon across cell types for different disease states |
| TF | Cell Type | Tissue | Disease Stage | Target Gene | RSS | Regulon Activity |
| ∗The dot plots of a searched regulon are shown for all cell subpopulations in each disease state of each tissue based on the regulon specific score inferred using pySCENIC and by calculating the average expression. |
| Page: 1 |
Top |
Somatic mutation of malignant transformation related genes |
| Annotation of somatic variants for genes involved in malignant transformation |
| Hugo Symbol | Variant Class | Variant Classification | dbSNP RS | HGVSc | HGVSp | HGVSp Short | SWISSPROT | BIOTYPE | SIFT | PolyPhen | Tumor Sample Barcode | Tissue | Histology | Sex | Age | Stage | Therapy Types | Drugs | Outcome |
| RHOH | SNV | Missense_Mutation | c.536G>T | p.Arg179Ile | p.R179I | Q15669 | protein_coding | deleterious(0.01) | probably_damaging(0.979) | TCGA-A8-A08P-01 | Breast | breast invasive carcinoma | Female | >=65 | III/IV | Chemotherapy | 5-fluorouracil | CR | |
| RHOH | insertion | Frame_Shift_Ins | novel | c.553_554insCAGCAGAG | p.Ile185ThrfsTer87 | p.I185Tfs*87 | Q15669 | protein_coding | TCGA-A8-A07Z-01 | Breast | breast invasive carcinoma | Female | >=65 | I/II | Unspecific | Exemestane | SD | ||
| RHOH | SNV | Missense_Mutation | c.536N>C | p.Arg179Thr | p.R179T | Q15669 | protein_coding | tolerated(0.09) | probably_damaging(0.95) | TCGA-JX-A3Q0-01 | Cervix | cervical & endocervical cancer | Female | <65 | III/IV | Unknown | Unknown | SD | |
| RHOH | SNV | Missense_Mutation | novel | c.418N>T | p.Ala140Ser | p.A140S | Q15669 | protein_coding | deleterious(0.04) | probably_damaging(0.992) | TCGA-AA-3973-01 | Colorectum | colon adenocarcinoma | Male | >=65 | III/IV | Targeted Molecular therapy | bevacizumab | SD |
| RHOH | SNV | Missense_Mutation | c.530N>A | p.Arg177Gln | p.R177Q | Q15669 | protein_coding | tolerated(0.45) | benign(0) | TCGA-AA-3977-01 | Colorectum | colon adenocarcinoma | Male | >=65 | I/II | Unknown | Unknown | SD | |
| RHOH | SNV | Missense_Mutation | c.223N>A | p.Gln75Lys | p.Q75K | Q15669 | protein_coding | tolerated(0.06) | benign(0.096) | TCGA-EI-6508-01 | Colorectum | rectum adenocarcinoma | Female | <65 | III/IV | Chemotherapy | oxaliplatin | SD | |
| RHOH | SNV | Missense_Mutation | novel | c.305N>G | p.Ile102Ser | p.I102S | Q15669 | protein_coding | deleterious(0) | benign(0.141) | TCGA-AP-A1DV-01 | Endometrium | uterine corpus endometrioid carcinoma | Female | <65 | I/II | Unknown | Unknown | SD |
| RHOH | SNV | Missense_Mutation | novel | c.544N>A | p.Leu182Ile | p.L182I | Q15669 | protein_coding | tolerated(0.3) | benign(0.007) | TCGA-B5-A3FA-01 | Endometrium | uterine corpus endometrioid carcinoma | Female | >=65 | I/II | Unknown | Unknown | SD |
| RHOH | SNV | Missense_Mutation | novel | c.196A>G | p.Arg66Gly | p.R66G | Q15669 | protein_coding | deleterious(0) | benign(0.042) | TCGA-DF-A2KY-01 | Endometrium | uterine corpus endometrioid carcinoma | Female | <65 | III/IV | Chemotherapy | carboplatin | SD |
| RHOH | SNV | Missense_Mutation | novel | c.190N>A | p.Ala64Thr | p.A64T | Q15669 | protein_coding | deleterious(0.05) | benign(0.003) | TCGA-EO-A22R-01 | Endometrium | uterine corpus endometrioid carcinoma | Female | <65 | I/II | Unknown | Unknown | SD |
| Page: 1 2 3 |
Top |
Related drugs of malignant transformation related genes |
| Identification of chemicals and drugs interact with genes involved in malignant transfromation |
| (DGIdb 4.0) |
| Entrez ID | Symbol | Category | Interaction Types | Drug Claim Name | Drug Name | PMIDs |
| Page: 1 |

Copyright 2023-Present -The University of Texas Health Science Center at Houston |