
|
|||||
|
 | |
| |
| |
| |
| |
| |
|
Gene: RHOD |
Gene summary for RHOD |
| Gene information | Species | Human | Gene symbol | RHOD | Gene ID | 29984 |
| Gene name | ras homolog family member D | |
| Gene Alias | ARHD | |
| Cytomap | 11q13.2 | |
| Gene Type | protein-coding | GO ID | GO:0000902 | UniProtAcc | E9PIG5 |
Top |
Malignant transformation analysis |
| Identification of the aberrant gene expression in precancerous and cancerous lesions by comparing the gene expression of stem-like cells in diseased tissues with normal stem cells |
| Entrez ID | Symbol | Replicates | Species | Organ | Tissue | Adj P-value | Log2FC | Malignancy |
| 29984 | RHOD | LZE4T | Human | Esophagus | ESCC | 5.25e-12 | 4.55e-01 | 0.0811 |
| 29984 | RHOD | LZE20T | Human | Esophagus | ESCC | 1.52e-12 | 7.87e-01 | 0.0662 |
| 29984 | RHOD | LZE22D1 | Human | Esophagus | HGIN | 1.50e-02 | 5.18e-02 | 0.0595 |
| 29984 | RHOD | LZE22T | Human | Esophagus | ESCC | 8.93e-05 | 9.04e-01 | 0.068 |
| 29984 | RHOD | LZE24T | Human | Esophagus | ESCC | 1.37e-13 | 7.47e-01 | 0.0596 |
| 29984 | RHOD | P1T-E | Human | Esophagus | ESCC | 7.07e-07 | 6.84e-01 | 0.0875 |
| 29984 | RHOD | P2T-E | Human | Esophagus | ESCC | 4.35e-26 | 4.93e-01 | 0.1177 |
| 29984 | RHOD | P4T-E | Human | Esophagus | ESCC | 3.57e-26 | 7.97e-01 | 0.1323 |
| 29984 | RHOD | P5T-E | Human | Esophagus | ESCC | 9.17e-21 | 6.46e-01 | 0.1327 |
| 29984 | RHOD | P8T-E | Human | Esophagus | ESCC | 1.51e-71 | 1.66e+00 | 0.0889 |
| 29984 | RHOD | P9T-E | Human | Esophagus | ESCC | 9.81e-18 | 4.67e-01 | 0.1131 |
| 29984 | RHOD | P10T-E | Human | Esophagus | ESCC | 1.41e-08 | 2.78e-01 | 0.116 |
| 29984 | RHOD | P11T-E | Human | Esophagus | ESCC | 3.88e-18 | 1.72e+00 | 0.1426 |
| 29984 | RHOD | P12T-E | Human | Esophagus | ESCC | 1.31e-15 | 4.01e-01 | 0.1122 |
| 29984 | RHOD | P15T-E | Human | Esophagus | ESCC | 1.87e-25 | 8.34e-01 | 0.1149 |
| 29984 | RHOD | P16T-E | Human | Esophagus | ESCC | 4.43e-23 | 5.55e-01 | 0.1153 |
| 29984 | RHOD | P17T-E | Human | Esophagus | ESCC | 4.99e-12 | 7.74e-01 | 0.1278 |
| 29984 | RHOD | P19T-E | Human | Esophagus | ESCC | 1.94e-05 | 1.65e+00 | 0.1662 |
| 29984 | RHOD | P20T-E | Human | Esophagus | ESCC | 2.25e-39 | 1.28e+00 | 0.1124 |
| 29984 | RHOD | P21T-E | Human | Esophagus | ESCC | 2.11e-92 | 3.09e+00 | 0.1617 |
| Page: 1 2 3 4 5 6 |
| Tissue | Expression Dynamics | Abbreviation |
| Esophagus | 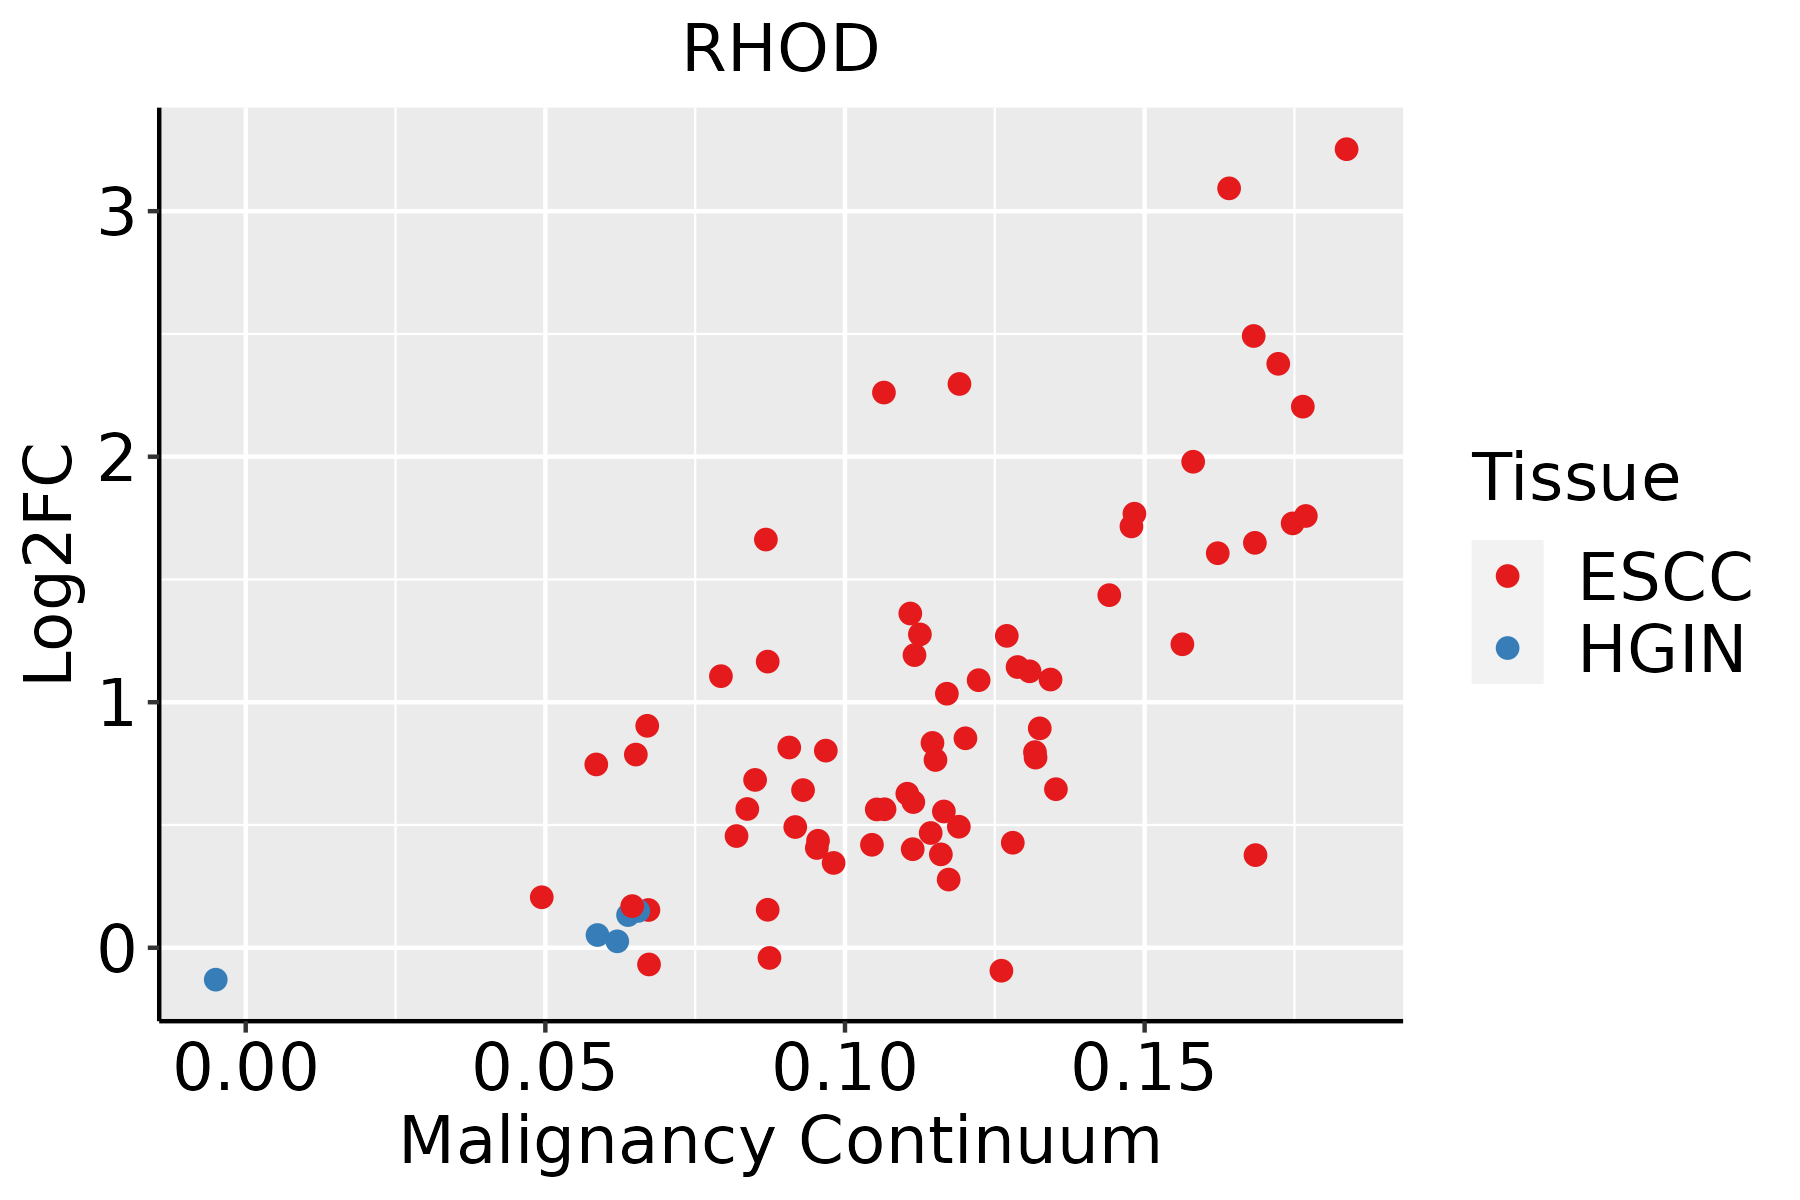 | ESCC: Esophageal squamous cell carcinoma |
| HGIN: High-grade intraepithelial neoplasias | ||
| LGIN: Low-grade intraepithelial neoplasias | ||
| Liver |  | HCC: Hepatocellular carcinoma |
| NAFLD: Non-alcoholic fatty liver disease | ||
| Oral Cavity | 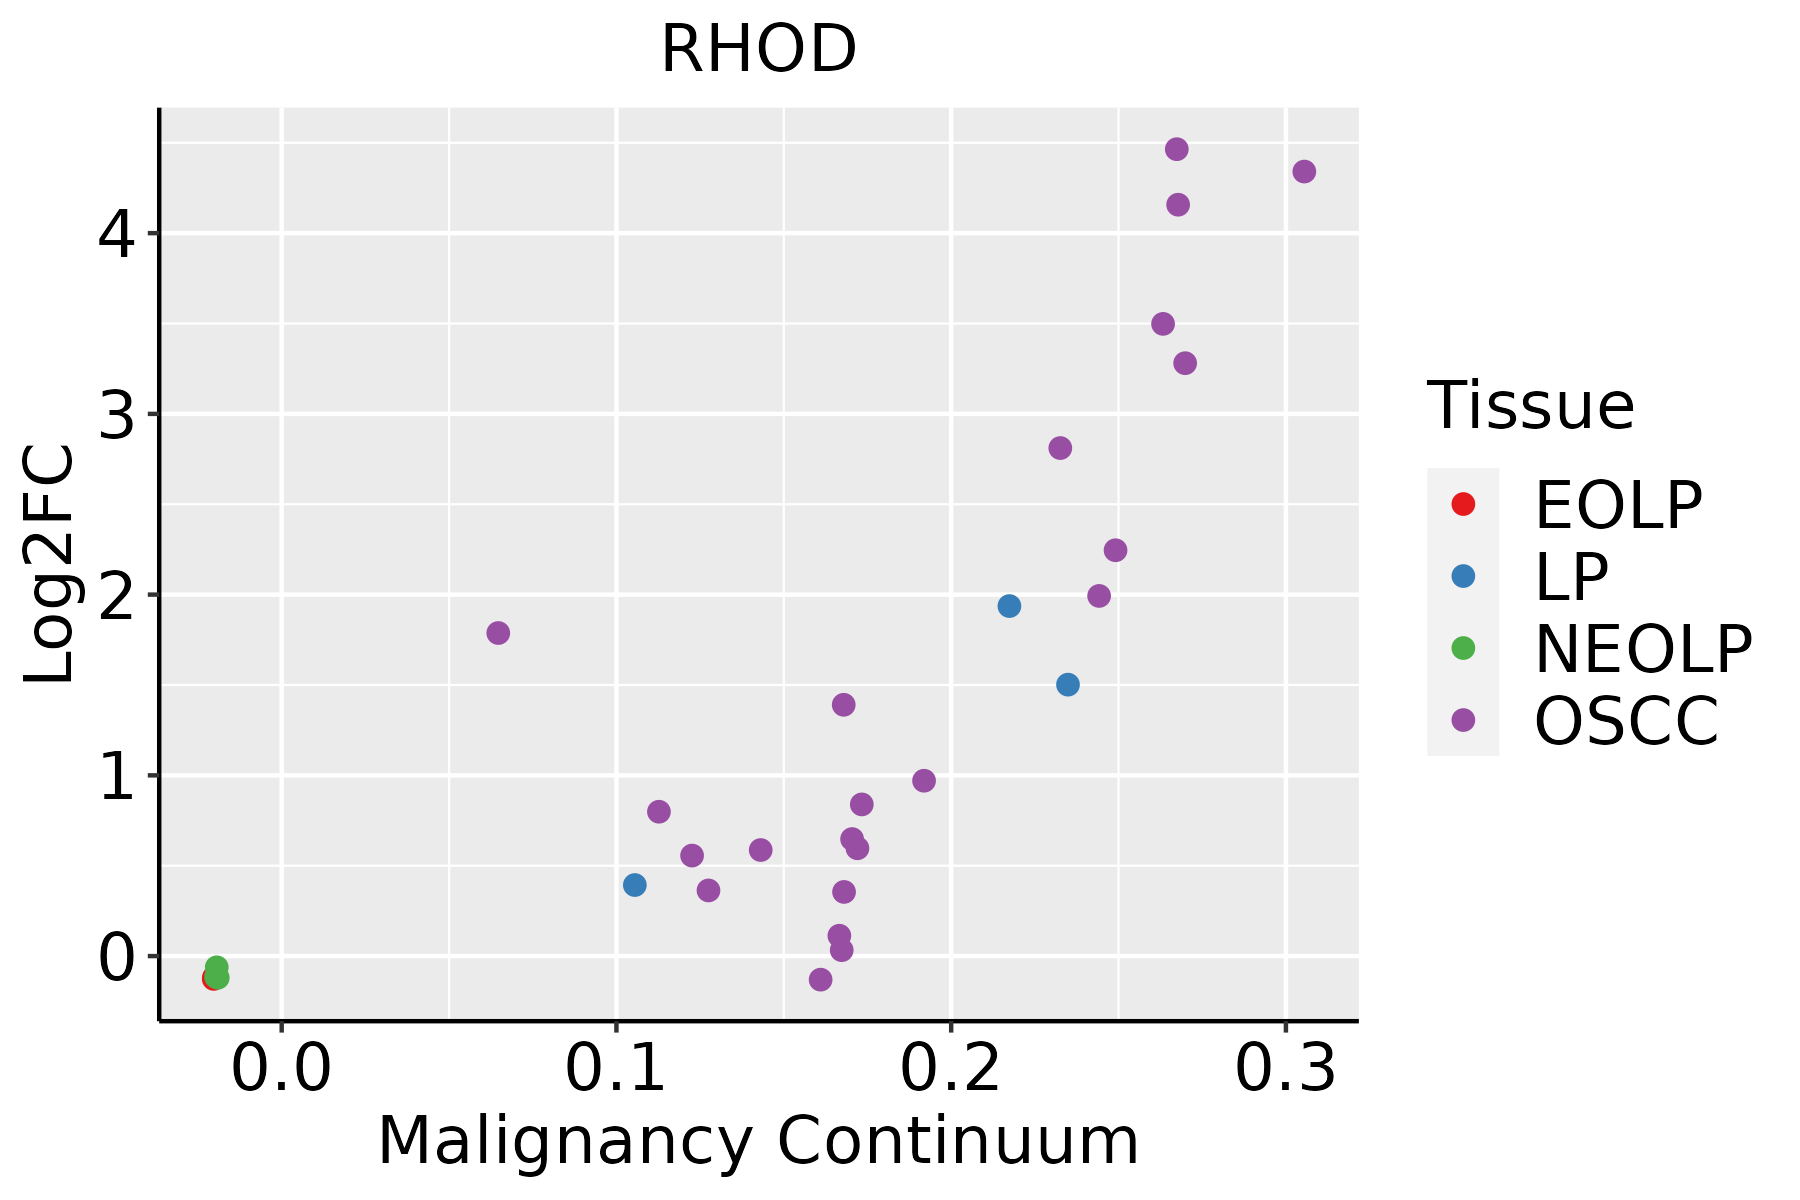 | EOLP: Erosive Oral lichen planus |
| LP: leukoplakia | ||
| NEOLP: Non-erosive oral lichen planus | ||
| OSCC: Oral squamous cell carcinoma | ||
| Skin | 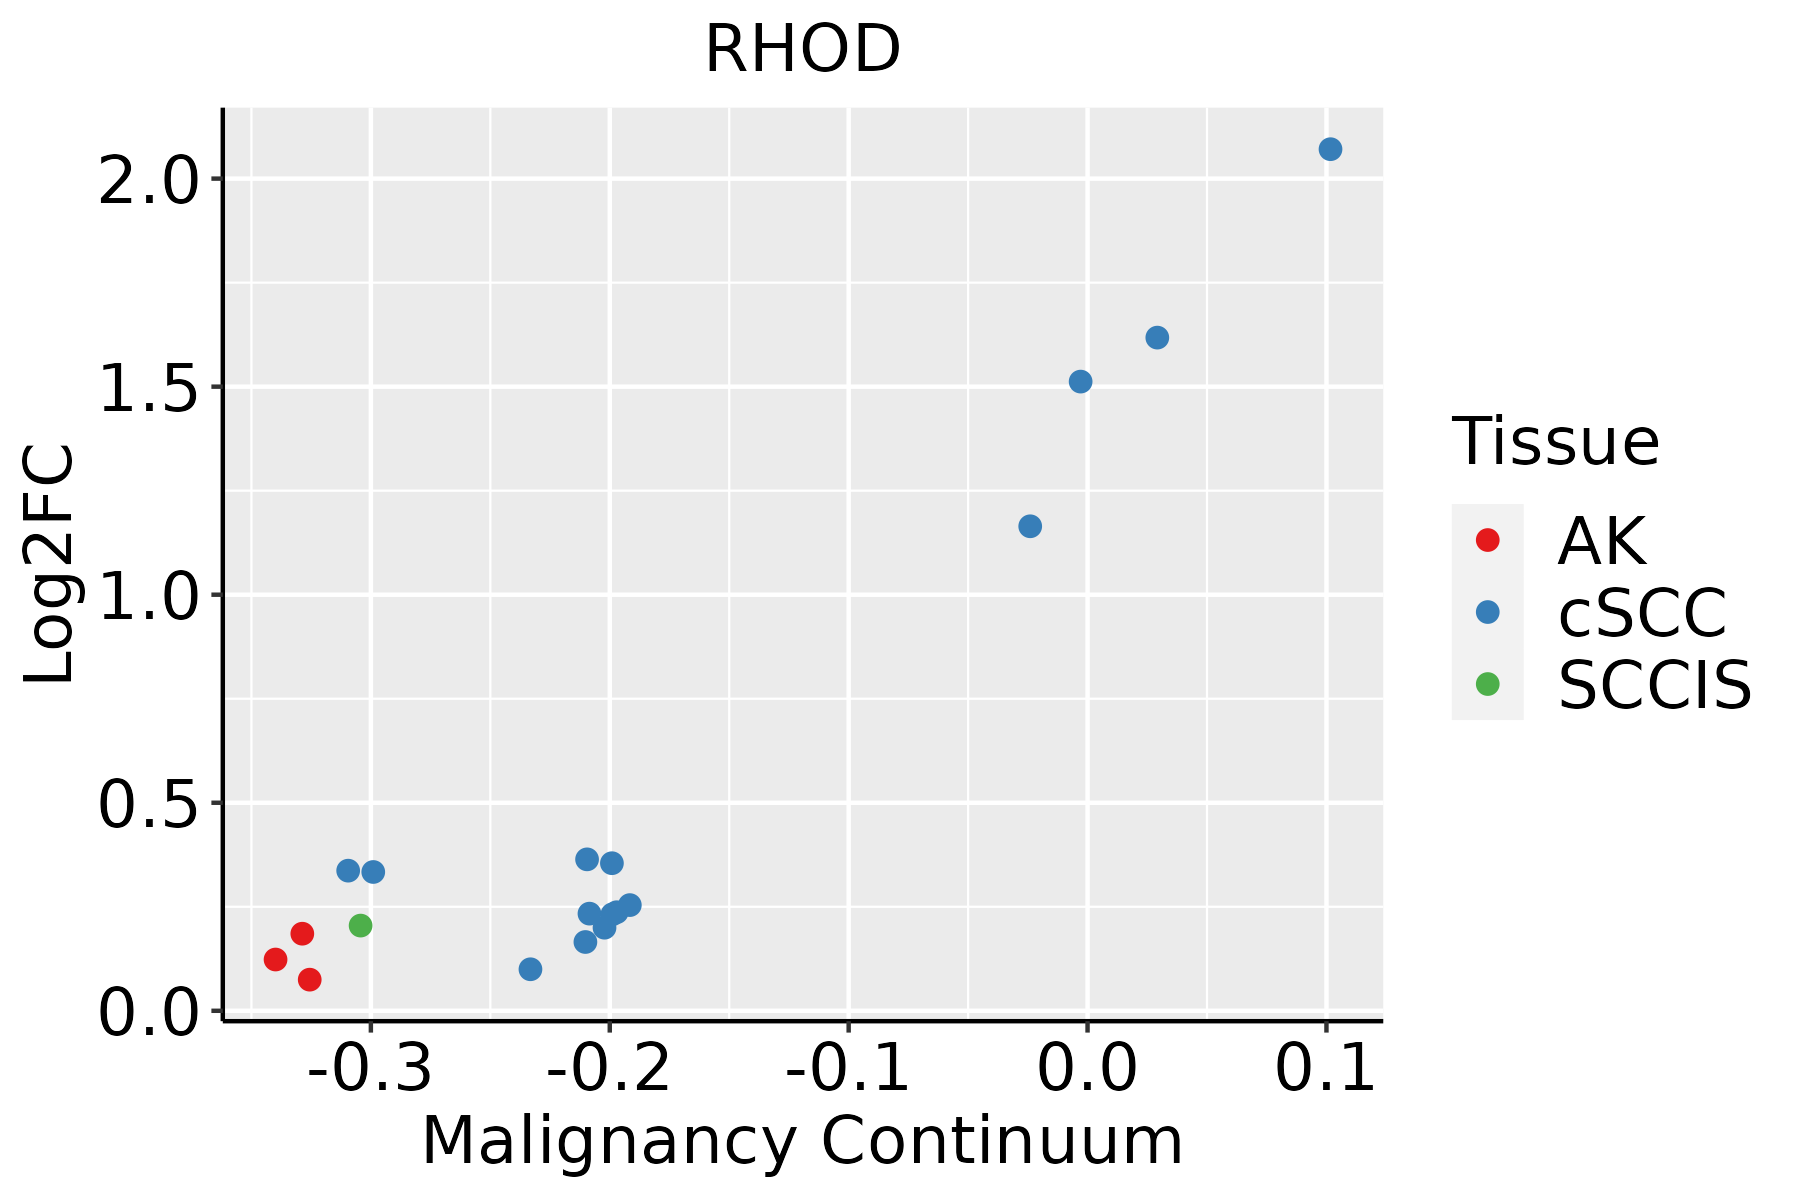 | AK: Actinic keratosis |
| cSCC: Cutaneous squamous cell carcinoma | ||
| SCCIS:squamous cell carcinoma in situ | ||
| Thyroid |  | ATC: Anaplastic thyroid cancer |
| HT: Hashimoto's thyroiditis | ||
| PTC: Papillary thyroid cancer |
| ∗log2FC in expression of this searched gene in stem-like cells from each diseased tissue sample relative to stem-like cells in normal samples in each tissue plotted against the malignancy continuum. Samples are colored based on if they are from different disease stage. |
Top |
Malignant transformation related pathway analysis |
| Find out the enriched GO biological processes and KEGG pathways involved in transition from healthy to precancer to cancer |
| Tissue | Disease Stage | Enriched GO biological Processes |
| Colorectum | AD |  |
| Colorectum | SER |  |
| Colorectum | MSS |  |
| Colorectum | MSI-H |  |
| Colorectum | FAP |  |
| ∗Top 15 enriched GO BP terms are showed in the bar plot of each disease state in each tissue. Each row represents a significant GO biological process which is colored according to the -log10(p.adjust). |
| Page: 1 2 3 4 5 6 7 8 9 |
| GO ID | Tissue | Disease Stage | Description | Gene Ratio | Bg Ratio | pvalue | p.adjust | Count |
| GO:003297027 | Esophagus | HGIN | regulation of actin filament-based process | 77/2587 | 397/18723 | 1.14e-03 | 1.39e-02 | 77 |
| GO:003295627 | Esophagus | HGIN | regulation of actin cytoskeleton organization | 69/2587 | 358/18723 | 2.35e-03 | 2.39e-02 | 69 |
| GO:015011519 | Esophagus | HGIN | cell-substrate junction organization | 24/2587 | 101/18723 | 4.85e-03 | 4.16e-02 | 24 |
| GO:0150115110 | Esophagus | ESCC | cell-substrate junction organization | 77/8552 | 101/18723 | 3.46e-10 | 9.57e-09 | 77 |
| GO:000704418 | Esophagus | ESCC | cell-substrate junction assembly | 73/8552 | 95/18723 | 5.27e-10 | 1.35e-08 | 73 |
| GO:000716320 | Esophagus | ESCC | establishment or maintenance of cell polarity | 143/8552 | 218/18723 | 2.05e-09 | 4.65e-08 | 143 |
| GO:003158919 | Esophagus | ESCC | cell-substrate adhesion | 221/8552 | 363/18723 | 3.06e-09 | 6.62e-08 | 221 |
| GO:000701527 | Esophagus | ESCC | actin filament organization | 259/8552 | 442/18723 | 2.37e-08 | 4.50e-07 | 259 |
| GO:004804116 | Esophagus | ESCC | focal adhesion assembly | 65/8552 | 87/18723 | 3.28e-08 | 6.08e-07 | 65 |
| GO:004578527 | Esophagus | ESCC | positive regulation of cell adhesion | 255/8552 | 437/18723 | 5.07e-08 | 9.11e-07 | 255 |
| GO:000726510 | Esophagus | ESCC | Ras protein signal transduction | 201/8552 | 337/18723 | 1.44e-07 | 2.30e-06 | 201 |
| GO:0032970111 | Esophagus | ESCC | regulation of actin filament-based process | 231/8552 | 397/18723 | 2.91e-07 | 4.20e-06 | 231 |
| GO:0032956111 | Esophagus | ESCC | regulation of actin cytoskeleton organization | 210/8552 | 358/18723 | 4.40e-07 | 6.00e-06 | 210 |
| GO:000716018 | Esophagus | ESCC | cell-matrix adhesion | 141/8552 | 233/18723 | 3.33e-06 | 3.71e-05 | 141 |
| GO:005101727 | Esophagus | ESCC | actin filament bundle assembly | 100/8552 | 157/18723 | 3.87e-06 | 4.17e-05 | 100 |
| GO:002260420 | Esophagus | ESCC | regulation of cell morphogenesis | 180/8552 | 309/18723 | 5.19e-06 | 5.45e-05 | 180 |
| GO:006157227 | Esophagus | ESCC | actin filament bundle organization | 101/8552 | 161/18723 | 9.22e-06 | 8.82e-05 | 101 |
| GO:003086517 | Esophagus | ESCC | cortical cytoskeleton organization | 44/8552 | 61/18723 | 2.50e-05 | 2.13e-04 | 44 |
| GO:000836018 | Esophagus | ESCC | regulation of cell shape | 92/8552 | 154/18723 | 3.00e-04 | 1.81e-03 | 92 |
| GO:003432918 | Esophagus | ESCC | cell junction assembly | 227/8552 | 420/18723 | 3.06e-04 | 1.83e-03 | 227 |
| Page: 1 2 3 4 5 6 7 8 |
| Pathway ID | Tissue | Disease Stage | Description | Gene Ratio | Bg Ratio | pvalue | p.adjust | qvalue | Count |
| hsa0436016 | Esophagus | ESCC | Axon guidance | 108/4205 | 182/8465 | 5.13e-03 | 1.30e-02 | 6.67e-03 | 108 |
| hsa0436017 | Esophagus | ESCC | Axon guidance | 108/4205 | 182/8465 | 5.13e-03 | 1.30e-02 | 6.67e-03 | 108 |
| hsa0436014 | Oral cavity | OSCC | Axon guidance | 97/3704 | 182/8465 | 5.59e-03 | 1.33e-02 | 6.76e-03 | 97 |
| hsa0436015 | Oral cavity | OSCC | Axon guidance | 97/3704 | 182/8465 | 5.59e-03 | 1.33e-02 | 6.76e-03 | 97 |
| Page: 1 |
Top |
Cell-cell communication analysis |
| Identification of potential cell-cell interactions between two cell types and their ligand-receptor pairs for different disease states |
| Ligand | Receptor | LRpair | Pathway | Tissue | Disease Stage |
| Page: 1 |
Top |
Single-cell gene regulatory network inference analysis |
| Find out the significant the regulons (TFs) and the target genes of each regulon across cell types for different disease states |
| TF | Cell Type | Tissue | Disease Stage | Target Gene | RSS | Regulon Activity |
| ∗The dot plots of a searched regulon are shown for all cell subpopulations in each disease state of each tissue based on the regulon specific score inferred using pySCENIC and by calculating the average expression. |
| Page: 1 |
Top |
Somatic mutation of malignant transformation related genes |
| Annotation of somatic variants for genes involved in malignant transformation |
| Hugo Symbol | Variant Class | Variant Classification | dbSNP RS | HGVSc | HGVSp | HGVSp Short | SWISSPROT | BIOTYPE | SIFT | PolyPhen | Tumor Sample Barcode | Tissue | Histology | Sex | Age | Stage | Therapy Types | Drugs | Outcome |
| RHOD | SNV | Missense_Mutation | novel | c.478N>A | p.Ala160Thr | p.A160T | O00212 | protein_coding | deleterious(0) | probably_damaging(0.985) | TCGA-2W-A8YY-01 | Cervix | cervical & endocervical cancer | Female | <65 | I/II | Chemotherapy | cisplatin | CR |
| RHOD | SNV | Missense_Mutation | c.541G>A | p.Ala181Thr | p.A181T | O00212 | protein_coding | tolerated(0.09) | benign(0.019) | TCGA-EA-A5O9-01 | Cervix | cervical & endocervical cancer | Female | <65 | I/II | Unknown | Unknown | SD | |
| RHOD | SNV | Missense_Mutation | c.175C>G | p.Gln59Glu | p.Q59E | O00212 | protein_coding | tolerated(1) | benign(0.012) | TCGA-G4-6314-01 | Colorectum | colon adenocarcinoma | Female | >=65 | III/IV | Ancillary | leucovorin | SD | |
| RHOD | SNV | Missense_Mutation | c.161N>G | p.Tyr54Cys | p.Y54C | O00212 | protein_coding | deleterious(0.01) | possibly_damaging(0.843) | TCGA-EI-6882-01 | Colorectum | rectum adenocarcinoma | Male | <65 | I/II | Unknown | Unknown | SD | |
| RHOD | SNV | Missense_Mutation | novel | c.404A>G | p.Lys135Arg | p.K135R | O00212 | protein_coding | tolerated(0.11) | benign(0.106) | TCGA-A5-A0G1-01 | Endometrium | uterine corpus endometrioid carcinoma | Female | >=65 | I/II | Unknown | Unknown | SD |
| RHOD | SNV | Missense_Mutation | c.407A>G | p.Asp136Gly | p.D136G | O00212 | protein_coding | deleterious(0.02) | probably_damaging(0.934) | TCGA-AX-A0J1-01 | Endometrium | uterine corpus endometrioid carcinoma | Female | >=65 | I/II | Unknown | Unknown | SD | |
| RHOD | SNV | Missense_Mutation | rs185607856 | c.157C>T | p.Arg53Trp | p.R53W | O00212 | protein_coding | deleterious(0.01) | probably_damaging(0.969) | TCGA-D1-A175-01 | Endometrium | uterine corpus endometrioid carcinoma | Female | <65 | I/II | Chemotherapy | paclitaxel | SD |
| RHOD | SNV | Missense_Mutation | rs781618855 | c.328C>T | p.Arg110Trp | p.R110W | O00212 | protein_coding | deleterious(0) | probably_damaging(0.99) | TCGA-EO-A22U-01 | Endometrium | uterine corpus endometrioid carcinoma | Female | >=65 | I/II | Unknown | Unknown | SD |
| RHOD | SNV | Missense_Mutation | novel | c.485C>T | p.Ser162Phe | p.S162F | O00212 | protein_coding | deleterious(0.01) | possibly_damaging(0.73) | TCGA-EO-A22U-01 | Endometrium | uterine corpus endometrioid carcinoma | Female | >=65 | I/II | Unknown | Unknown | SD |
| RHOD | SNV | Missense_Mutation | c.350N>G | p.His117Arg | p.H117R | O00212 | protein_coding | deleterious(0) | probably_damaging(0.998) | TCGA-05-4432-01 | Lung | lung adenocarcinoma | Male | >=65 | I/II | Chemotherapy | cisplatin | CR |
| Page: 1 2 |
Top |
Related drugs of malignant transformation related genes |
| Identification of chemicals and drugs interact with genes involved in malignant transfromation |
| (DGIdb 4.0) |
| Entrez ID | Symbol | Category | Interaction Types | Drug Claim Name | Drug Name | PMIDs |
| Page: 1 |

Copyright 2023-Present -The University of Texas Health Science Center at Houston |