
|
|||||
|
 | |
| |
| |
| |
| |
| |
|
Gene: RHOC |
Gene summary for RHOC |
| Gene information | Species | Human | Gene symbol | RHOC | Gene ID | 389 |
| Gene name | ras homolog family member C | |
| Gene Alias | ARH9 | |
| Cytomap | 1p13.2 | |
| Gene Type | protein-coding | GO ID | GO:0000278 | UniProtAcc | A0A024R0I3 |
Top |
Malignant transformation analysis |
| Identification of the aberrant gene expression in precancerous and cancerous lesions by comparing the gene expression of stem-like cells in diseased tissues with normal stem cells |
| Entrez ID | Symbol | Replicates | Species | Organ | Tissue | Adj P-value | Log2FC | Malignancy |
| 389 | RHOC | GSM4909277 | Human | Breast | Precancer | 3.55e-03 | -5.07e-01 | 0.0177 |
| 389 | RHOC | GSM4909281 | Human | Breast | IDC | 1.09e-04 | -2.35e-01 | 0.21 |
| 389 | RHOC | GSM4909286 | Human | Breast | IDC | 4.61e-17 | -3.58e-01 | 0.1081 |
| 389 | RHOC | GSM4909288 | Human | Breast | IDC | 3.50e-04 | -4.54e-01 | 0.0988 |
| 389 | RHOC | GSM4909293 | Human | Breast | IDC | 2.33e-04 | -7.19e-02 | 0.1581 |
| 389 | RHOC | GSM4909294 | Human | Breast | IDC | 4.15e-11 | 3.04e-02 | 0.2022 |
| 389 | RHOC | GSM4909296 | Human | Breast | IDC | 3.65e-17 | 1.41e-01 | 0.1524 |
| 389 | RHOC | GSM4909297 | Human | Breast | IDC | 3.02e-28 | -3.68e-01 | 0.1517 |
| 389 | RHOC | GSM4909298 | Human | Breast | IDC | 1.17e-06 | -2.21e-01 | 0.1551 |
| 389 | RHOC | GSM4909301 | Human | Breast | IDC | 8.92e-15 | -4.63e-01 | 0.1577 |
| 389 | RHOC | GSM4909304 | Human | Breast | IDC | 1.50e-03 | 3.07e-01 | 0.1636 |
| 389 | RHOC | GSM4909311 | Human | Breast | IDC | 1.39e-48 | -1.38e-01 | 0.1534 |
| 389 | RHOC | GSM4909312 | Human | Breast | IDC | 1.21e-22 | 2.32e-01 | 0.1552 |
| 389 | RHOC | GSM4909313 | Human | Breast | IDC | 1.57e-05 | -6.19e-02 | 0.0391 |
| 389 | RHOC | GSM4909315 | Human | Breast | IDC | 1.04e-24 | 5.26e-01 | 0.21 |
| 389 | RHOC | GSM4909316 | Human | Breast | IDC | 2.80e-17 | 4.69e-01 | 0.21 |
| 389 | RHOC | GSM4909318 | Human | Breast | IDC | 9.73e-03 | -4.62e-01 | 0.2031 |
| 389 | RHOC | GSM4909319 | Human | Breast | IDC | 8.55e-69 | -3.27e-01 | 0.1563 |
| 389 | RHOC | GSM4909320 | Human | Breast | IDC | 8.84e-10 | -3.74e-01 | 0.1575 |
| 389 | RHOC | GSM4909321 | Human | Breast | IDC | 2.36e-19 | -1.94e-01 | 0.1559 |
| Page: 1 2 3 4 5 6 7 8 9 10 11 12 13 |
| Tissue | Expression Dynamics | Abbreviation |
| Breast | 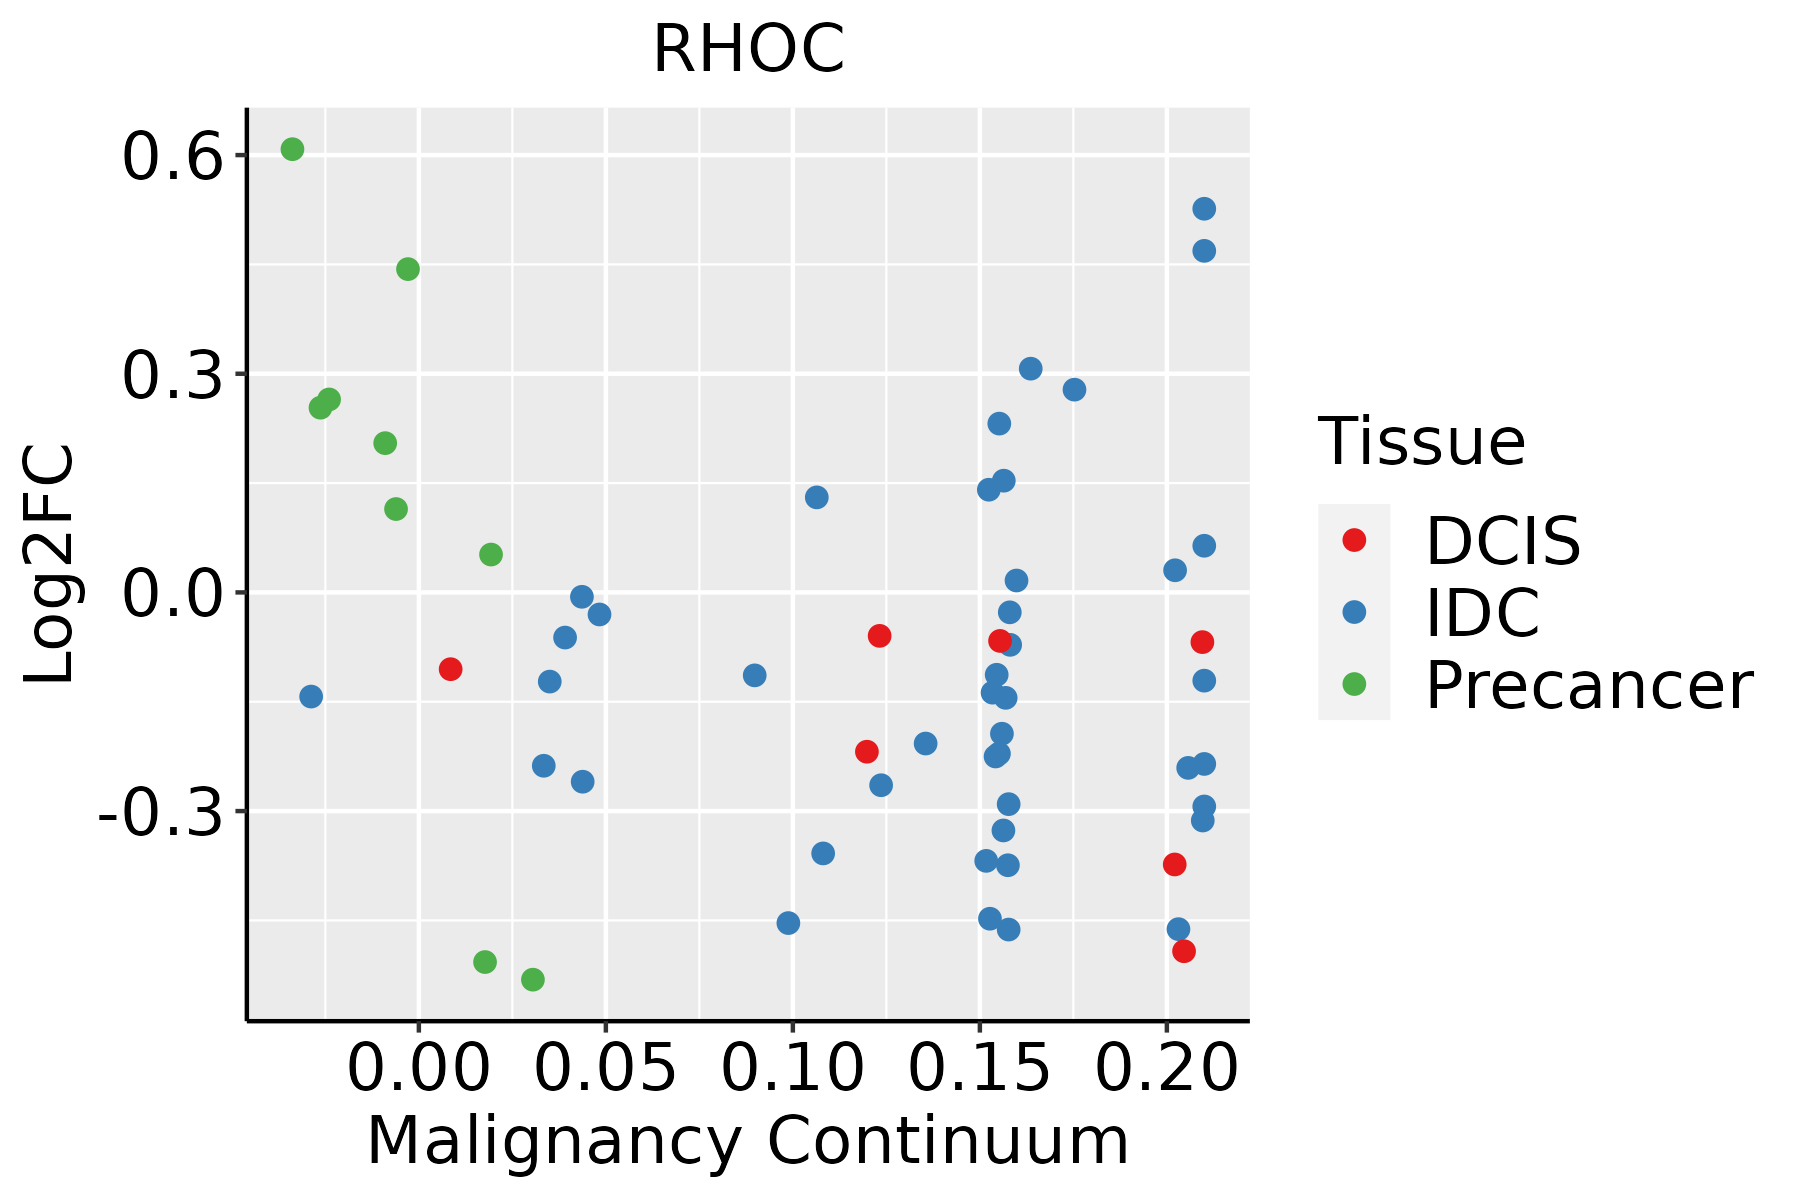 | IDC: Invasive ductal carcinoma |
| DCIS: Ductal carcinoma in situ | ||
| Precancer(BRCA1-mut): Precancerous lesion from BRCA1 mutation carriers | ||
| Cervix | 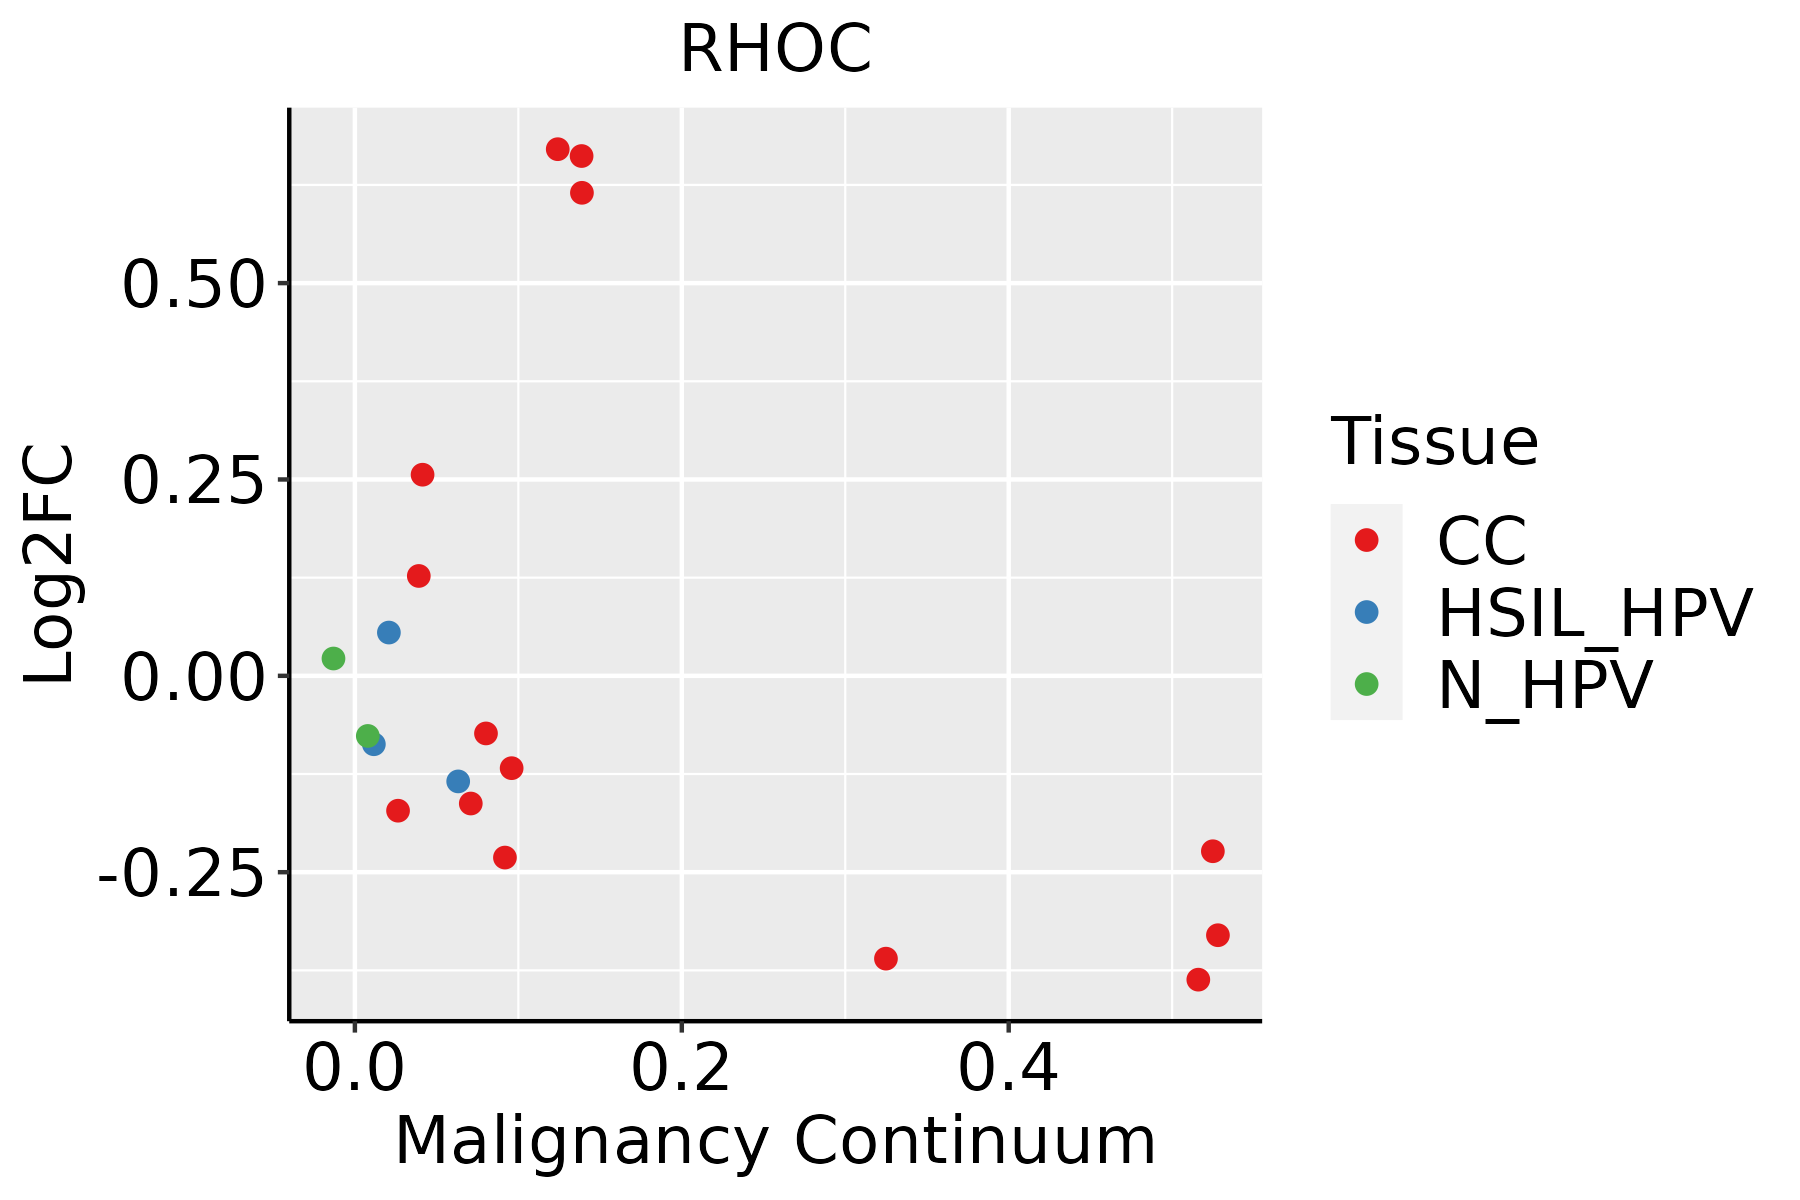 | CC: Cervix cancer |
| HSIL_HPV: HPV-infected high-grade squamous intraepithelial lesions | ||
| N_HPV: HPV-infected normal cervix | ||
| Colorectum (GSE201348) |  | FAP: Familial adenomatous polyposis |
| CRC: Colorectal cancer | ||
| Colorectum (HTA11) |  | AD: Adenomas |
| SER: Sessile serrated lesions | ||
| MSI-H: Microsatellite-high colorectal cancer | ||
| MSS: Microsatellite stable colorectal cancer | ||
| Endometrium | 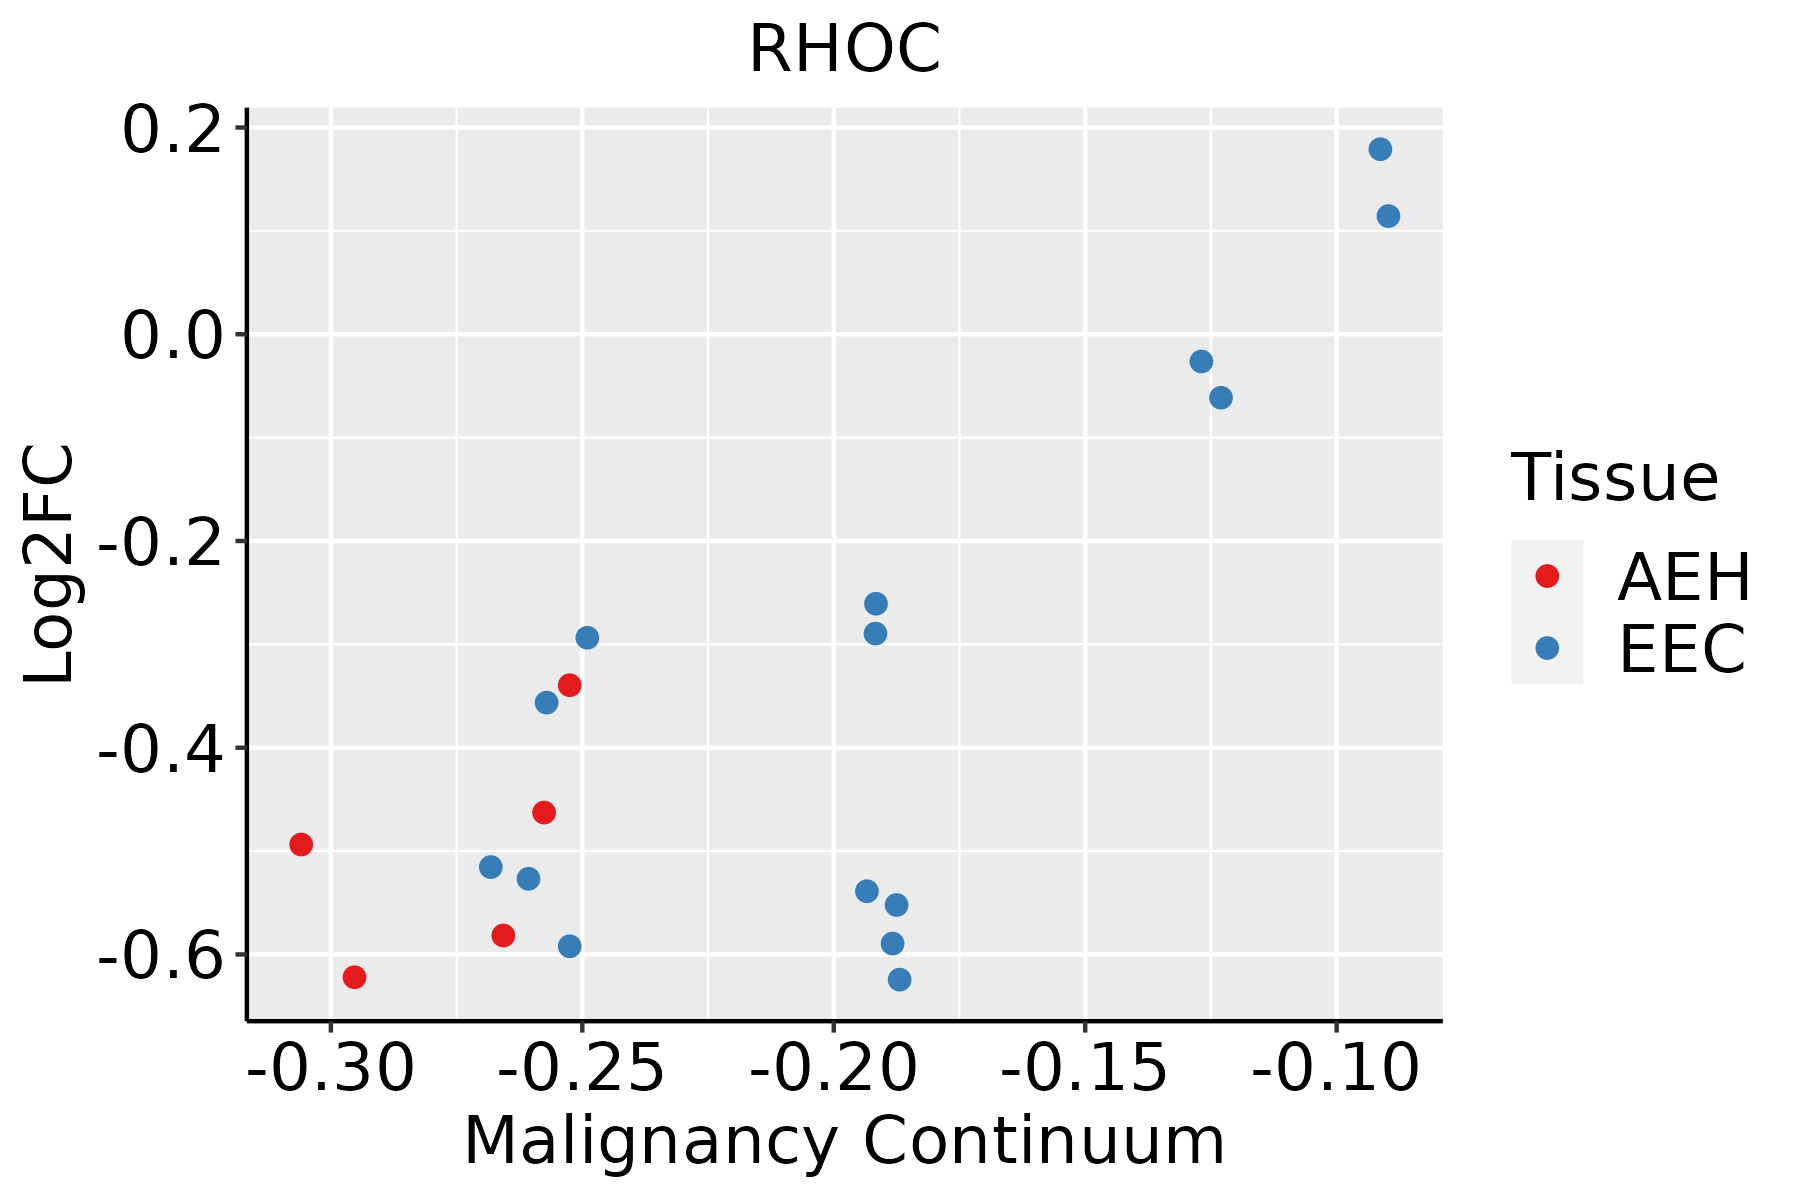 | AEH: Atypical endometrial hyperplasia |
| EEC: Endometrioid Cancer | ||
| Esophagus | 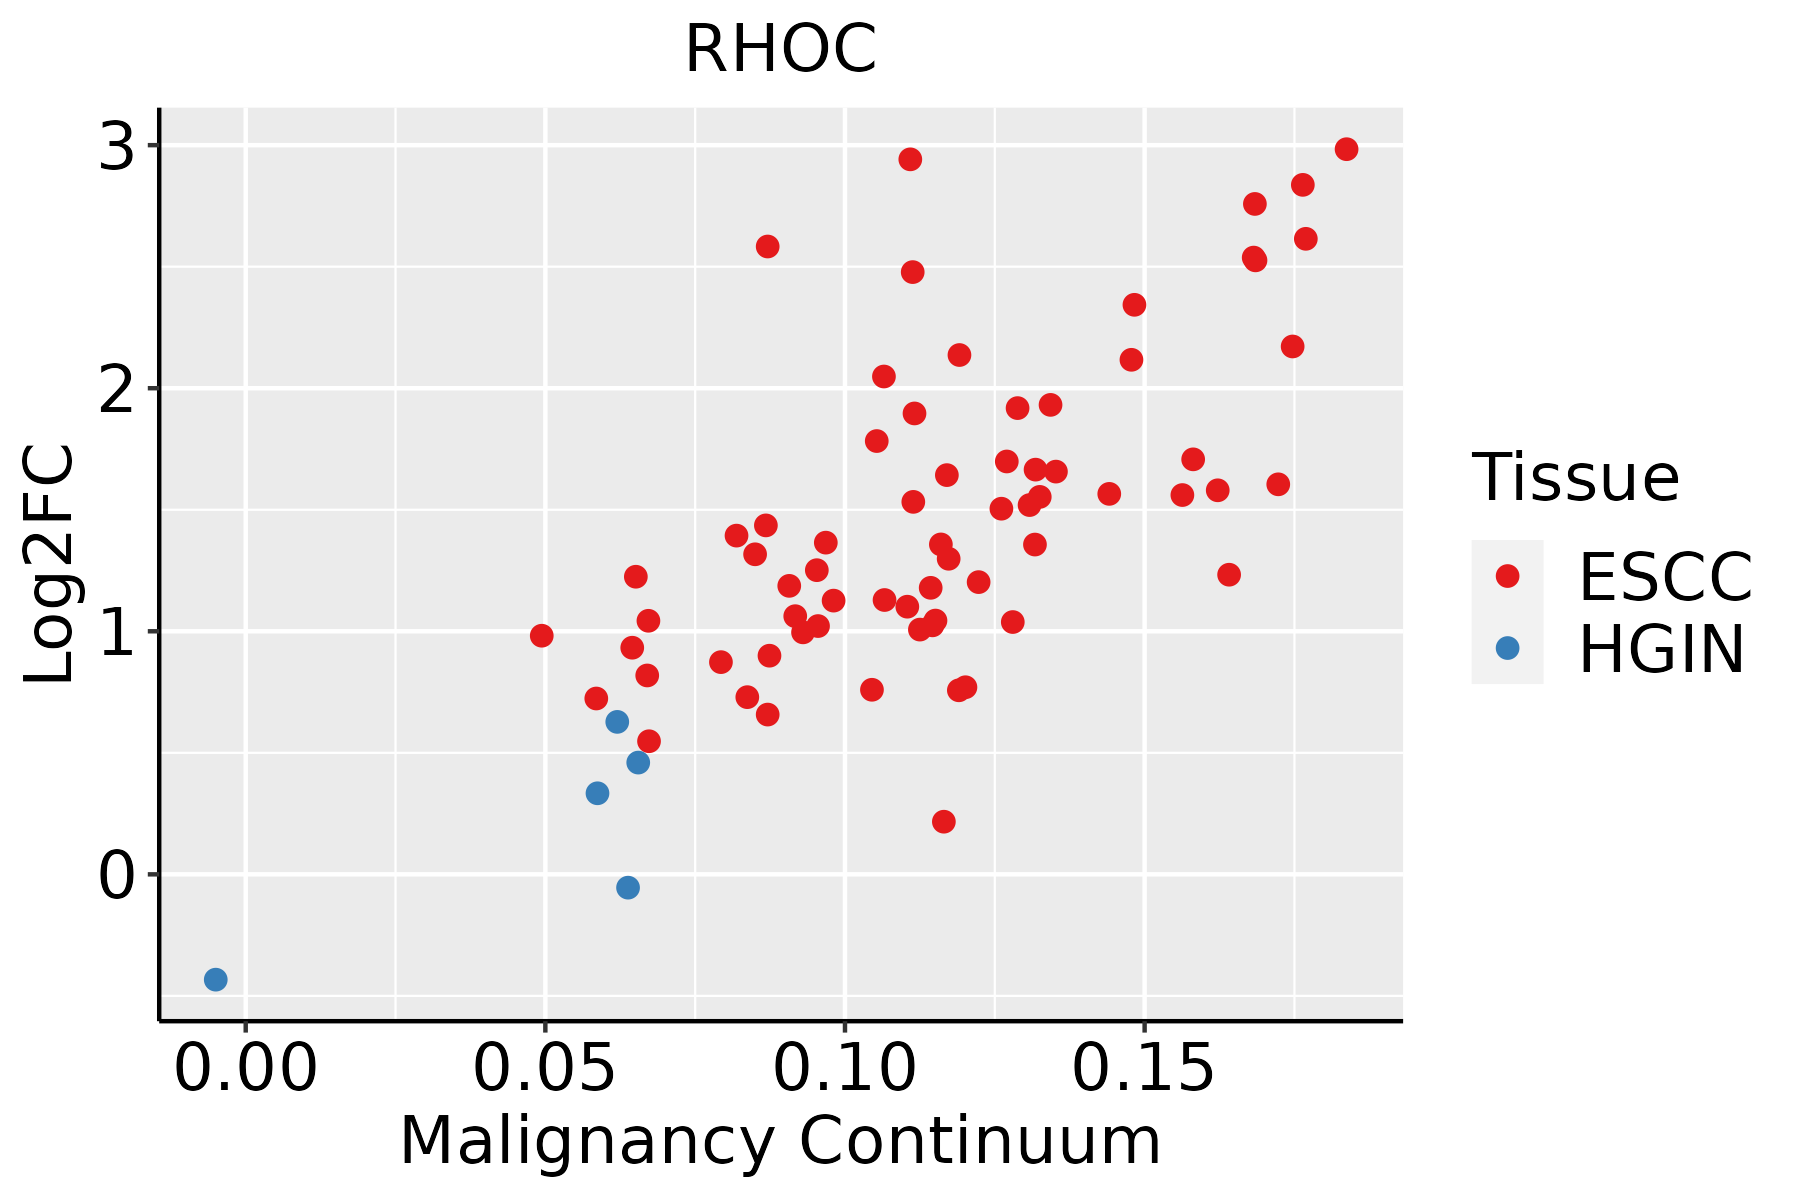 | ESCC: Esophageal squamous cell carcinoma |
| HGIN: High-grade intraepithelial neoplasias | ||
| LGIN: Low-grade intraepithelial neoplasias | ||
| GC |  | CAG: Chronic atrophic gastritis |
| CAG with IM: Chronic atrophic gastritis with intestinal metaplasia | ||
| CSG: Chronic superficial gastritis | ||
| GC: Gastric cancer | ||
| SIM: Severe intestinal metaplasia | ||
| WIM: Wild intestinal metaplasia | ||
| Liver | 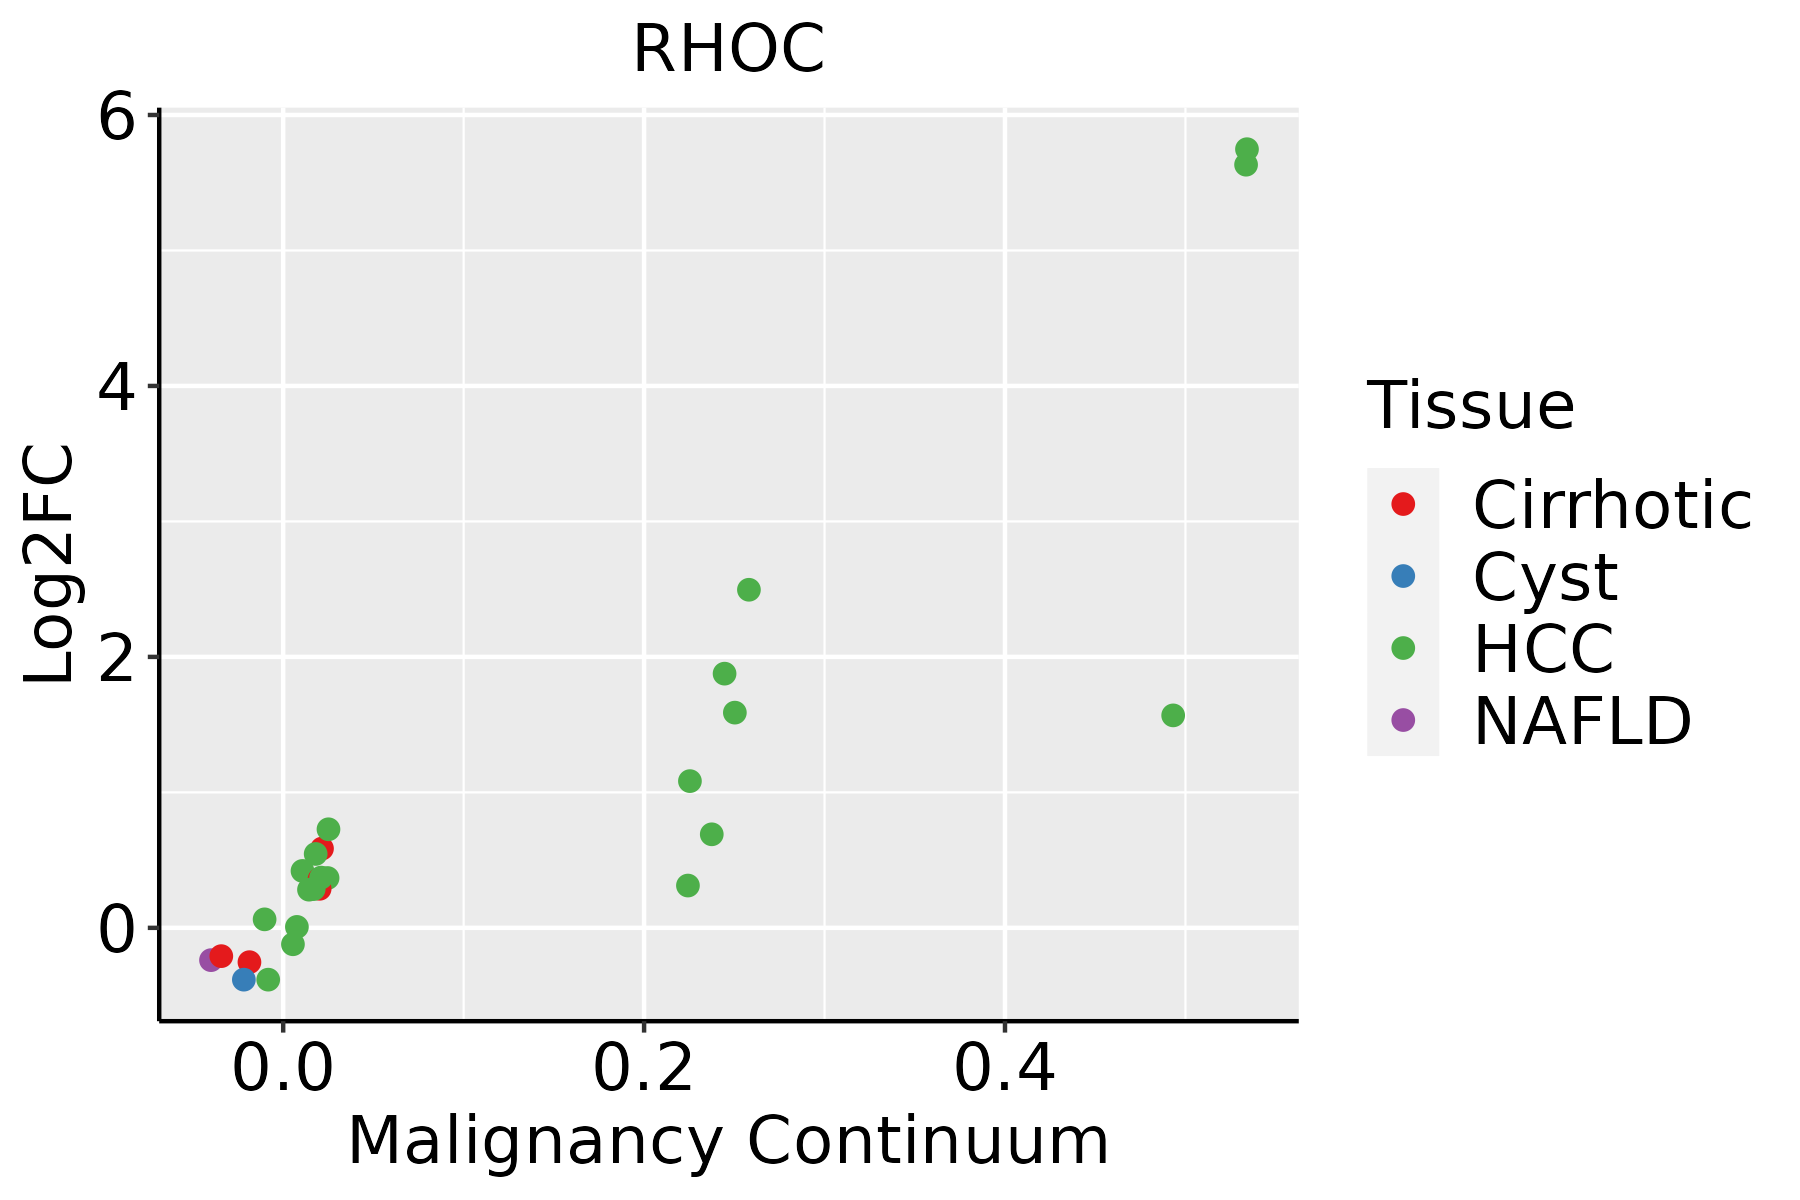 | HCC: Hepatocellular carcinoma |
| NAFLD: Non-alcoholic fatty liver disease | ||
| Oral Cavity | 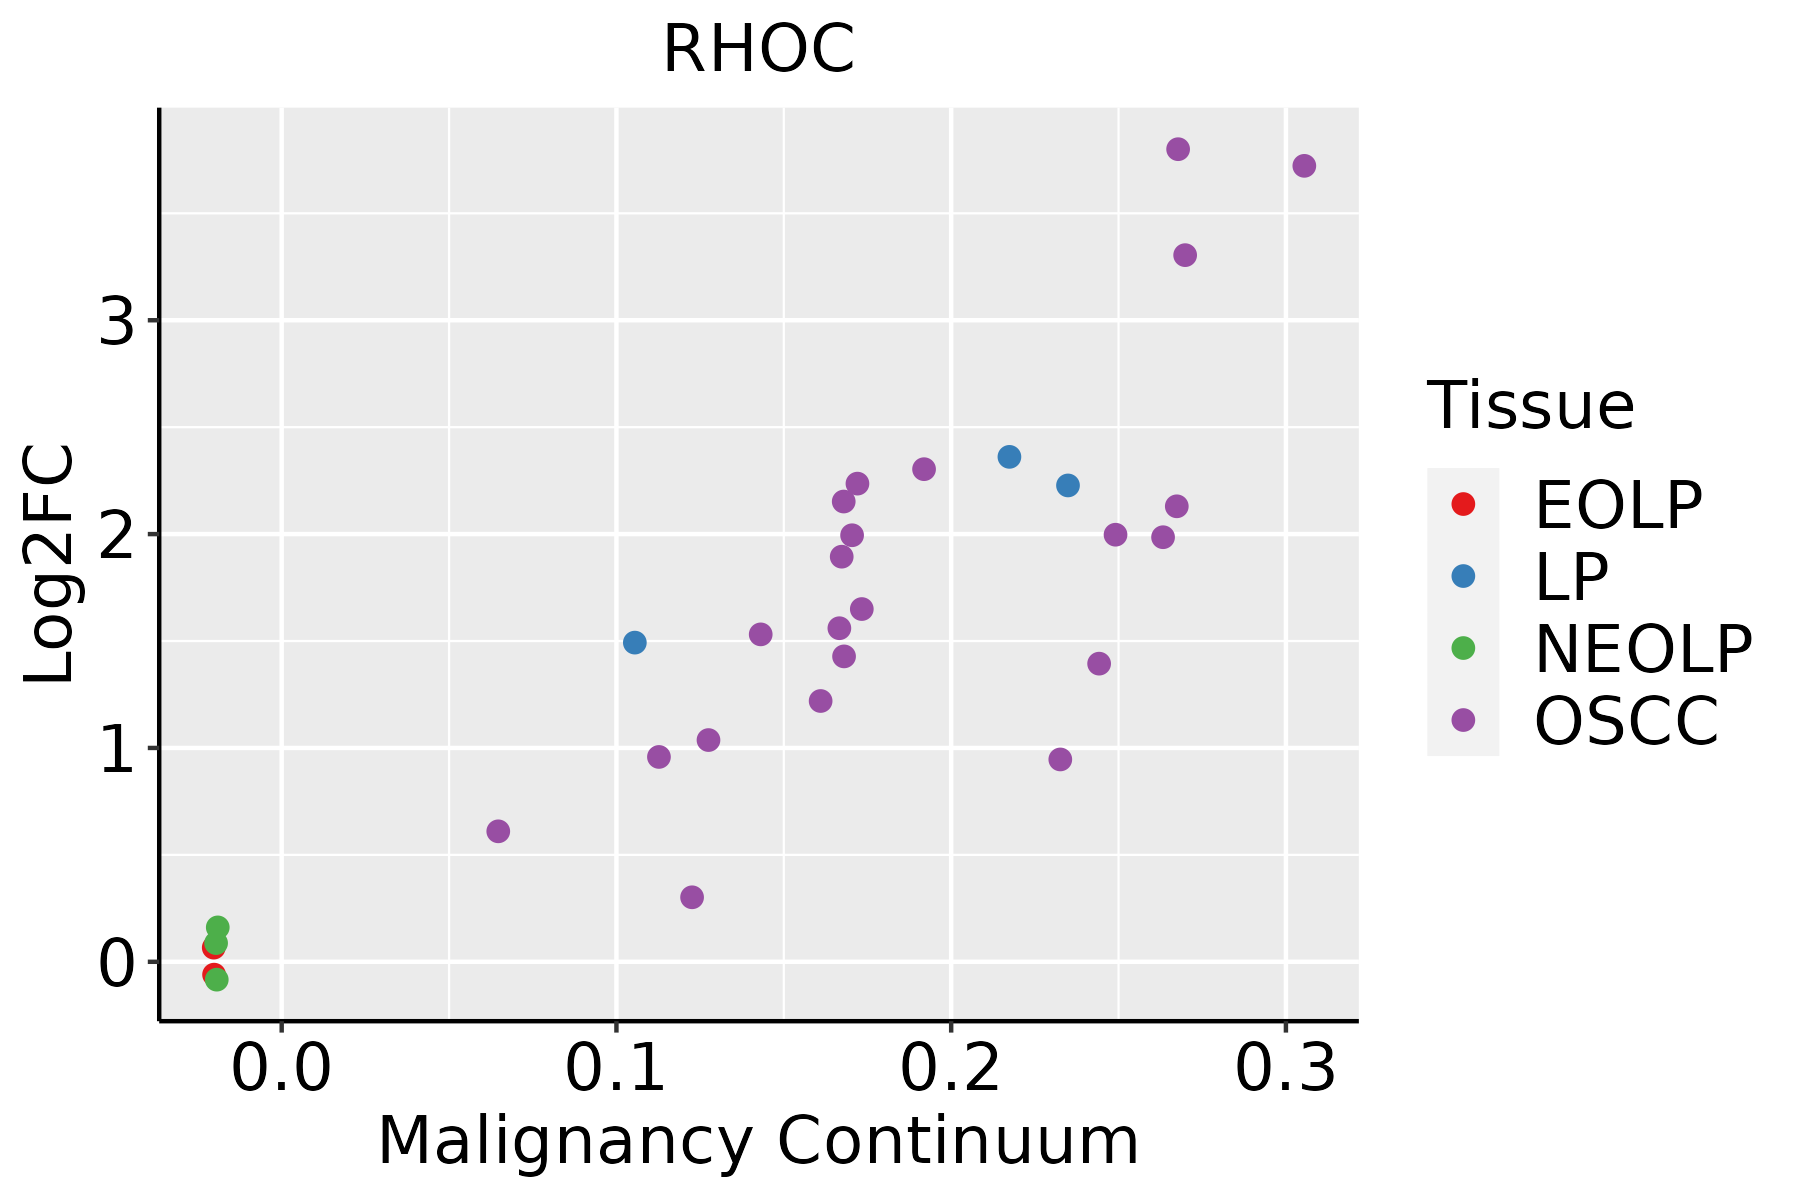 | EOLP: Erosive Oral lichen planus |
| LP: leukoplakia | ||
| NEOLP: Non-erosive oral lichen planus | ||
| OSCC: Oral squamous cell carcinoma | ||
| Prostate | 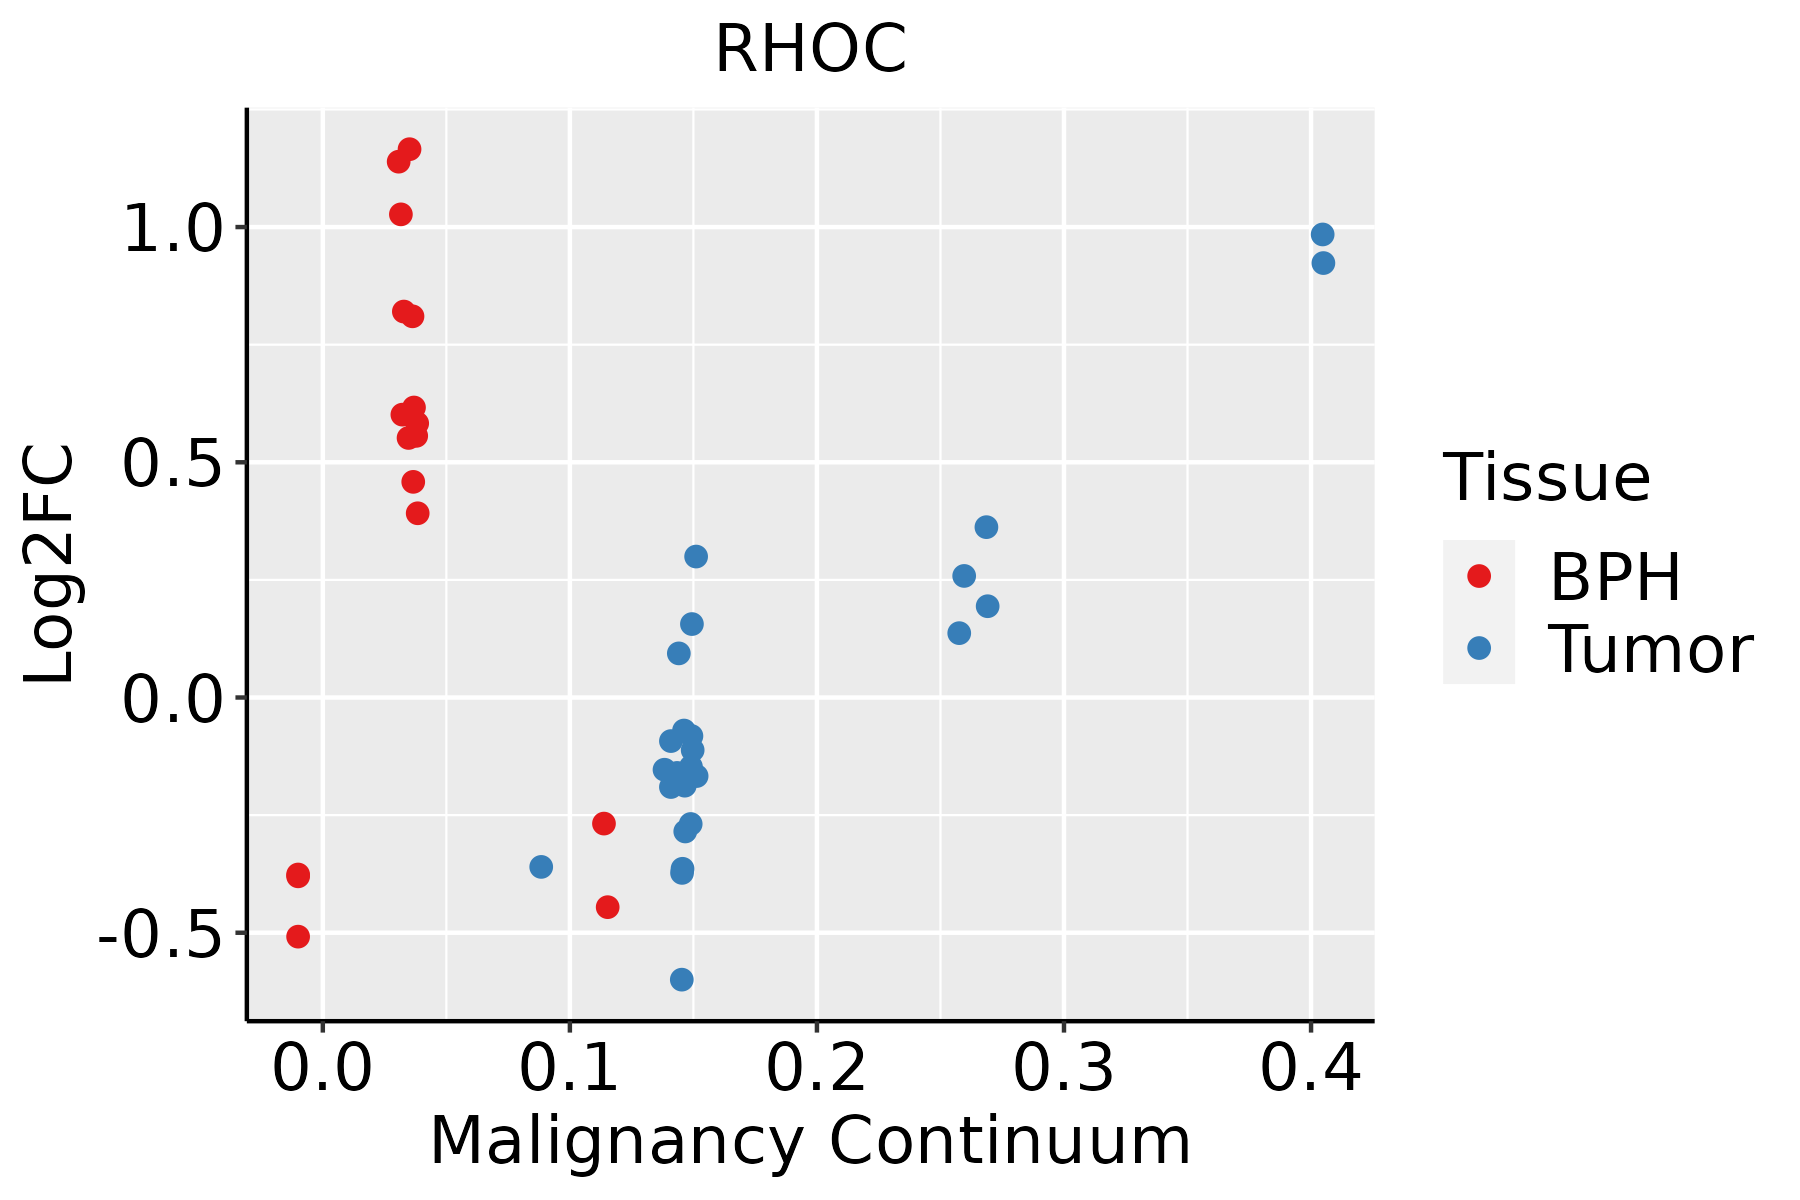 | BPH: Benign Prostatic Hyperplasia |
| Skin |  | AK: Actinic keratosis |
| cSCC: Cutaneous squamous cell carcinoma | ||
| SCCIS:squamous cell carcinoma in situ | ||
| Thyroid |  | ATC: Anaplastic thyroid cancer |
| HT: Hashimoto's thyroiditis | ||
| PTC: Papillary thyroid cancer |
| ∗log2FC in expression of this searched gene in stem-like cells from each diseased tissue sample relative to stem-like cells in normal samples in each tissue plotted against the malignancy continuum. Samples are colored based on if they are from different disease stage. |
Top |
Malignant transformation related pathway analysis |
| Find out the enriched GO biological processes and KEGG pathways involved in transition from healthy to precancer to cancer |
| Tissue | Disease Stage | Enriched GO biological Processes |
| Colorectum | AD |  |
| Colorectum | SER |  |
| Colorectum | MSS |  |
| Colorectum | MSI-H |  |
| Colorectum | FAP |  |
| ∗Top 15 enriched GO BP terms are showed in the bar plot of each disease state in each tissue. Each row represents a significant GO biological process which is colored according to the -log10(p.adjust). |
| Page: 1 2 3 4 5 6 7 8 9 |
| GO ID | Tissue | Disease Stage | Description | Gene Ratio | Bg Ratio | pvalue | p.adjust | Count |
| GO:00432549 | Breast | Precancer | regulation of protein-containing complex assembly | 50/1080 | 428/18723 | 1.63e-06 | 5.97e-05 | 50 |
| GO:00313349 | Breast | Precancer | positive regulation of protein-containing complex assembly | 33/1080 | 237/18723 | 2.39e-06 | 8.21e-05 | 33 |
| GO:00420609 | Breast | Precancer | wound healing | 48/1080 | 422/18723 | 5.48e-06 | 1.63e-04 | 48 |
| GO:19029059 | Breast | Precancer | positive regulation of supramolecular fiber organization | 28/1080 | 209/18723 | 2.79e-05 | 6.28e-04 | 28 |
| GO:19029039 | Breast | Precancer | regulation of supramolecular fiber organization | 42/1080 | 383/18723 | 4.92e-05 | 1.04e-03 | 42 |
| GO:00329709 | Breast | Precancer | regulation of actin filament-based process | 42/1080 | 397/18723 | 1.11e-04 | 2.01e-03 | 42 |
| GO:00514959 | Breast | Precancer | positive regulation of cytoskeleton organization | 28/1080 | 226/18723 | 1.13e-04 | 2.04e-03 | 28 |
| GO:00070159 | Breast | Precancer | actin filament organization | 44/1080 | 442/18723 | 3.02e-04 | 4.35e-03 | 44 |
| GO:00329569 | Breast | Precancer | regulation of actin cytoskeleton organization | 36/1080 | 358/18723 | 8.56e-04 | 9.88e-03 | 36 |
| GO:01100539 | Breast | Precancer | regulation of actin filament organization | 29/1080 | 278/18723 | 1.50e-03 | 1.55e-02 | 29 |
| GO:00514929 | Breast | Precancer | regulation of stress fiber assembly | 13/1080 | 91/18723 | 2.11e-03 | 2.00e-02 | 13 |
| GO:00514965 | Breast | Precancer | positive regulation of stress fiber assembly | 9/1080 | 52/18723 | 2.67e-03 | 2.36e-02 | 9 |
| GO:00322338 | Breast | Precancer | positive regulation of actin filament bundle assembly | 10/1080 | 63/18723 | 3.07e-03 | 2.62e-02 | 10 |
| GO:00300389 | Breast | Precancer | contractile actin filament bundle assembly | 14/1080 | 106/18723 | 3.07e-03 | 2.62e-02 | 14 |
| GO:00431499 | Breast | Precancer | stress fiber assembly | 14/1080 | 106/18723 | 3.07e-03 | 2.62e-02 | 14 |
| GO:00071638 | Breast | Precancer | establishment or maintenance of cell polarity | 23/1080 | 218/18723 | 3.82e-03 | 3.06e-02 | 23 |
| GO:00510179 | Breast | Precancer | actin filament bundle assembly | 18/1080 | 157/18723 | 4.17e-03 | 3.28e-02 | 18 |
| GO:01100209 | Breast | Precancer | regulation of actomyosin structure organization | 13/1080 | 100/18723 | 4.87e-03 | 3.68e-02 | 13 |
| GO:00615729 | Breast | Precancer | actin filament bundle organization | 18/1080 | 161/18723 | 5.43e-03 | 4.01e-02 | 18 |
| GO:00072496 | Breast | Precancer | I-kappaB kinase/NF-kappaB signaling | 27/1080 | 281/18723 | 6.58e-03 | 4.53e-02 | 27 |
| Page: 1 2 3 4 5 6 7 8 9 10 11 12 13 14 15 16 17 18 19 20 21 22 23 24 25 26 27 28 29 30 31 32 33 34 35 36 37 38 39 40 41 42 |
| Pathway ID | Tissue | Disease Stage | Description | Gene Ratio | Bg Ratio | pvalue | p.adjust | qvalue | Count |
| Page: 1 |
Top |
Cell-cell communication analysis |
| Identification of potential cell-cell interactions between two cell types and their ligand-receptor pairs for different disease states |
| Ligand | Receptor | LRpair | Pathway | Tissue | Disease Stage |
| Page: 1 |
Top |
Single-cell gene regulatory network inference analysis |
| Find out the significant the regulons (TFs) and the target genes of each regulon across cell types for different disease states |
| TF | Cell Type | Tissue | Disease Stage | Target Gene | RSS | Regulon Activity |
| ∗The dot plots of a searched regulon are shown for all cell subpopulations in each disease state of each tissue based on the regulon specific score inferred using pySCENIC and by calculating the average expression. |
| Page: 1 |
Top |
Somatic mutation of malignant transformation related genes |
| Annotation of somatic variants for genes involved in malignant transformation |
| Hugo Symbol | Variant Class | Variant Classification | dbSNP RS | HGVSc | HGVSp | HGVSp Short | SWISSPROT | BIOTYPE | SIFT | PolyPhen | Tumor Sample Barcode | Tissue | Histology | Sex | Age | Stage | Therapy Types | Drugs | Outcome |
| RHOC | SNV | Missense_Mutation | novel | c.125N>G | p.Tyr42Cys | p.Y42C | P08134 | protein_coding | deleterious(0.02) | possibly_damaging(0.654) | TCGA-AC-A3OD-01 | Breast | breast invasive carcinoma | Female | >=65 | I/II | Unknown | Unknown | SD |
| RHOC | SNV | Missense_Mutation | novel | c.424N>A | p.Glu142Lys | p.E142K | P08134 | protein_coding | deleterious(0.04) | benign(0.105) | TCGA-AR-A2LK-01 | Breast | breast invasive carcinoma | Female | <65 | III/IV | Hormone Therapy | anastrozole | PD |
| RHOC | insertion | Nonsense_Mutation | novel | c.12_13insTGGCCCTCTGAGGGCATACTACTGTTGAGGTTTTGA | p.Ile4_Arg5insTrpProSerGluGlyIleLeuLeuLeuArgPheTer | p.I4_R5insWPSEGILLLRF* | P08134 | protein_coding | TCGA-AO-A03T-01 | Breast | breast invasive carcinoma | Female | <65 | I/II | Chemotherapy | cyclophosphamide | SD | ||
| RHOC | SNV | Missense_Mutation | c.70G>A | p.Val24Ile | p.V24I | P08134 | protein_coding | deleterious(0.03) | benign(0.058) | TCGA-2W-A8YY-01 | Cervix | cervical & endocervical cancer | Female | <65 | I/II | Chemotherapy | cisplatin | CR | |
| RHOC | SNV | Missense_Mutation | novel | c.82N>T | p.Asp28Tyr | p.D28Y | P08134 | protein_coding | deleterious(0.01) | probably_damaging(0.954) | TCGA-VS-A957-01 | Cervix | cervical & endocervical cancer | Female | <65 | I/II | Chemotherapy | cisplatin | CR |
| RHOC | SNV | Missense_Mutation | c.358N>A | p.Asp120Asn | p.D120N | P08134 | protein_coding | deleterious(0) | probably_damaging(0.993) | TCGA-AA-A010-01 | Colorectum | colon adenocarcinoma | Female | <65 | I/II | Chemotherapy | folinic | CR | |
| RHOC | SNV | Missense_Mutation | novel | c.82G>T | p.Asp28Tyr | p.D28Y | P08134 | protein_coding | deleterious(0.01) | probably_damaging(0.954) | TCGA-AZ-4315-01 | Colorectum | colon adenocarcinoma | Male | <65 | I/II | Unknown | Unknown | SD |
| RHOC | SNV | Missense_Mutation | rs766734264 | c.526N>T | p.Arg176Trp | p.R176W | P08134 | protein_coding | deleterious(0) | probably_damaging(0.987) | TCGA-NH-A5IV-01 | Colorectum | colon adenocarcinoma | Female | >=65 | I/II | Unknown | Unknown | SD |
| RHOC | SNV | Missense_Mutation | c.193N>T | p.Asp65Tyr | p.D65Y | P08134 | protein_coding | deleterious(0) | probably_damaging(0.997) | TCGA-QG-A5YV-01 | Colorectum | colon adenocarcinoma | Female | <65 | III/IV | Chemotherapy | xeloda | CR | |
| RHOC | SNV | Missense_Mutation | rs779520374 | c.502C>T | p.Arg168Trp | p.R168W | P08134 | protein_coding | deleterious(0.03) | probably_damaging(0.982) | TCGA-EF-5830-01 | Colorectum | rectum adenocarcinoma | Male | <65 | I/II | Unknown | Unknown | SD |
| Page: 1 2 3 |
Top |
Related drugs of malignant transformation related genes |
| Identification of chemicals and drugs interact with genes involved in malignant transfromation |
| (DGIdb 4.0) |
| Entrez ID | Symbol | Category | Interaction Types | Drug Claim Name | Drug Name | PMIDs |
| Page: 1 |

Copyright 2023-Present -The University of Texas Health Science Center at Houston |