
|
|||||
|
 | |
| |
| |
| |
| |
| |
|
Gene: RHOB |
Gene summary for RHOB |
| Gene information | Species | Human | Gene symbol | RHOB | Gene ID | 388 |
| Gene name | ras homolog family member B | |
| Gene Alias | ARH6 | |
| Cytomap | 2p24.1 | |
| Gene Type | protein-coding | GO ID | GO:0000278 | UniProtAcc | P62745 |
Top |
Malignant transformation analysis |
| Identification of the aberrant gene expression in precancerous and cancerous lesions by comparing the gene expression of stem-like cells in diseased tissues with normal stem cells |
| Entrez ID | Symbol | Replicates | Species | Organ | Tissue | Adj P-value | Log2FC | Malignancy |
| 388 | RHOB | GSM4909281 | Human | Breast | IDC | 6.50e-06 | -3.15e-01 | 0.21 |
| 388 | RHOB | GSM4909285 | Human | Breast | IDC | 6.23e-09 | -3.82e-01 | 0.21 |
| 388 | RHOB | GSM4909286 | Human | Breast | IDC | 2.01e-08 | -2.11e-01 | 0.1081 |
| 388 | RHOB | GSM4909289 | Human | Breast | IDC | 2.67e-02 | 5.00e-01 | 0.1064 |
| 388 | RHOB | GSM4909293 | Human | Breast | IDC | 2.50e-22 | 5.59e-01 | 0.1581 |
| 388 | RHOB | GSM4909297 | Human | Breast | IDC | 3.96e-09 | 1.80e-01 | 0.1517 |
| 388 | RHOB | GSM4909298 | Human | Breast | IDC | 2.03e-24 | 5.95e-01 | 0.1551 |
| 388 | RHOB | GSM4909299 | Human | Breast | IDC | 5.78e-05 | 3.48e-01 | 0.035 |
| 388 | RHOB | GSM4909301 | Human | Breast | IDC | 1.08e-16 | 6.01e-01 | 0.1577 |
| 388 | RHOB | GSM4909303 | Human | Breast | IDC | 8.95e-05 | 5.26e-01 | 0.0438 |
| 388 | RHOB | GSM4909304 | Human | Breast | IDC | 4.71e-18 | 4.83e-01 | 0.1636 |
| 388 | RHOB | GSM4909305 | Human | Breast | IDC | 1.12e-02 | 3.12e-01 | 0.0436 |
| 388 | RHOB | GSM4909306 | Human | Breast | IDC | 3.64e-13 | 3.91e-01 | 0.1564 |
| 388 | RHOB | GSM4909308 | Human | Breast | IDC | 4.59e-11 | 3.42e-01 | 0.158 |
| 388 | RHOB | GSM4909311 | Human | Breast | IDC | 1.56e-21 | 3.39e-02 | 0.1534 |
| 388 | RHOB | GSM4909312 | Human | Breast | IDC | 2.36e-20 | 5.24e-01 | 0.1552 |
| 388 | RHOB | GSM4909313 | Human | Breast | IDC | 9.93e-29 | 7.33e-01 | 0.0391 |
| 388 | RHOB | GSM4909317 | Human | Breast | IDC | 2.88e-25 | 6.57e-01 | 0.1355 |
| 388 | RHOB | GSM4909319 | Human | Breast | IDC | 1.41e-28 | 7.95e-02 | 0.1563 |
| 388 | RHOB | GSM4909321 | Human | Breast | IDC | 7.86e-28 | 6.60e-01 | 0.1559 |
| Page: 1 2 3 4 5 6 7 8 9 10 11 12 |
| Tissue | Expression Dynamics | Abbreviation |
| Breast | 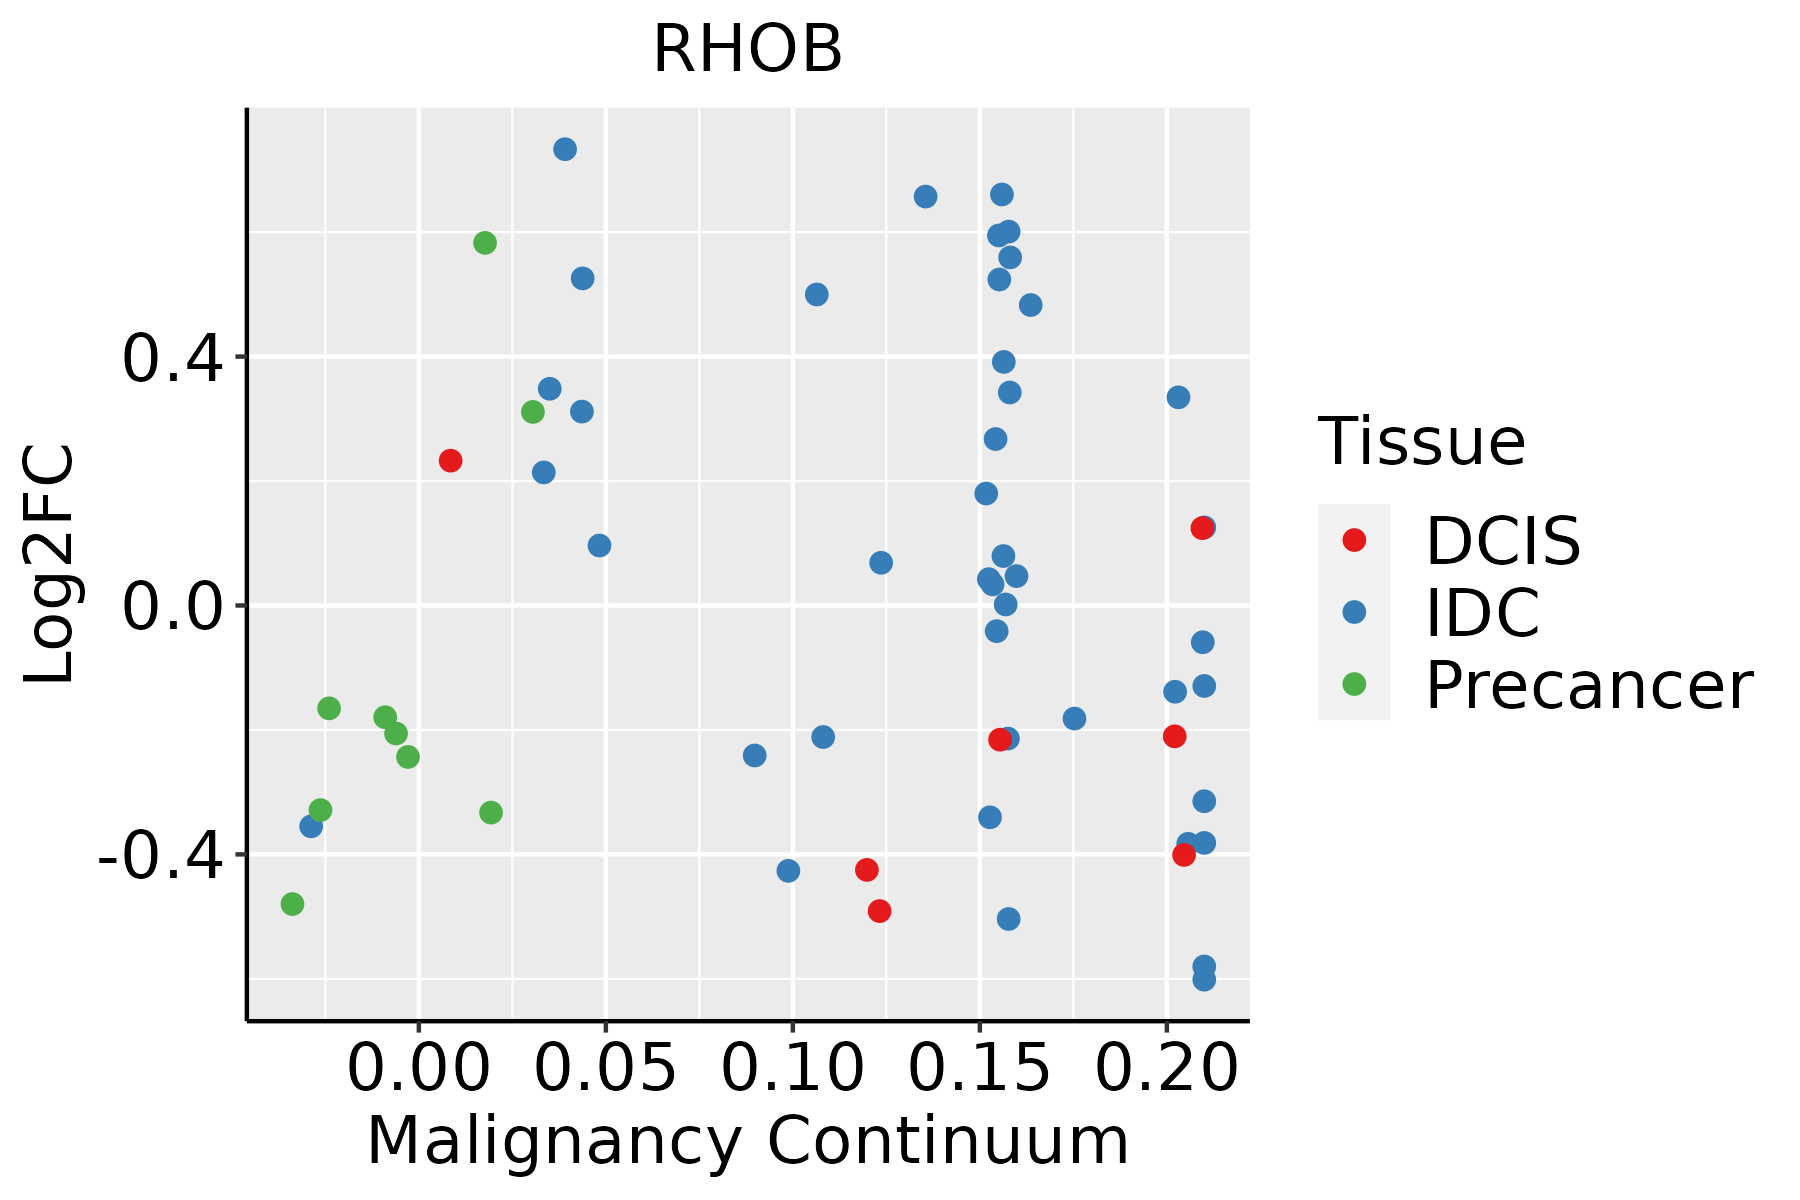 | IDC: Invasive ductal carcinoma |
| DCIS: Ductal carcinoma in situ | ||
| Precancer(BRCA1-mut): Precancerous lesion from BRCA1 mutation carriers | ||
| Cervix | 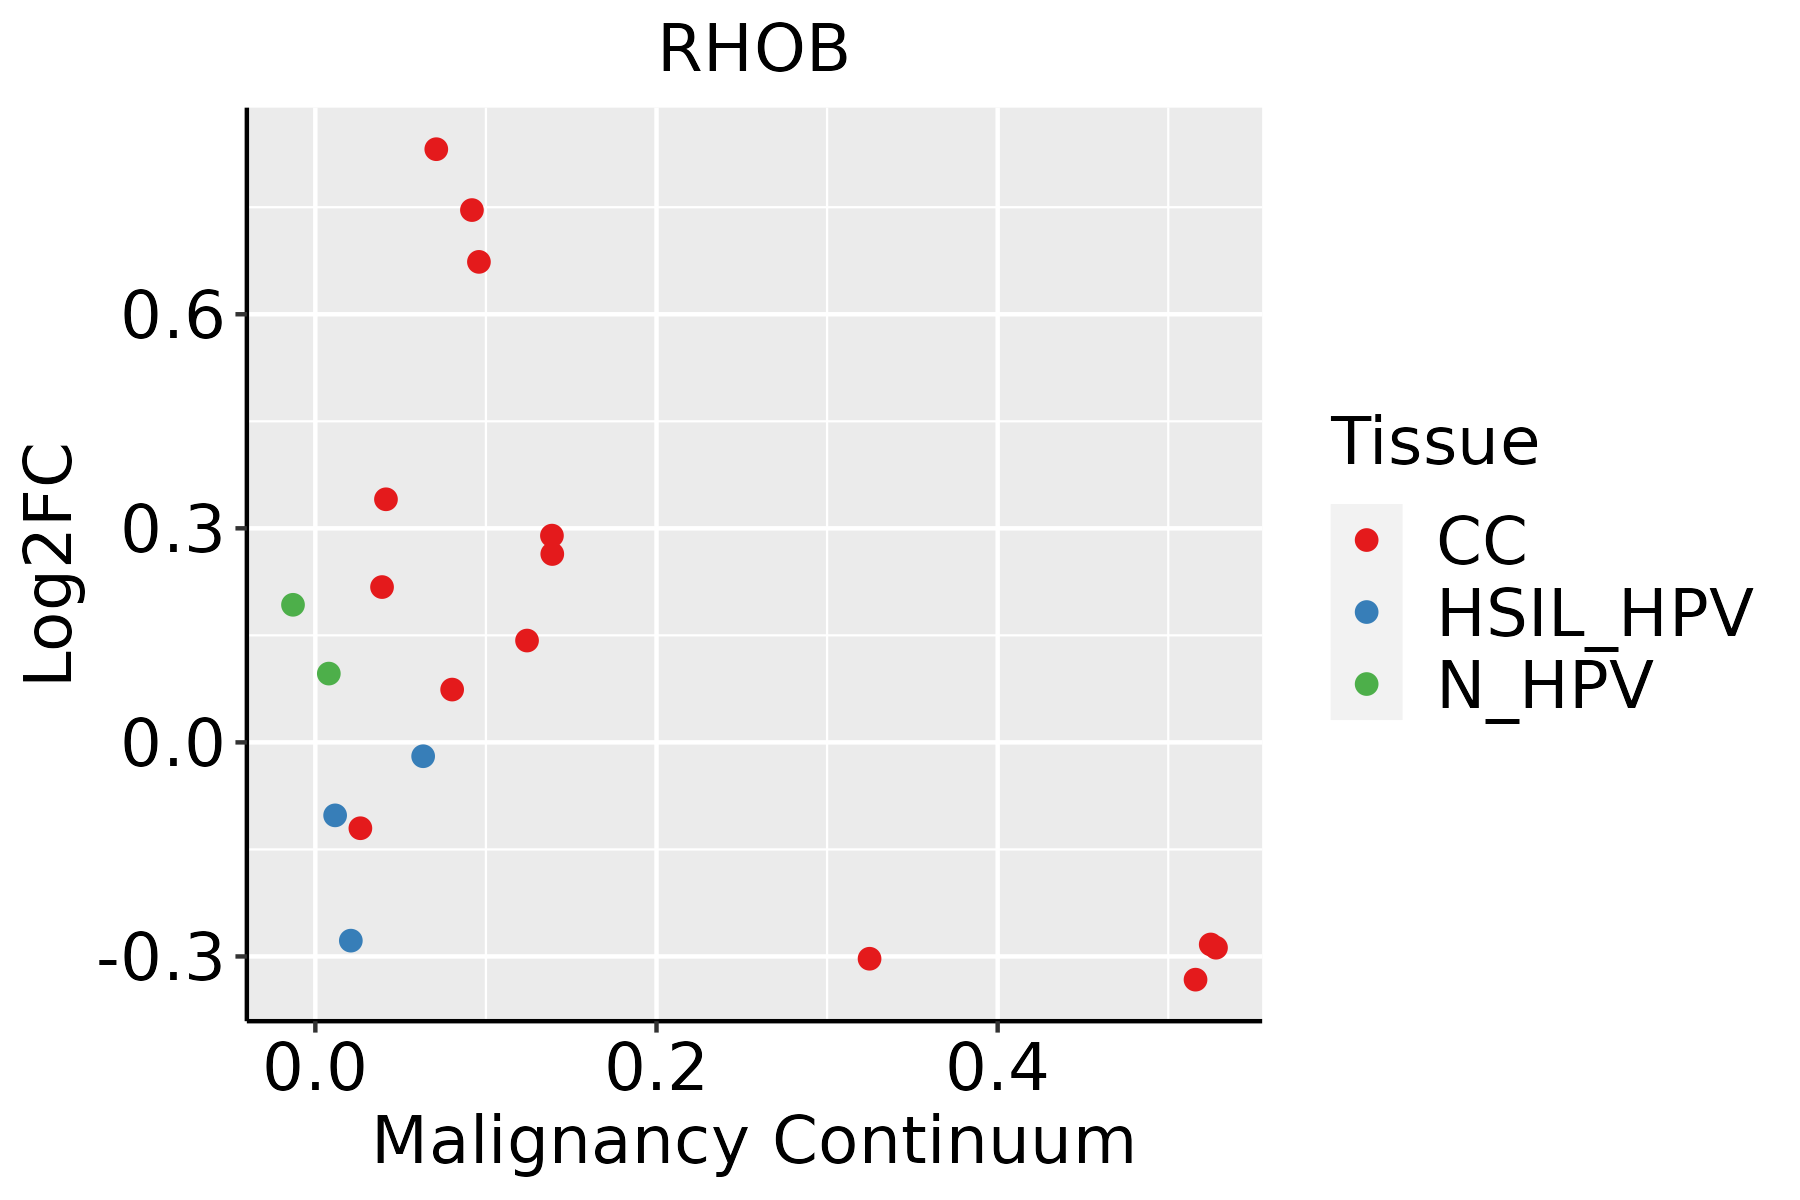 | CC: Cervix cancer |
| HSIL_HPV: HPV-infected high-grade squamous intraepithelial lesions | ||
| N_HPV: HPV-infected normal cervix | ||
| Endometrium | 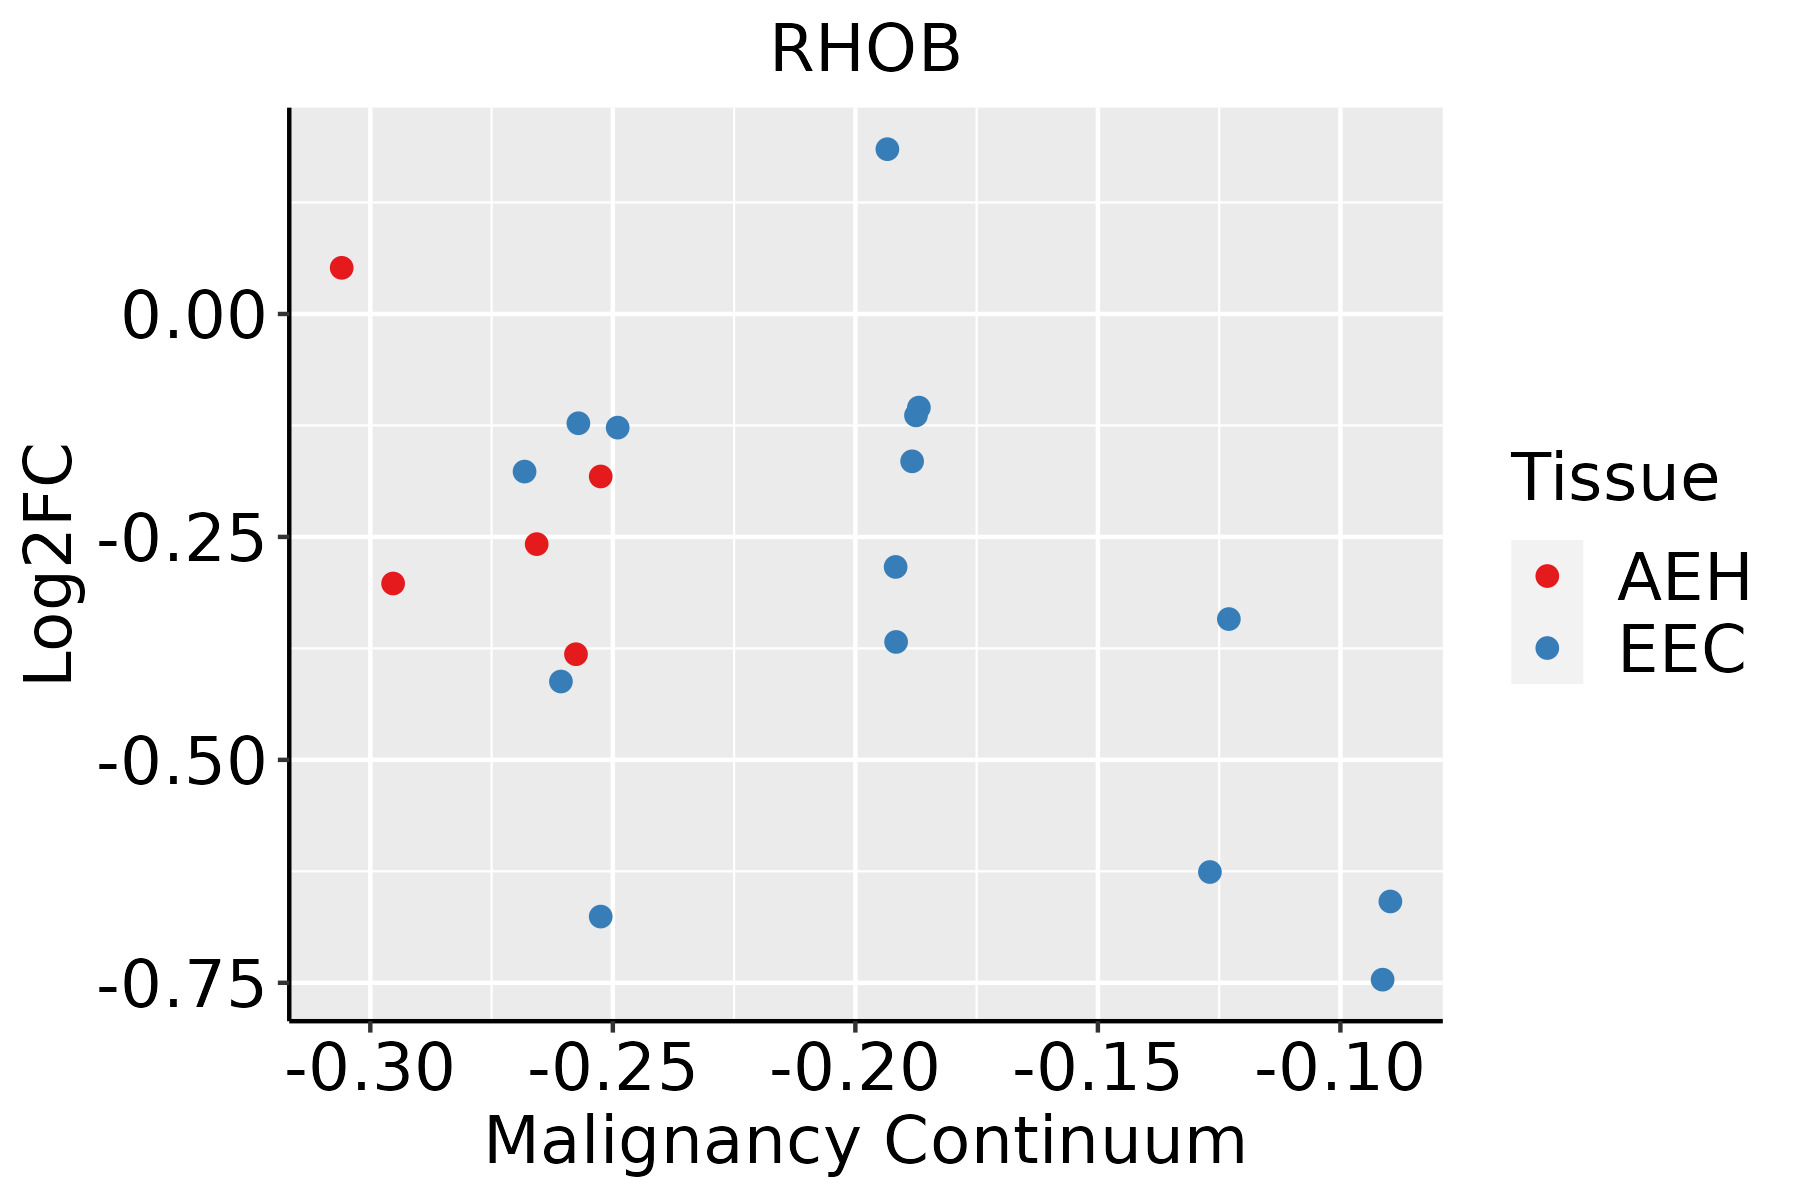 | AEH: Atypical endometrial hyperplasia |
| EEC: Endometrioid Cancer | ||
| Esophagus |  | ESCC: Esophageal squamous cell carcinoma |
| HGIN: High-grade intraepithelial neoplasias | ||
| LGIN: Low-grade intraepithelial neoplasias | ||
| Liver | 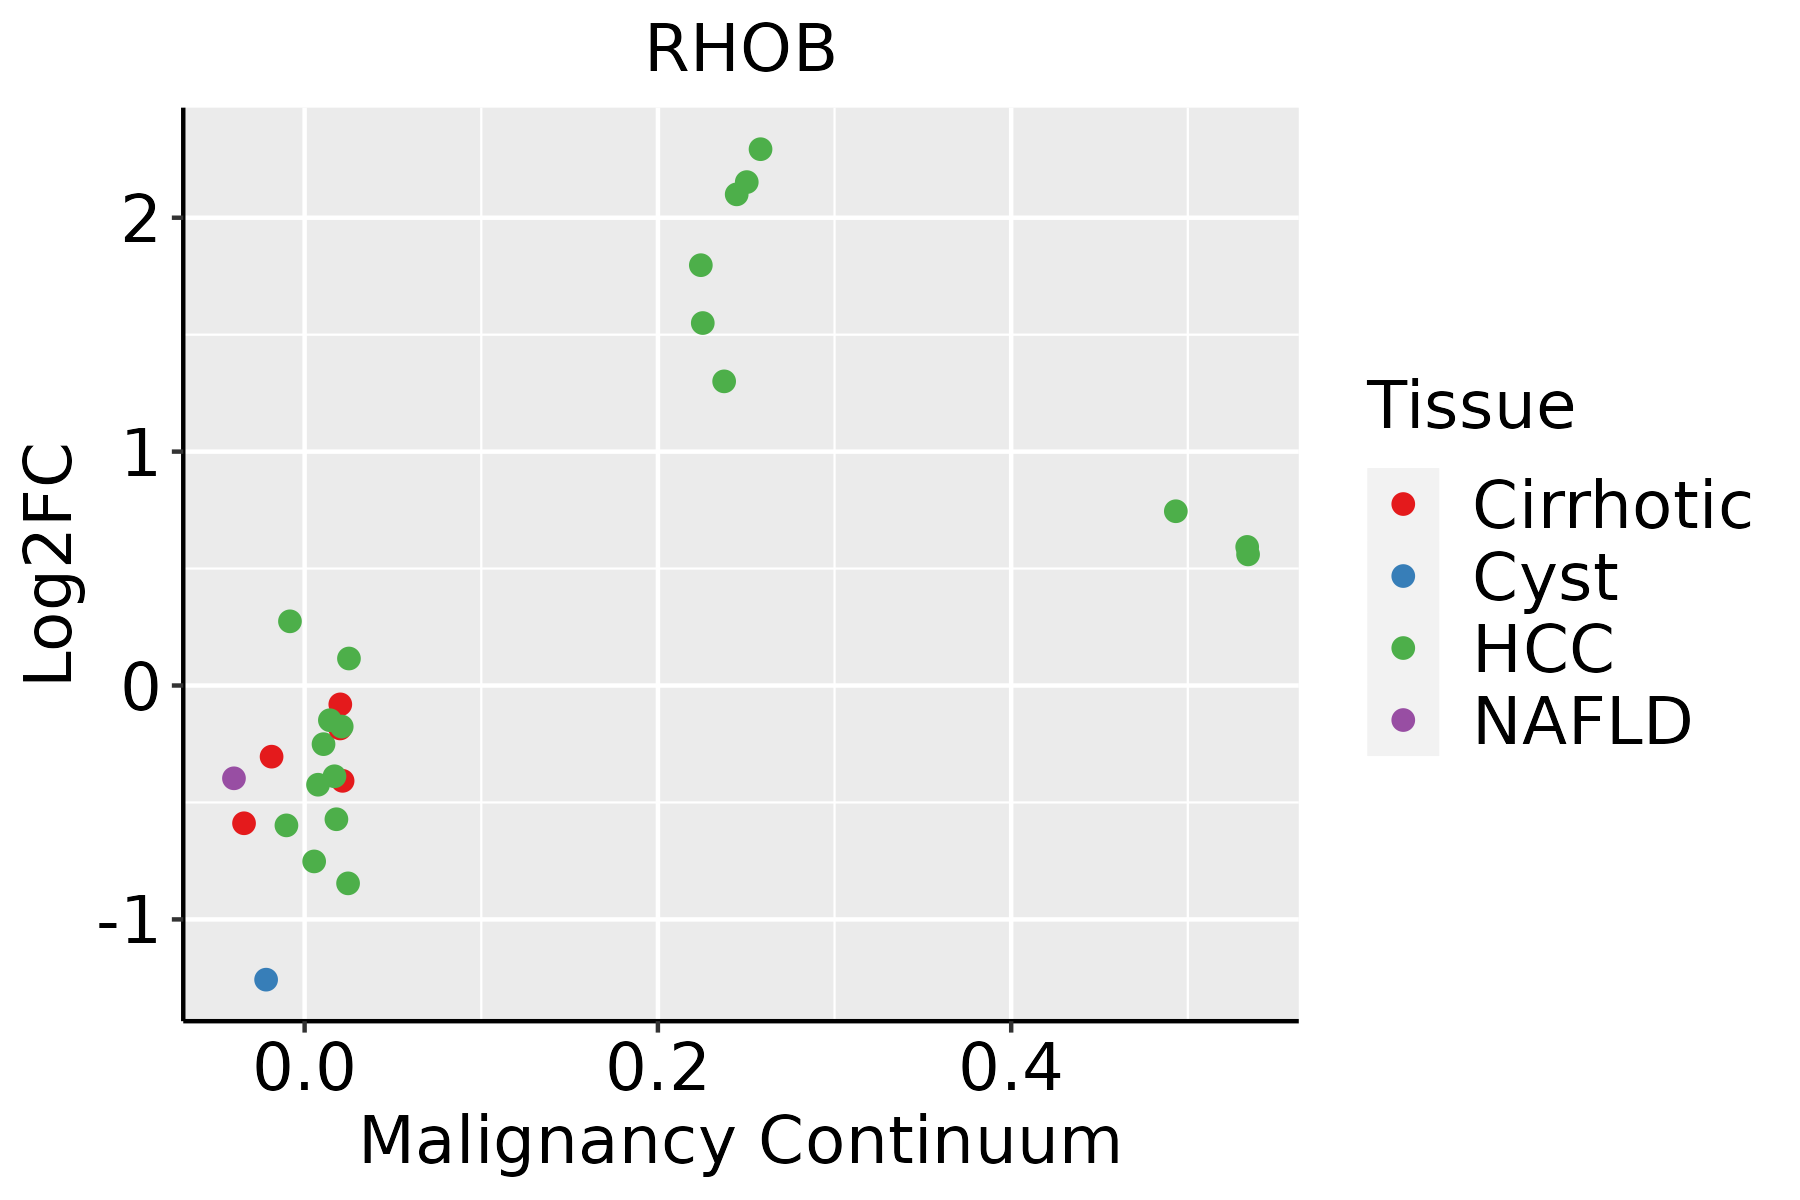 | HCC: Hepatocellular carcinoma |
| NAFLD: Non-alcoholic fatty liver disease | ||
| Lung | 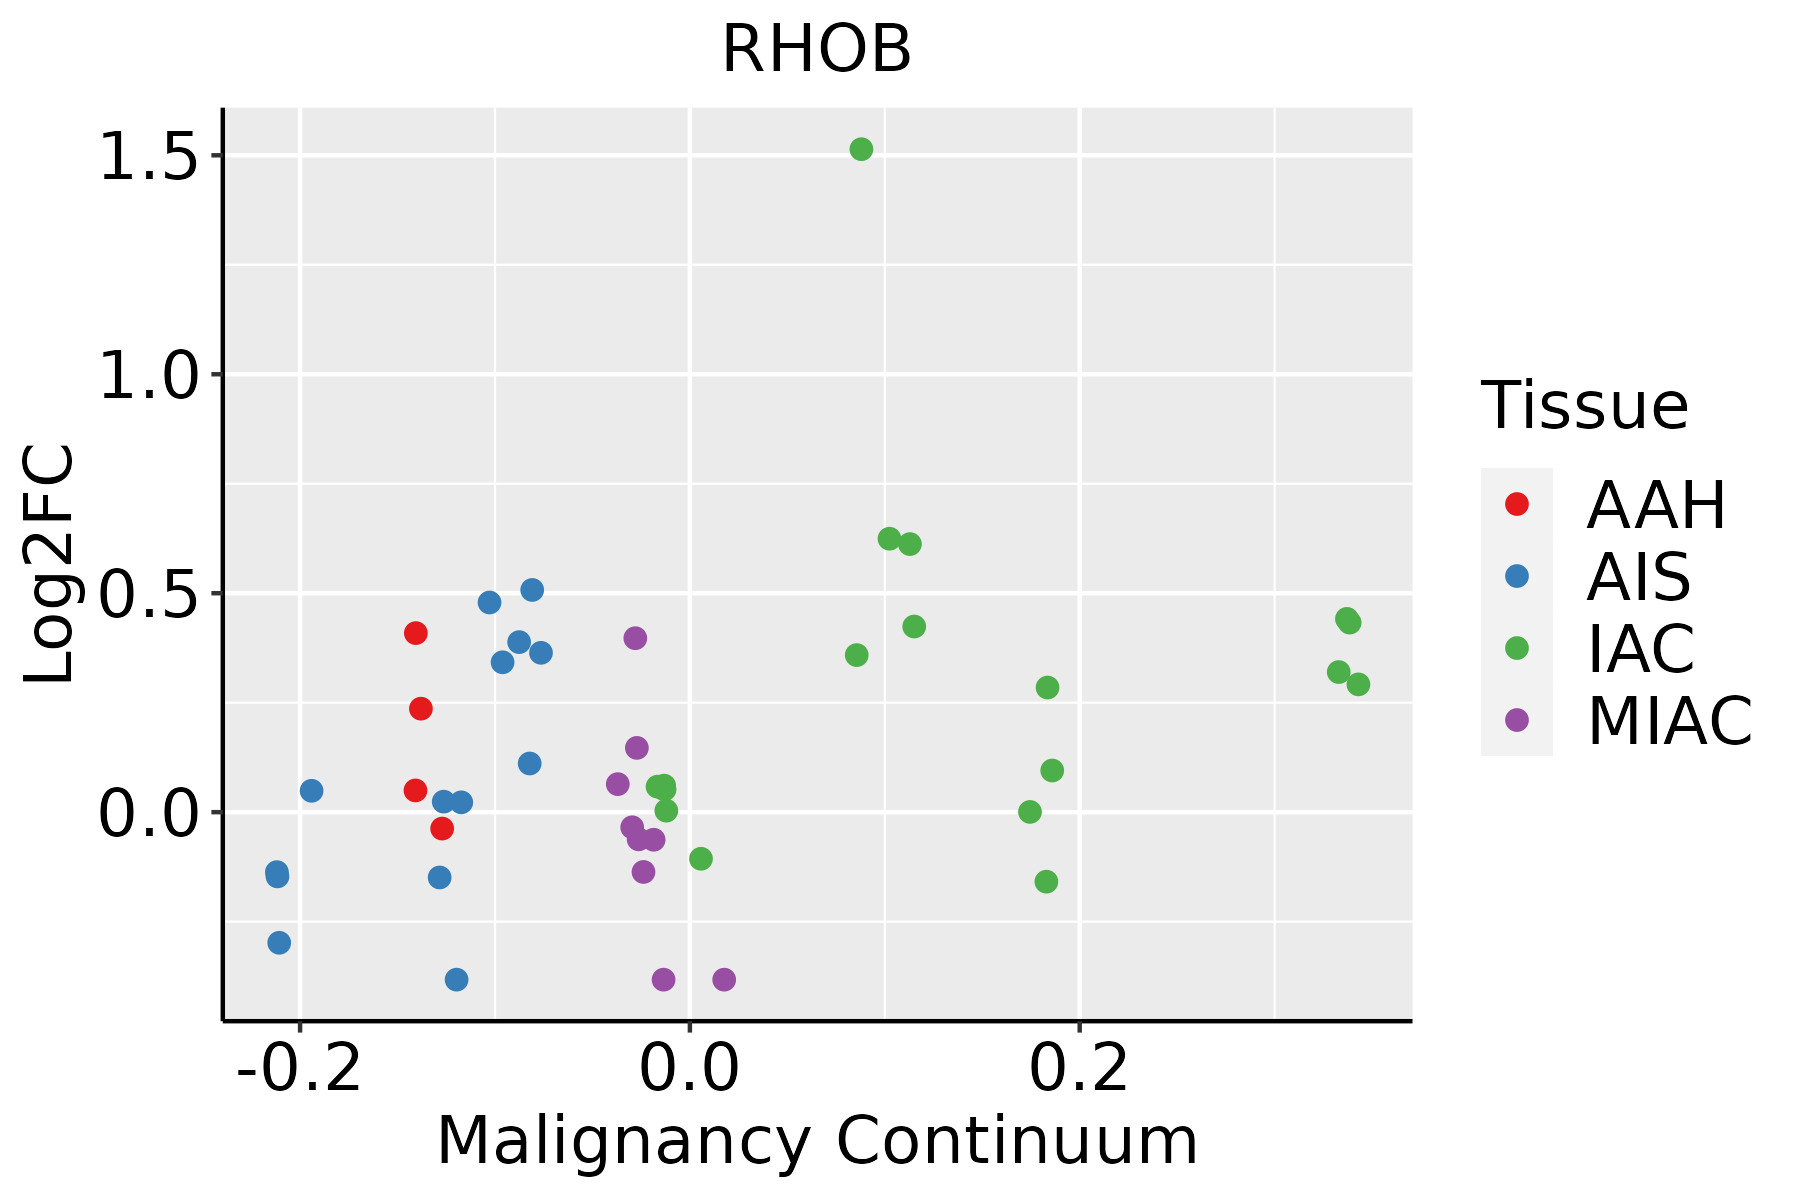 | AAH: Atypical adenomatous hyperplasia |
| AIS: Adenocarcinoma in situ | ||
| IAC: Invasive lung adenocarcinoma | ||
| MIA: Minimally invasive adenocarcinoma | ||
| Oral Cavity | 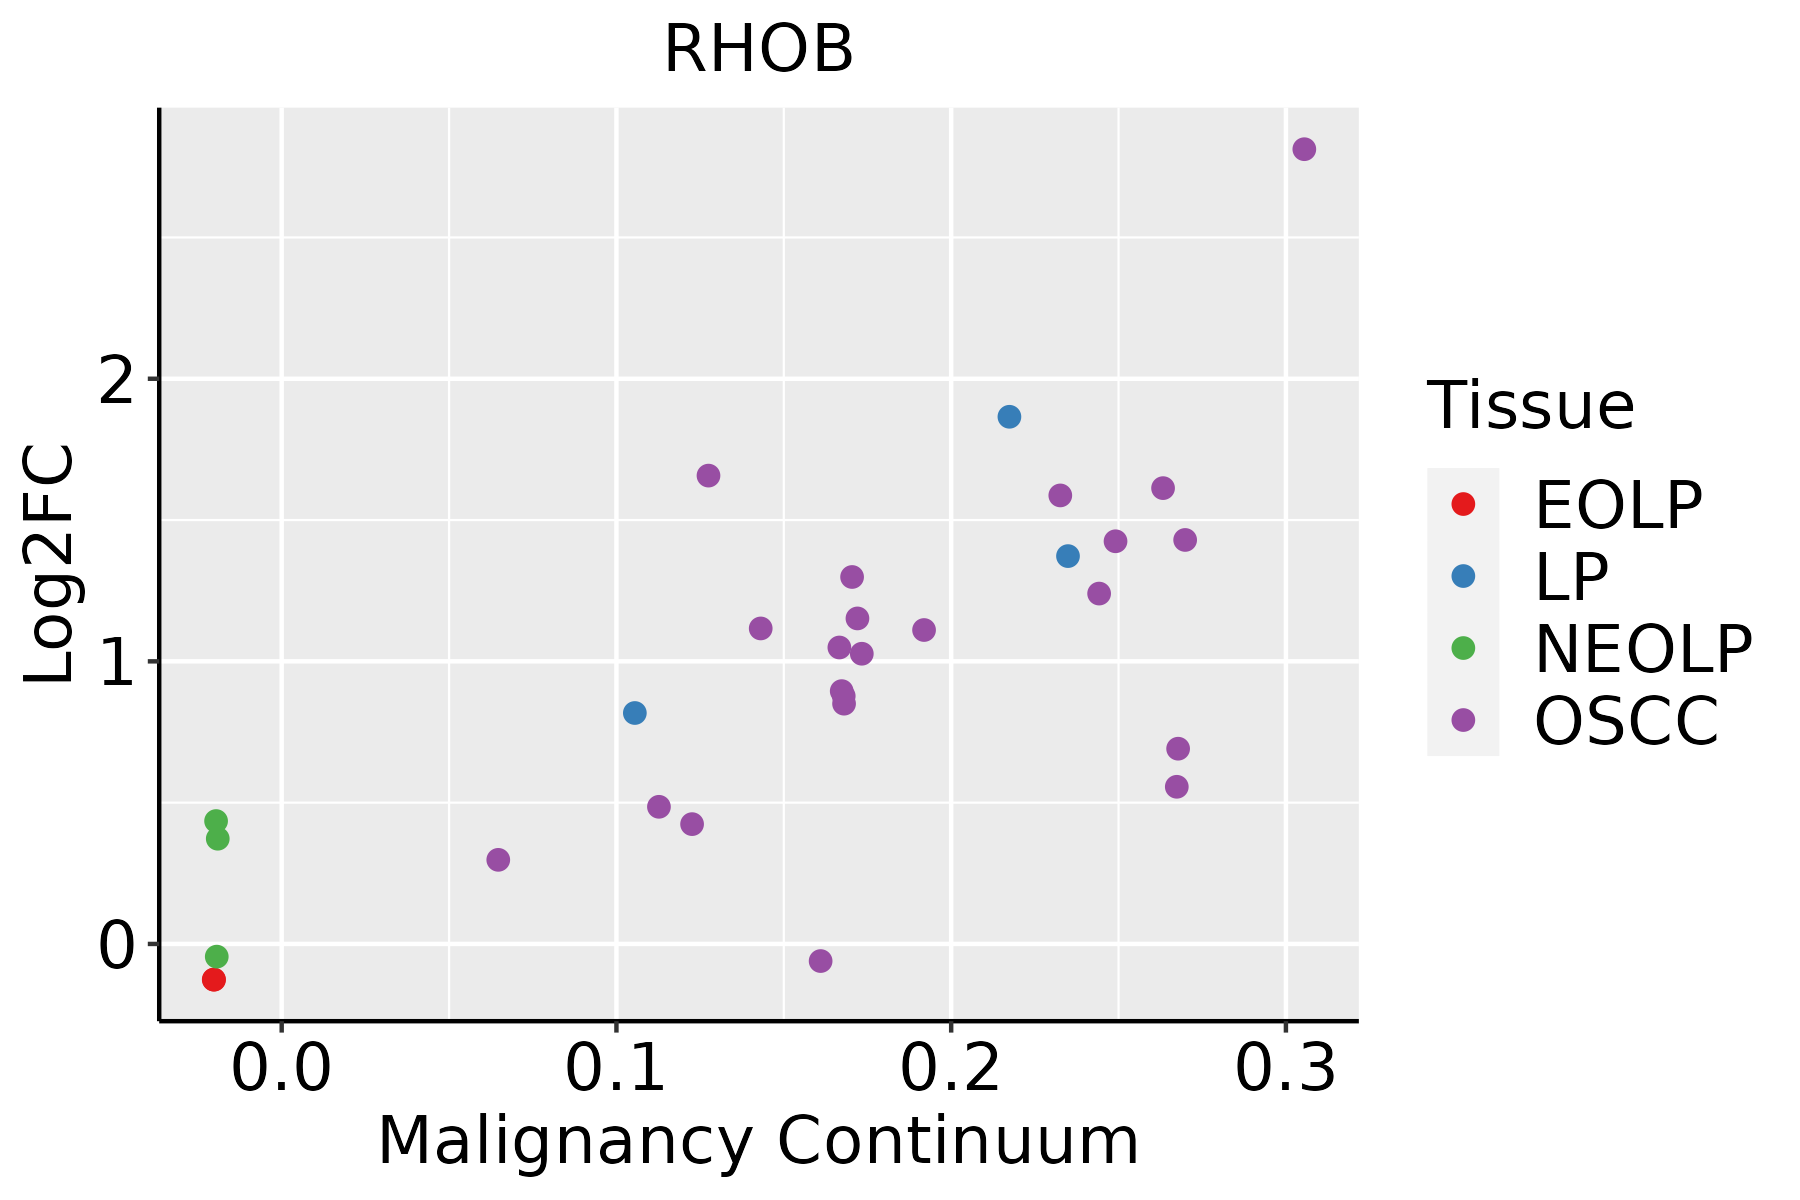 | EOLP: Erosive Oral lichen planus |
| LP: leukoplakia | ||
| NEOLP: Non-erosive oral lichen planus | ||
| OSCC: Oral squamous cell carcinoma | ||
| Prostate | 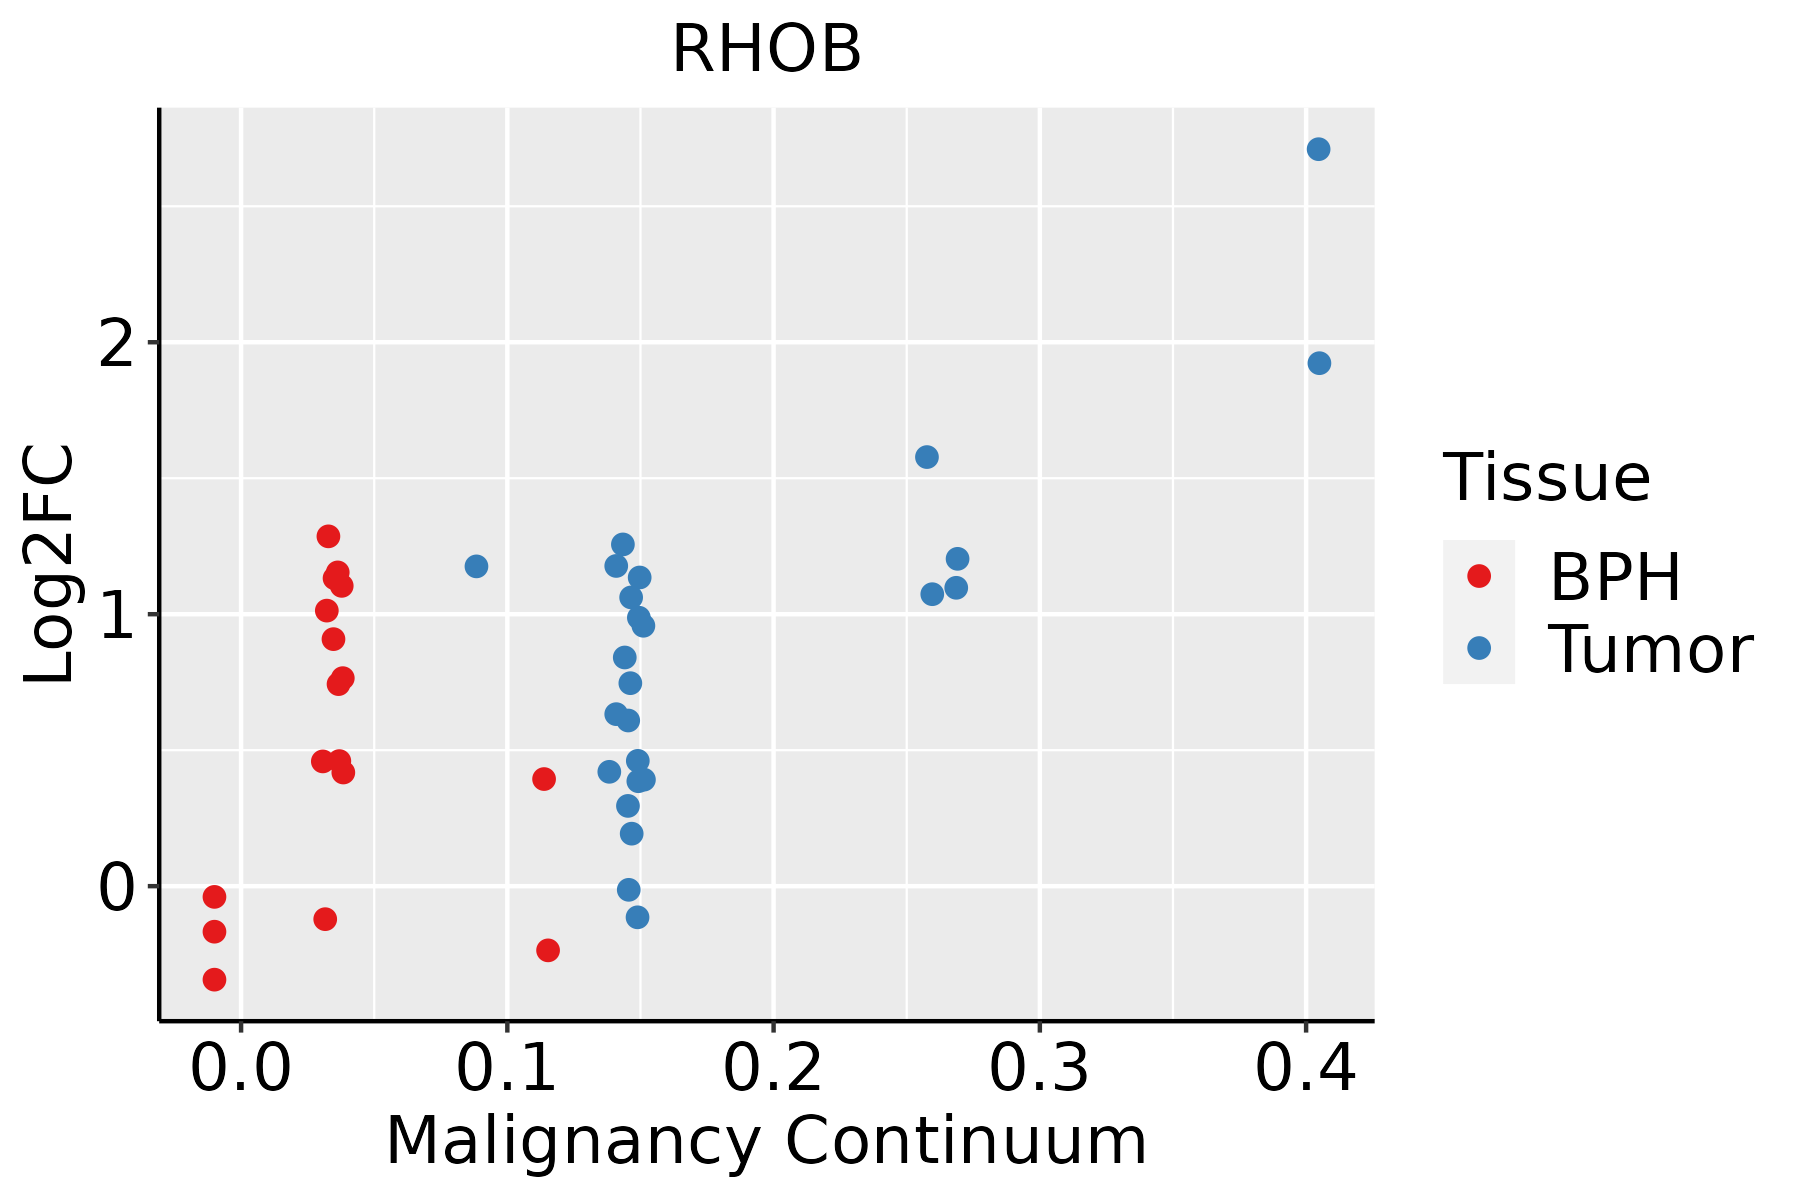 | BPH: Benign Prostatic Hyperplasia |
| Skin |  | AK: Actinic keratosis |
| cSCC: Cutaneous squamous cell carcinoma | ||
| SCCIS:squamous cell carcinoma in situ | ||
| Thyroid |  | ATC: Anaplastic thyroid cancer |
| HT: Hashimoto's thyroiditis | ||
| PTC: Papillary thyroid cancer |
| ∗log2FC in expression of this searched gene in stem-like cells from each diseased tissue sample relative to stem-like cells in normal samples in each tissue plotted against the malignancy continuum. Samples are colored based on if they are from different disease stage. |
Top |
Malignant transformation related pathway analysis |
| Find out the enriched GO biological processes and KEGG pathways involved in transition from healthy to precancer to cancer |
| Tissue | Disease Stage | Enriched GO biological Processes |
| Colorectum | AD |  |
| Colorectum | SER |  |
| Colorectum | MSS |  |
| Colorectum | MSI-H |  |
| Colorectum | FAP |  |
| ∗Top 15 enriched GO BP terms are showed in the bar plot of each disease state in each tissue. Each row represents a significant GO biological process which is colored according to the -log10(p.adjust). |
| Page: 1 2 3 4 5 6 7 8 9 |
| GO ID | Tissue | Disease Stage | Description | Gene Ratio | Bg Ratio | pvalue | p.adjust | Count |
| GO:00069799 | Breast | Precancer | response to oxidative stress | 70/1080 | 446/18723 | 1.59e-14 | 4.26e-12 | 70 |
| GO:00621979 | Breast | Precancer | cellular response to chemical stress | 51/1080 | 337/18723 | 2.40e-10 | 2.34e-08 | 51 |
| GO:00003029 | Breast | Precancer | response to reactive oxygen species | 38/1080 | 222/18723 | 1.47e-09 | 1.23e-07 | 38 |
| GO:00345999 | Breast | Precancer | cellular response to oxidative stress | 42/1080 | 288/18723 | 2.78e-08 | 1.79e-06 | 42 |
| GO:00425429 | Breast | Precancer | response to hydrogen peroxide | 26/1080 | 146/18723 | 2.52e-07 | 1.26e-05 | 26 |
| GO:00106348 | Breast | Precancer | positive regulation of epithelial cell migration | 25/1080 | 176/18723 | 2.75e-05 | 6.21e-04 | 25 |
| GO:00346149 | Breast | Precancer | cellular response to reactive oxygen species | 23/1080 | 155/18723 | 2.82e-05 | 6.31e-04 | 23 |
| GO:00106319 | Breast | Precancer | epithelial cell migration | 40/1080 | 357/18723 | 4.57e-05 | 9.71e-04 | 40 |
| GO:00901329 | Breast | Precancer | epithelium migration | 40/1080 | 360/18723 | 5.51e-05 | 1.14e-03 | 40 |
| GO:00435426 | Breast | Precancer | endothelial cell migration | 33/1080 | 279/18723 | 7.28e-05 | 1.44e-03 | 33 |
| GO:00901309 | Breast | Precancer | tissue migration | 40/1080 | 365/18723 | 7.48e-05 | 1.47e-03 | 40 |
| GO:00105953 | Breast | Precancer | positive regulation of endothelial cell migration | 20/1080 | 133/18723 | 7.59e-05 | 1.48e-03 | 20 |
| GO:00093148 | Breast | Precancer | response to radiation | 47/1080 | 456/18723 | 8.39e-05 | 1.62e-03 | 47 |
| GO:00712147 | Breast | Precancer | cellular response to abiotic stimulus | 37/1080 | 331/18723 | 9.12e-05 | 1.73e-03 | 37 |
| GO:01040047 | Breast | Precancer | cellular response to environmental stimulus | 37/1080 | 331/18723 | 9.12e-05 | 1.73e-03 | 37 |
| GO:00329709 | Breast | Precancer | regulation of actin filament-based process | 42/1080 | 397/18723 | 1.11e-04 | 2.01e-03 | 42 |
| GO:00102125 | Breast | Precancer | response to ionizing radiation | 21/1080 | 148/18723 | 1.19e-04 | 2.13e-03 | 21 |
| GO:00106329 | Breast | Precancer | regulation of epithelial cell migration | 33/1080 | 292/18723 | 1.74e-04 | 2.86e-03 | 33 |
| GO:00714785 | Breast | Precancer | cellular response to radiation | 24/1080 | 186/18723 | 1.83e-04 | 2.96e-03 | 24 |
| GO:00714797 | Breast | Precancer | cellular response to ionizing radiation | 13/1080 | 72/18723 | 2.15e-04 | 3.33e-03 | 13 |
| Page: 1 2 3 4 5 6 7 8 9 10 11 12 13 14 15 16 17 18 19 20 21 22 23 24 25 26 27 28 29 30 31 32 33 34 35 36 37 38 39 40 41 42 43 44 45 46 47 48 49 50 51 52 53 54 55 56 |
| Pathway ID | Tissue | Disease Stage | Description | Gene Ratio | Bg Ratio | pvalue | p.adjust | qvalue | Count |
| hsa0513218 | Breast | Precancer | Salmonella infection | 49/684 | 249/8465 | 2.92e-09 | 6.15e-08 | 4.71e-08 | 49 |
| hsa0513219 | Breast | Precancer | Salmonella infection | 49/684 | 249/8465 | 2.92e-09 | 6.15e-08 | 4.71e-08 | 49 |
| hsa0513224 | Breast | IDC | Salmonella infection | 55/867 | 249/8465 | 2.07e-08 | 4.49e-07 | 3.36e-07 | 55 |
| hsa0513234 | Breast | IDC | Salmonella infection | 55/867 | 249/8465 | 2.07e-08 | 4.49e-07 | 3.36e-07 | 55 |
| hsa0513243 | Breast | DCIS | Salmonella infection | 55/846 | 249/8465 | 8.71e-09 | 1.87e-07 | 1.38e-07 | 55 |
| hsa0513253 | Breast | DCIS | Salmonella infection | 55/846 | 249/8465 | 8.71e-09 | 1.87e-07 | 1.38e-07 | 55 |
| hsa0513220 | Cervix | CC | Salmonella infection | 74/1267 | 249/8465 | 1.33e-09 | 2.54e-08 | 1.50e-08 | 74 |
| hsa05132110 | Cervix | CC | Salmonella infection | 74/1267 | 249/8465 | 1.33e-09 | 2.54e-08 | 1.50e-08 | 74 |
| hsa0513225 | Cervix | HSIL_HPV | Salmonella infection | 34/459 | 249/8465 | 5.03e-07 | 1.13e-05 | 9.17e-06 | 34 |
| hsa0513235 | Cervix | HSIL_HPV | Salmonella infection | 34/459 | 249/8465 | 5.03e-07 | 1.13e-05 | 9.17e-06 | 34 |
| hsa0513244 | Cervix | N_HPV | Salmonella infection | 28/349 | 249/8465 | 1.18e-06 | 1.64e-05 | 1.28e-05 | 28 |
| hsa0513254 | Cervix | N_HPV | Salmonella infection | 28/349 | 249/8465 | 1.18e-06 | 1.64e-05 | 1.28e-05 | 28 |
| hsa0513226 | Endometrium | AEH | Salmonella infection | 71/1197 | 249/8465 | 1.69e-09 | 3.44e-08 | 2.52e-08 | 71 |
| hsa05132112 | Endometrium | AEH | Salmonella infection | 71/1197 | 249/8465 | 1.69e-09 | 3.44e-08 | 2.52e-08 | 71 |
| hsa0513227 | Endometrium | EEC | Salmonella infection | 71/1237 | 249/8465 | 7.11e-09 | 1.30e-07 | 9.69e-08 | 71 |
| hsa0513236 | Endometrium | EEC | Salmonella infection | 71/1237 | 249/8465 | 7.11e-09 | 1.30e-07 | 9.69e-08 | 71 |
| hsa05132211 | Esophagus | ESCC | Salmonella infection | 191/4205 | 249/8465 | 6.51e-19 | 5.45e-17 | 2.79e-17 | 191 |
| hsa05132310 | Esophagus | ESCC | Salmonella infection | 191/4205 | 249/8465 | 6.51e-19 | 5.45e-17 | 2.79e-17 | 191 |
| hsa0513214 | Liver | NAFLD | Salmonella infection | 55/1043 | 249/8465 | 8.48e-06 | 3.09e-04 | 2.49e-04 | 55 |
| hsa0513215 | Liver | NAFLD | Salmonella infection | 55/1043 | 249/8465 | 8.48e-06 | 3.09e-04 | 2.49e-04 | 55 |
| Page: 1 2 |
Top |
Cell-cell communication analysis |
| Identification of potential cell-cell interactions between two cell types and their ligand-receptor pairs for different disease states |
| Ligand | Receptor | LRpair | Pathway | Tissue | Disease Stage |
| Page: 1 |
Top |
Single-cell gene regulatory network inference analysis |
| Find out the significant the regulons (TFs) and the target genes of each regulon across cell types for different disease states |
| TF | Cell Type | Tissue | Disease Stage | Target Gene | RSS | Regulon Activity |
| ∗The dot plots of a searched regulon are shown for all cell subpopulations in each disease state of each tissue based on the regulon specific score inferred using pySCENIC and by calculating the average expression. |
| Page: 1 |
Top |
Somatic mutation of malignant transformation related genes |
| Annotation of somatic variants for genes involved in malignant transformation |
| Hugo Symbol | Variant Class | Variant Classification | dbSNP RS | HGVSc | HGVSp | HGVSp Short | SWISSPROT | BIOTYPE | SIFT | PolyPhen | Tumor Sample Barcode | Tissue | Histology | Sex | Age | Stage | Therapy Types | Drugs | Outcome |
| RHOB | SNV | Missense_Mutation | c.37N>T | p.Asp13Tyr | p.D13Y | P62745 | protein_coding | deleterious(0) | probably_damaging(0.999) | TCGA-AO-A0J6-01 | Breast | breast invasive carcinoma | Female | <65 | I/II | Chemotherapy | doxorubicin | SD | |
| RHOB | SNV | Missense_Mutation | novel | c.370G>A | p.Asp124Asn | p.D124N | P62745 | protein_coding | deleterious(0.03) | benign(0.255) | TCGA-ZJ-AAXJ-01 | Cervix | cervical & endocervical cancer | Female | <65 | I/II | Unknown | Unknown | SD |
| RHOB | insertion | Frame_Shift_Ins | novel | c.470_471insTG | p.Glu158AlafsTer84 | p.E158Afs*84 | P62745 | protein_coding | TCGA-FU-A3EO-01 | Cervix | cervical & endocervical cancer | Female | <65 | I/II | Unknown | Unknown | SD | ||
| RHOB | SNV | Missense_Mutation | novel | c.358G>T | p.Asp120Tyr | p.D120Y | P62745 | protein_coding | deleterious(0) | probably_damaging(0.999) | TCGA-A5-A1OF-01 | Endometrium | uterine corpus endometrioid carcinoma | Female | <65 | I/II | Unknown | Unknown | SD |
| RHOB | SNV | Missense_Mutation | c.263N>A | p.Ser88Asn | p.S88N | P62745 | protein_coding | tolerated(0.28) | benign(0.003) | TCGA-AP-A0LM-01 | Endometrium | uterine corpus endometrioid carcinoma | Female | <65 | III/IV | Chemotherapy | cisplatin | SD | |
| RHOB | SNV | Missense_Mutation | novel | c.106C>T | p.Pro36Ser | p.P36S | P62745 | protein_coding | deleterious(0.01) | probably_damaging(0.998) | TCGA-B5-A1MX-01 | Endometrium | uterine corpus endometrioid carcinoma | Female | <65 | I/II | Hormone Therapy | megace | SD |
| RHOB | SNV | Missense_Mutation | novel | c.120G>T | p.Glu40Asp | p.E40D | P62745 | protein_coding | tolerated(0.19) | benign(0.015) | TCGA-E6-A1LX-01 | Endometrium | uterine corpus endometrioid carcinoma | Female | <65 | I/II | Unknown | Unknown | SD |
| RHOB | SNV | Missense_Mutation | novel | c.241N>T | p.Leu81Phe | p.L81F | P62745 | protein_coding | deleterious(0.03) | probably_damaging(0.991) | TCGA-DD-AAC8-01 | Liver | liver hepatocellular carcinoma | Male | >=65 | I/II | Unknown | Unknown | SD |
| RHOB | SNV | Missense_Mutation | c.4N>T | p.Ala2Ser | p.A2S | P62745 | protein_coding | tolerated(0.22) | benign(0.045) | TCGA-DD-AADK-01 | Liver | liver hepatocellular carcinoma | Female | >=65 | I/II | Unknown | Unknown | SD | |
| RHOB | SNV | Missense_Mutation | c.323N>T | p.Pro108Leu | p.P108L | P62745 | protein_coding | deleterious(0.02) | probably_damaging(0.969) | TCGA-DD-AAVV-01 | Liver | liver hepatocellular carcinoma | Male | <65 | I/II | Unknown | Unknown | SD |
| Page: 1 2 |
Top |
Related drugs of malignant transformation related genes |
| Identification of chemicals and drugs interact with genes involved in malignant transfromation |
| (DGIdb 4.0) |
| Entrez ID | Symbol | Category | Interaction Types | Drug Claim Name | Drug Name | PMIDs |
| 388 | RHOB | NA | TRIMETHYL-[3-(TETRADECANE-1-SULFONYLAMINO)-PROPYL]-AMMONIUM IODIDE | TRIMETHYL-[3-(TETRADECANE-1-SULFONYLAMINO)-PROPYL]-AMMONIUM IODIDE | 24095759 | |
| 388 | RHOB | NA | NSC-126188 | CHEMBL1797159 | 24095759,21543141,23266181 |
| Page: 1 |

Copyright 2023-Present -The University of Texas Health Science Center at Houston |