
|
|||||
|
 | |
| |
| |
| |
| |
| |
|
Gene: RHEB |
Gene summary for RHEB |
| Gene information | Species | Human | Gene symbol | RHEB | Gene ID | 6009 |
| Gene name | Ras homolog, mTORC1 binding | |
| Gene Alias | RHEB2 | |
| Cytomap | 7q36.1 | |
| Gene Type | protein-coding | GO ID | GO:0001659 | UniProtAcc | A0A090N900 |
Top |
Malignant transformation analysis |
| Identification of the aberrant gene expression in precancerous and cancerous lesions by comparing the gene expression of stem-like cells in diseased tissues with normal stem cells |
| Entrez ID | Symbol | Replicates | Species | Organ | Tissue | Adj P-value | Log2FC | Malignancy |
| 6009 | RHEB | GSM4909282 | Human | Breast | IDC | 1.38e-74 | 8.26e-01 | -0.0288 |
| 6009 | RHEB | GSM4909285 | Human | Breast | IDC | 6.21e-03 | 2.52e-01 | 0.21 |
| 6009 | RHEB | GSM4909288 | Human | Breast | IDC | 2.41e-04 | -3.13e-01 | 0.0988 |
| 6009 | RHEB | GSM4909293 | Human | Breast | IDC | 2.31e-02 | -2.68e-01 | 0.1581 |
| 6009 | RHEB | GSM4909294 | Human | Breast | IDC | 2.20e-05 | -2.67e-01 | 0.2022 |
| 6009 | RHEB | GSM4909296 | Human | Breast | IDC | 1.34e-18 | -4.14e-01 | 0.1524 |
| 6009 | RHEB | GSM4909297 | Human | Breast | IDC | 1.47e-25 | -5.06e-01 | 0.1517 |
| 6009 | RHEB | GSM4909301 | Human | Breast | IDC | 1.53e-18 | -5.84e-01 | 0.1577 |
| 6009 | RHEB | GSM4909304 | Human | Breast | IDC | 7.42e-04 | -3.31e-01 | 0.1636 |
| 6009 | RHEB | GSM4909309 | Human | Breast | IDC | 1.47e-05 | -2.16e-01 | 0.0483 |
| 6009 | RHEB | GSM4909311 | Human | Breast | IDC | 6.42e-48 | -6.81e-01 | 0.1534 |
| 6009 | RHEB | GSM4909312 | Human | Breast | IDC | 3.49e-17 | -3.44e-01 | 0.1552 |
| 6009 | RHEB | GSM4909313 | Human | Breast | IDC | 3.12e-09 | -3.07e-01 | 0.0391 |
| 6009 | RHEB | GSM4909317 | Human | Breast | IDC | 4.01e-03 | -2.82e-01 | 0.1355 |
| 6009 | RHEB | GSM4909319 | Human | Breast | IDC | 8.28e-50 | -4.67e-01 | 0.1563 |
| 6009 | RHEB | GSM4909320 | Human | Breast | IDC | 1.37e-09 | -5.39e-01 | 0.1575 |
| 6009 | RHEB | GSM4909321 | Human | Breast | IDC | 7.64e-28 | -5.19e-01 | 0.1559 |
| 6009 | RHEB | brca1 | Human | Breast | Precancer | 4.60e-12 | 4.07e-01 | -0.0338 |
| 6009 | RHEB | brca2 | Human | Breast | Precancer | 4.42e-03 | 1.88e-01 | -0.024 |
| 6009 | RHEB | brca3 | Human | Breast | Precancer | 1.63e-07 | 3.05e-01 | -0.0263 |
| Page: 1 2 3 4 5 6 7 8 9 10 11 12 13 |
| Tissue | Expression Dynamics | Abbreviation |
| Breast | 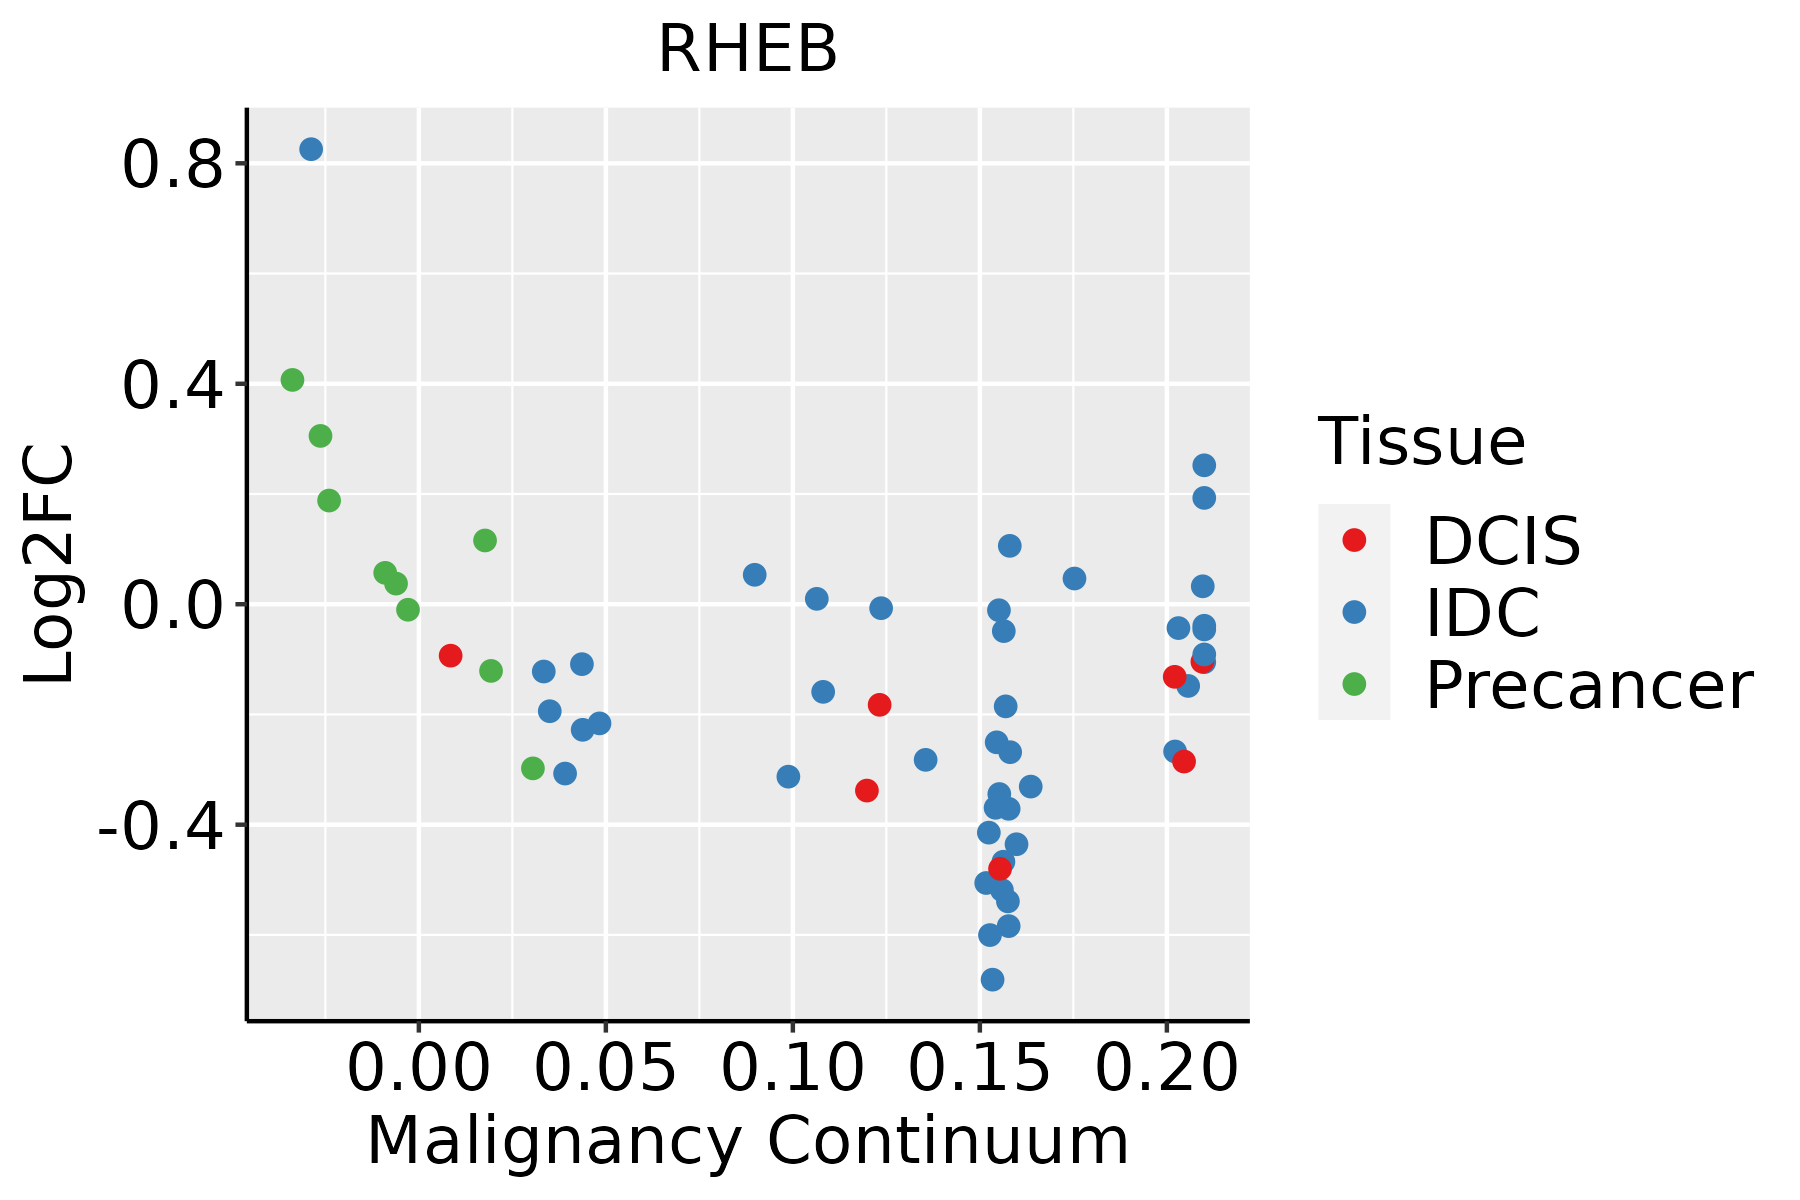 | IDC: Invasive ductal carcinoma |
| DCIS: Ductal carcinoma in situ | ||
| Precancer(BRCA1-mut): Precancerous lesion from BRCA1 mutation carriers | ||
| Colorectum (GSE201348) |  | FAP: Familial adenomatous polyposis |
| CRC: Colorectal cancer | ||
| Colorectum (HTA11) |  | AD: Adenomas |
| SER: Sessile serrated lesions | ||
| MSI-H: Microsatellite-high colorectal cancer | ||
| MSS: Microsatellite stable colorectal cancer | ||
| Endometrium |  | AEH: Atypical endometrial hyperplasia |
| EEC: Endometrioid Cancer | ||
| Esophagus | 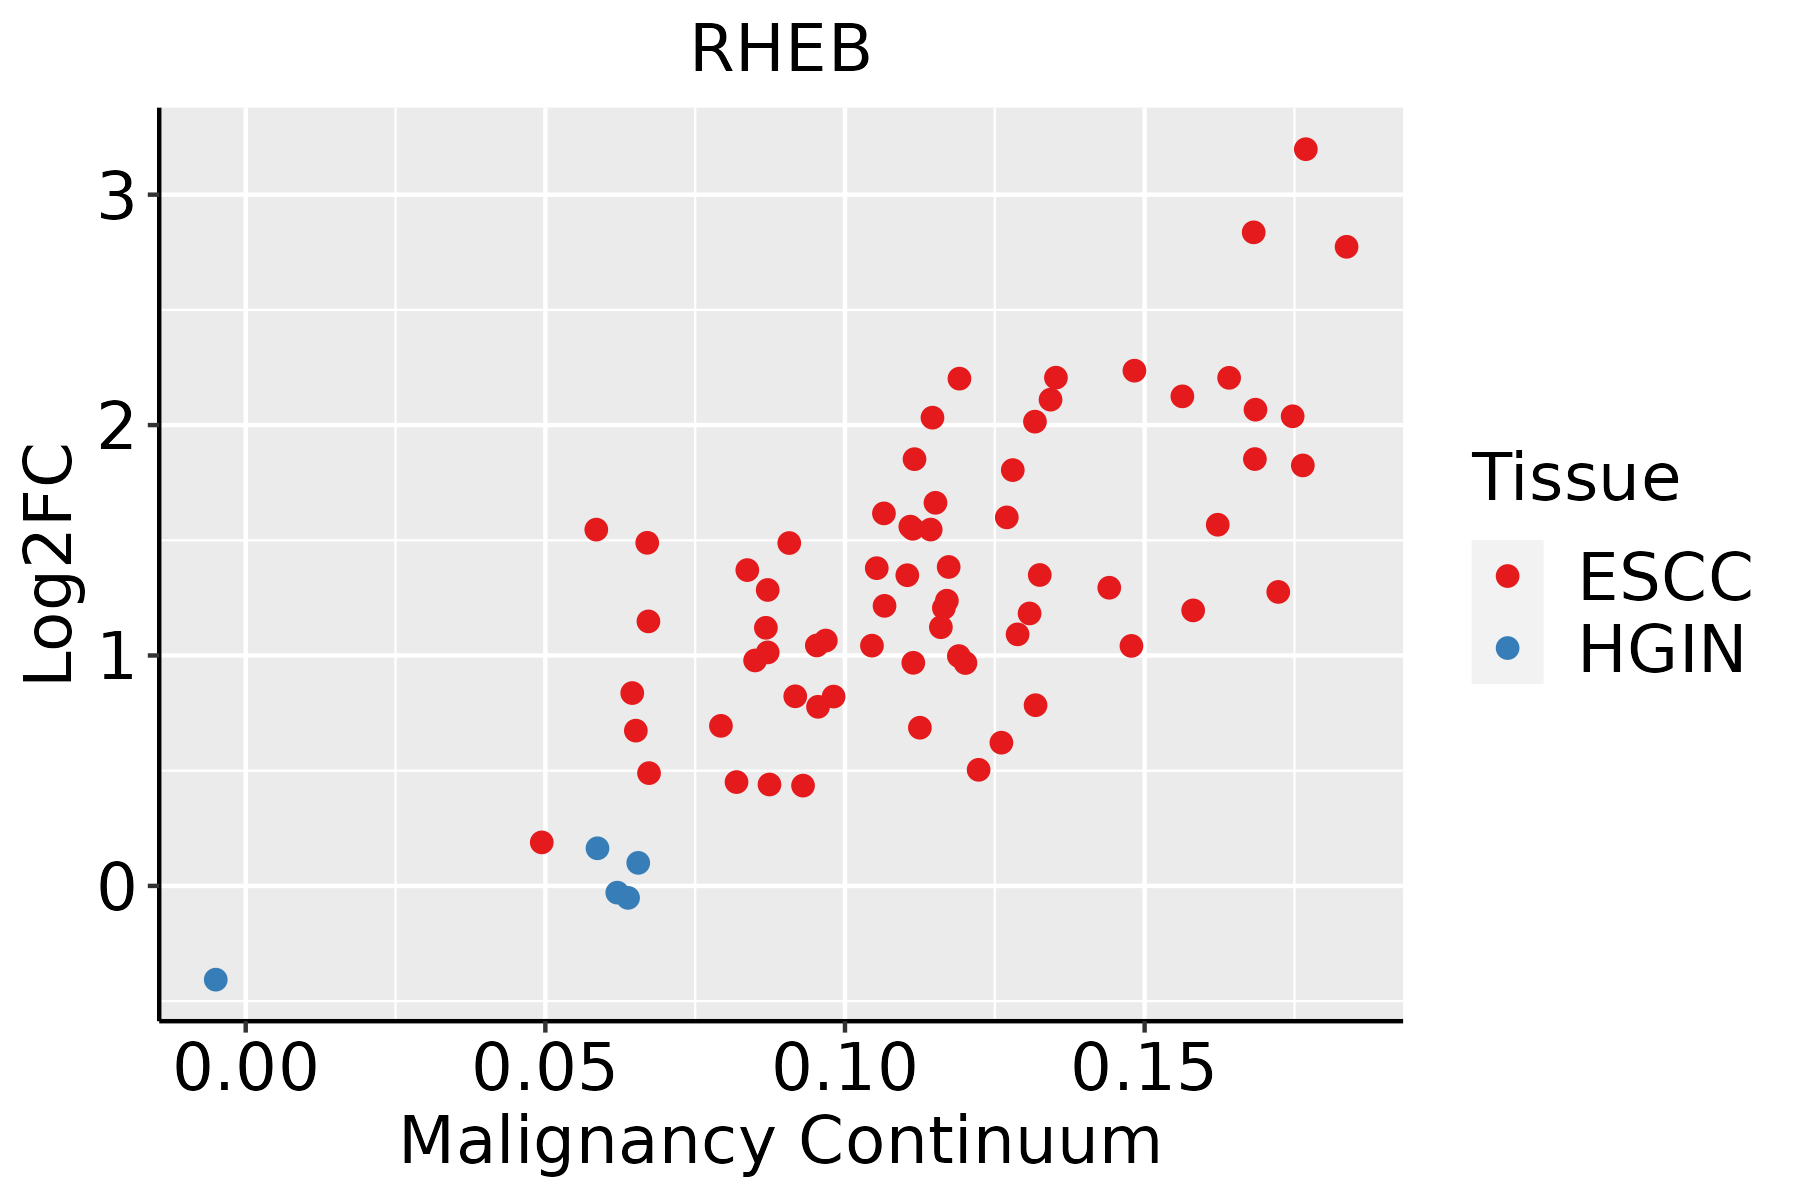 | ESCC: Esophageal squamous cell carcinoma |
| HGIN: High-grade intraepithelial neoplasias | ||
| LGIN: Low-grade intraepithelial neoplasias | ||
| Liver |  | HCC: Hepatocellular carcinoma |
| NAFLD: Non-alcoholic fatty liver disease | ||
| Lung | 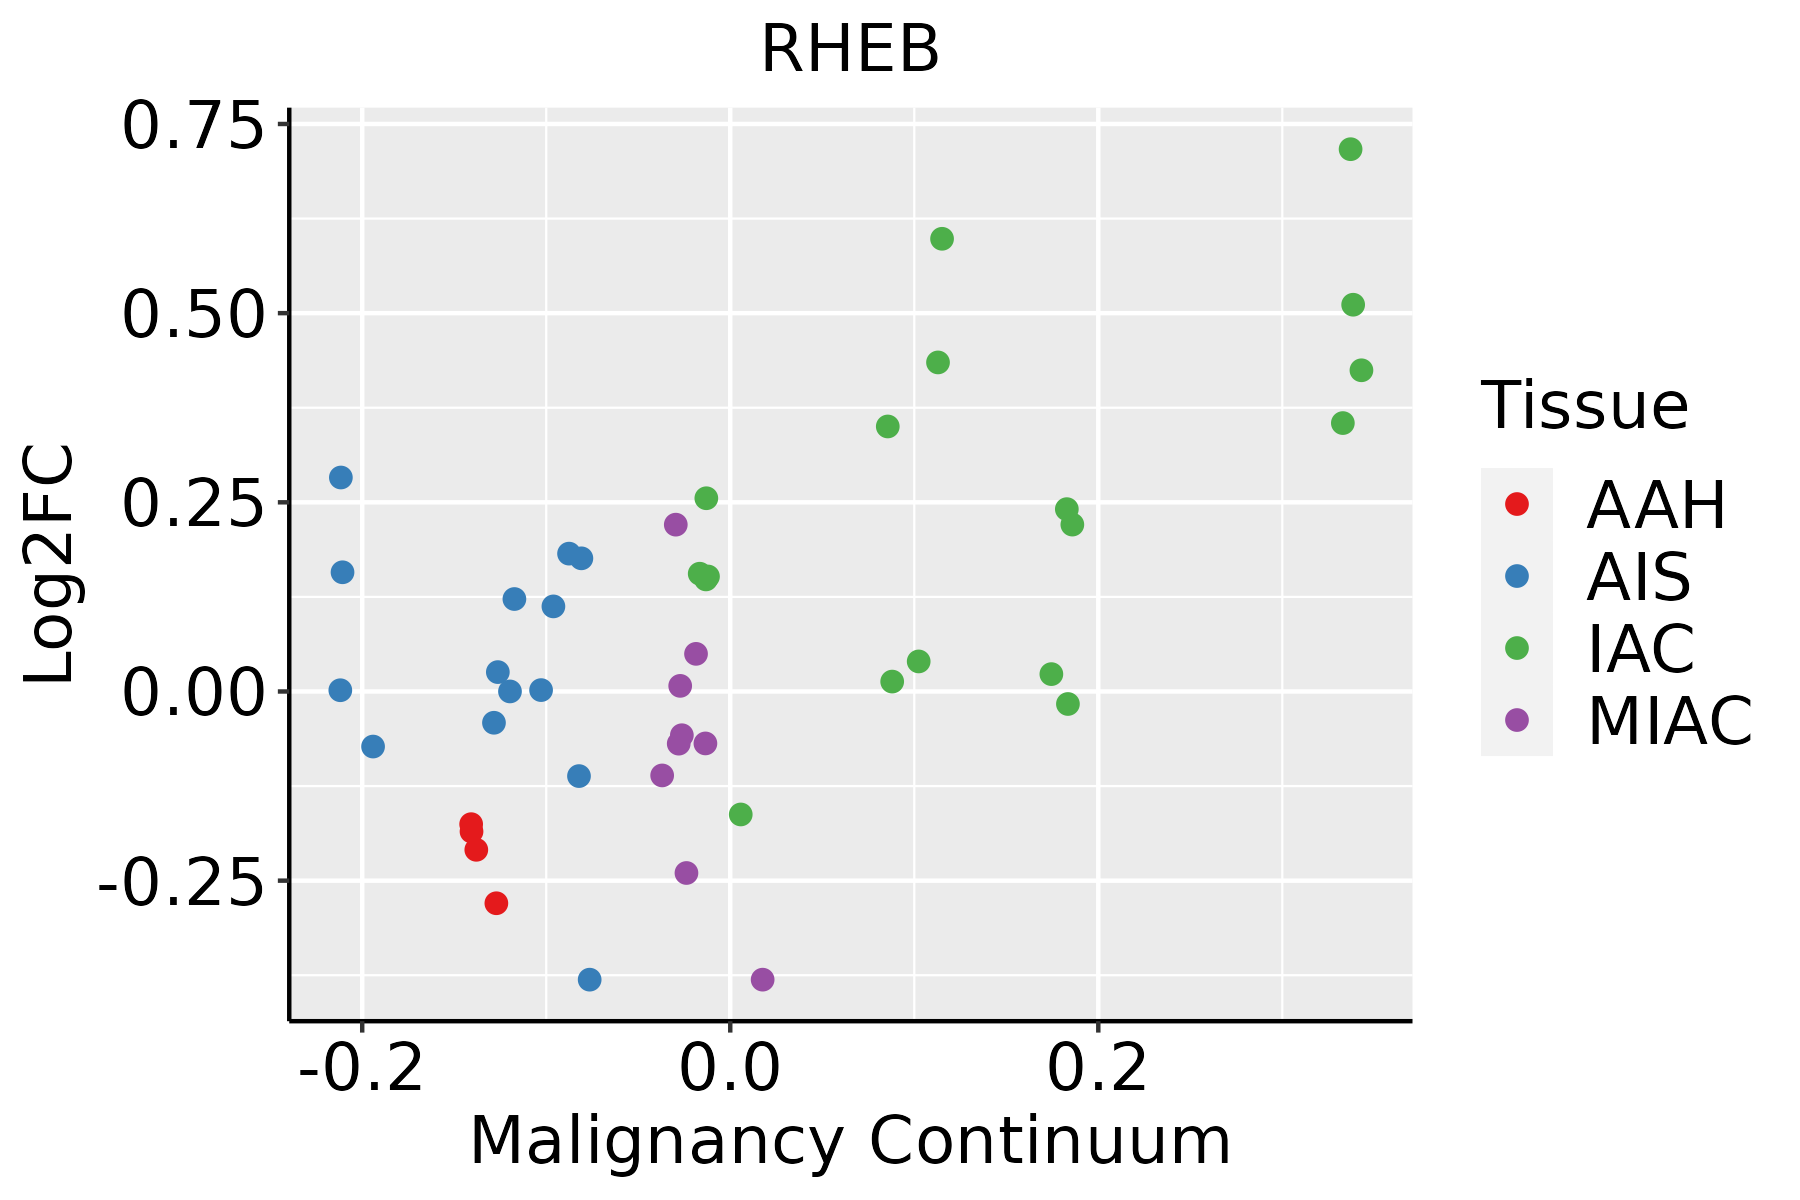 | AAH: Atypical adenomatous hyperplasia |
| AIS: Adenocarcinoma in situ | ||
| IAC: Invasive lung adenocarcinoma | ||
| MIA: Minimally invasive adenocarcinoma | ||
| Oral Cavity | 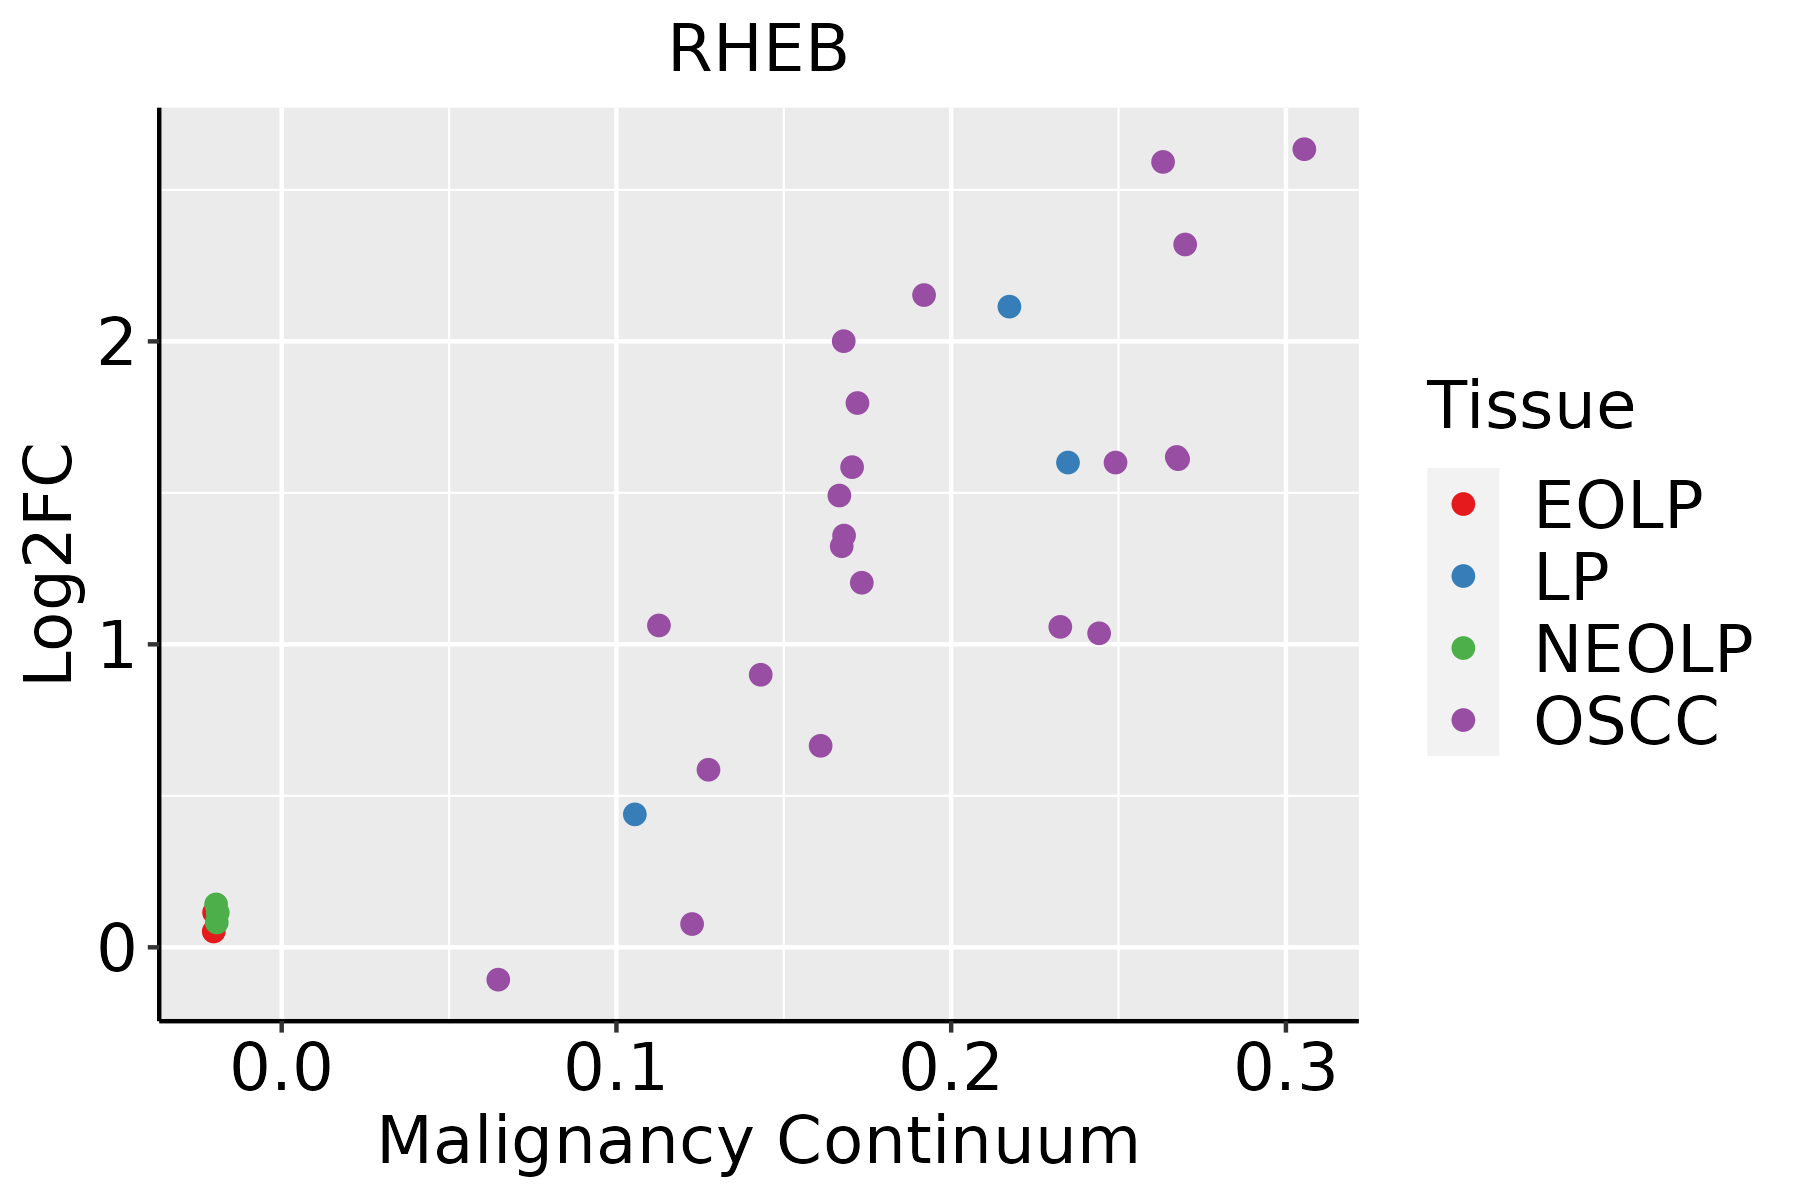 | EOLP: Erosive Oral lichen planus |
| LP: leukoplakia | ||
| NEOLP: Non-erosive oral lichen planus | ||
| OSCC: Oral squamous cell carcinoma | ||
| Prostate | 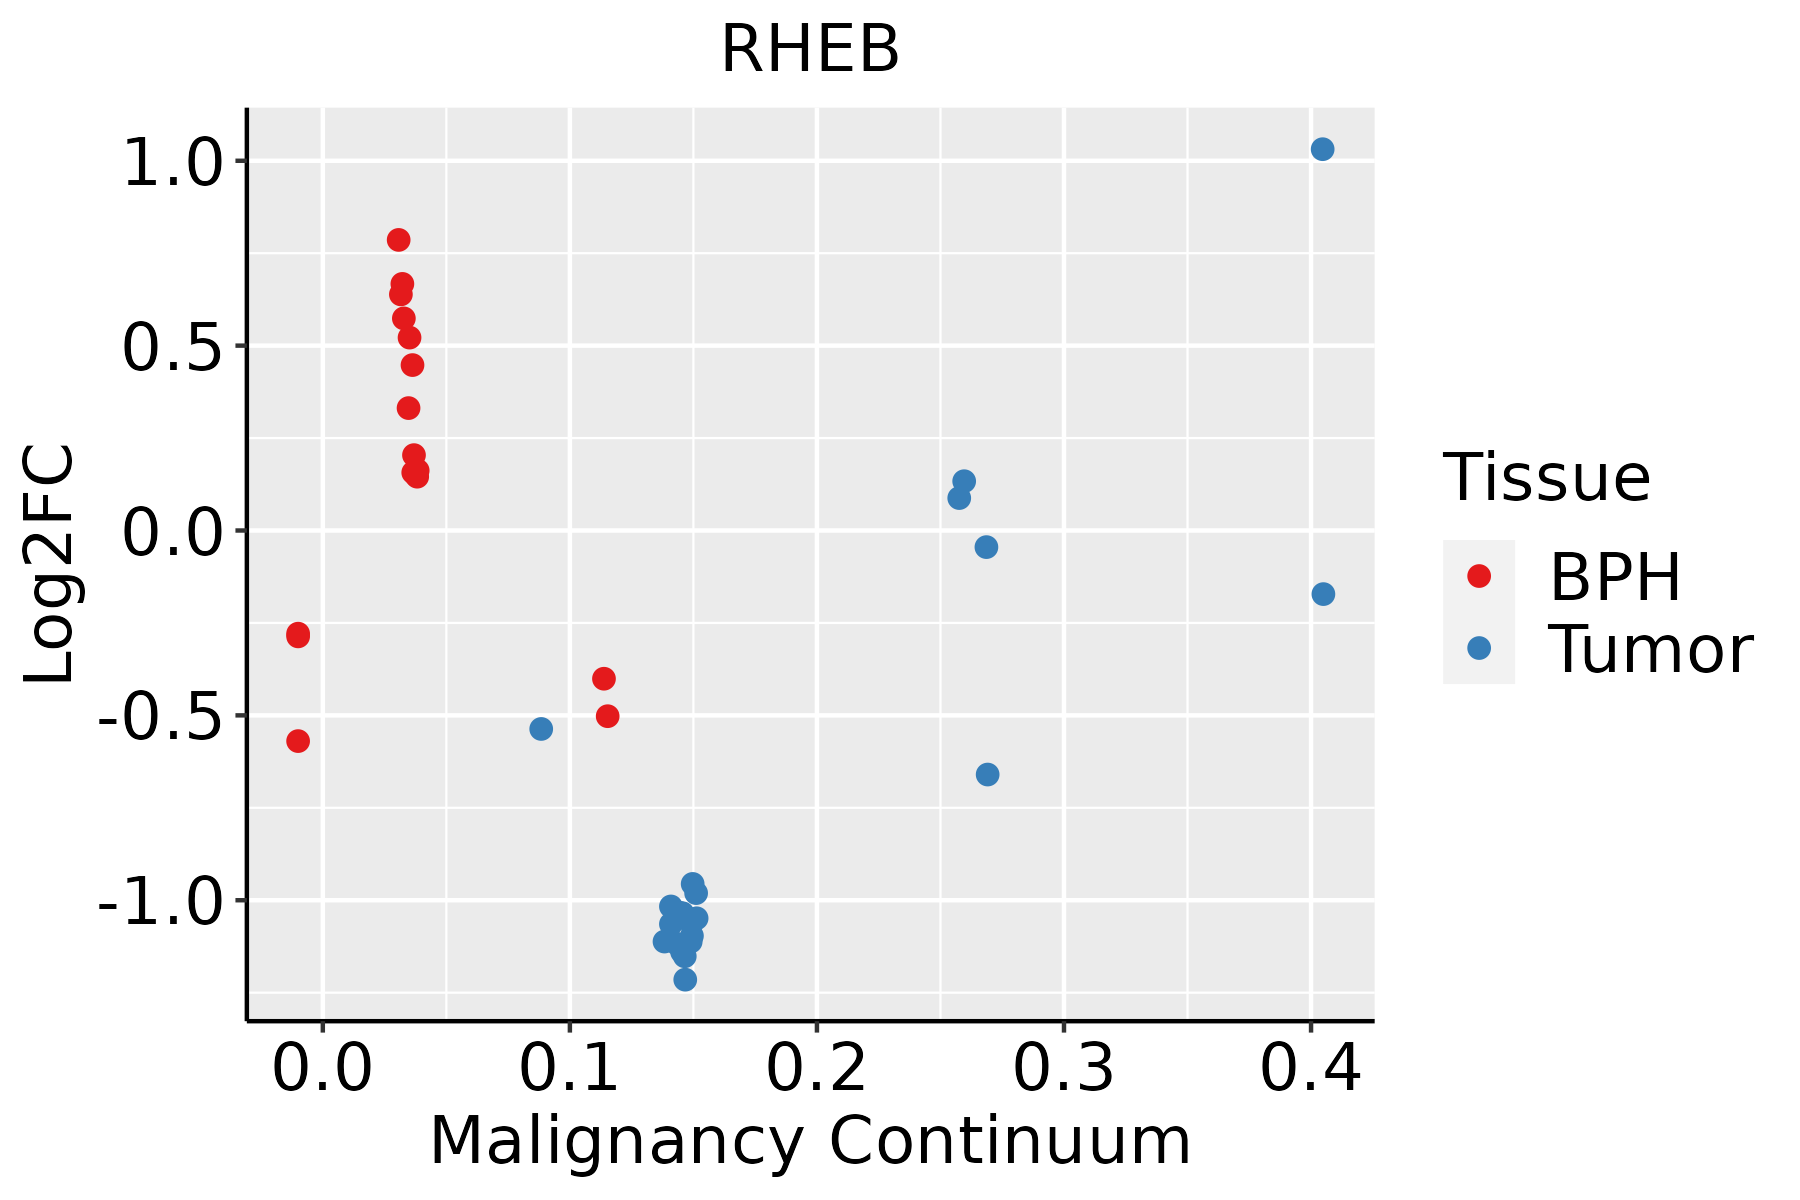 | BPH: Benign Prostatic Hyperplasia |
| Skin | 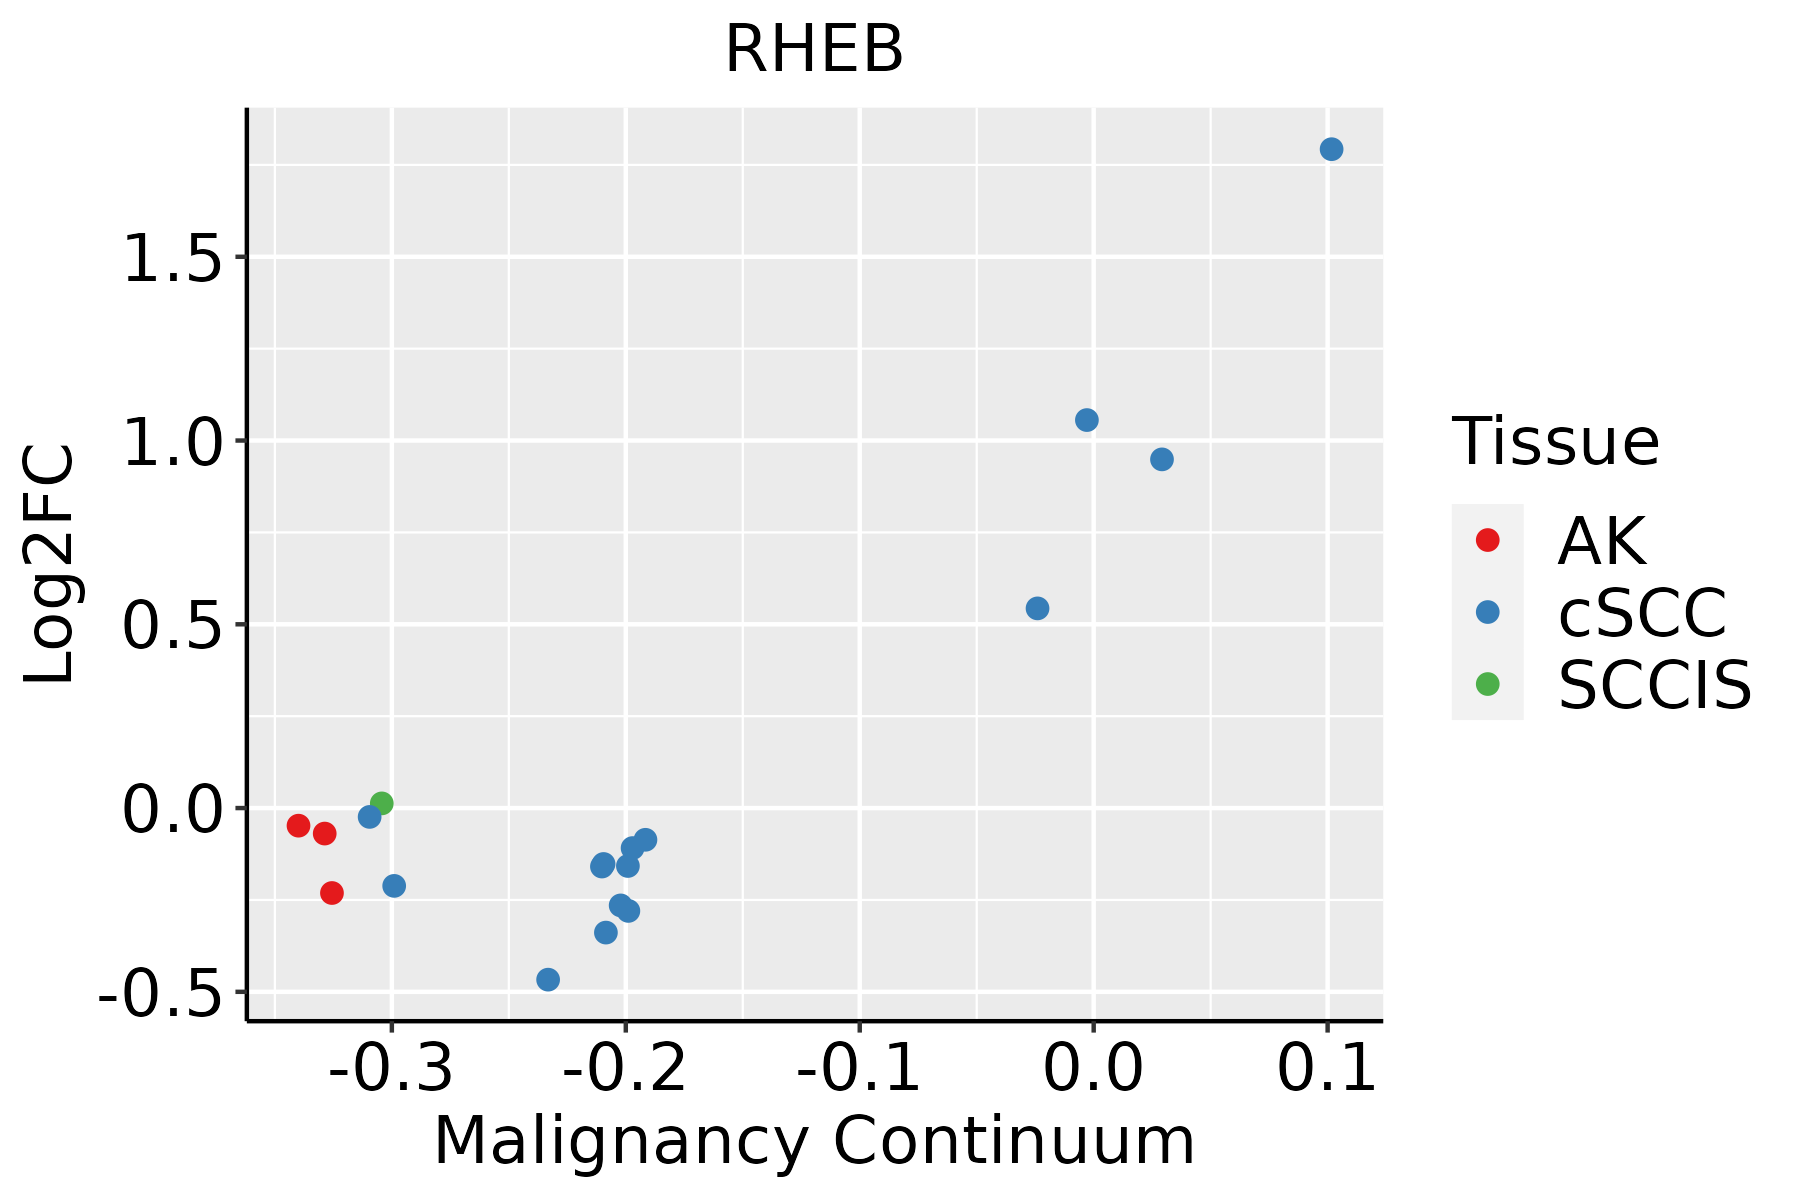 | AK: Actinic keratosis |
| cSCC: Cutaneous squamous cell carcinoma | ||
| SCCIS:squamous cell carcinoma in situ | ||
| Thyroid | 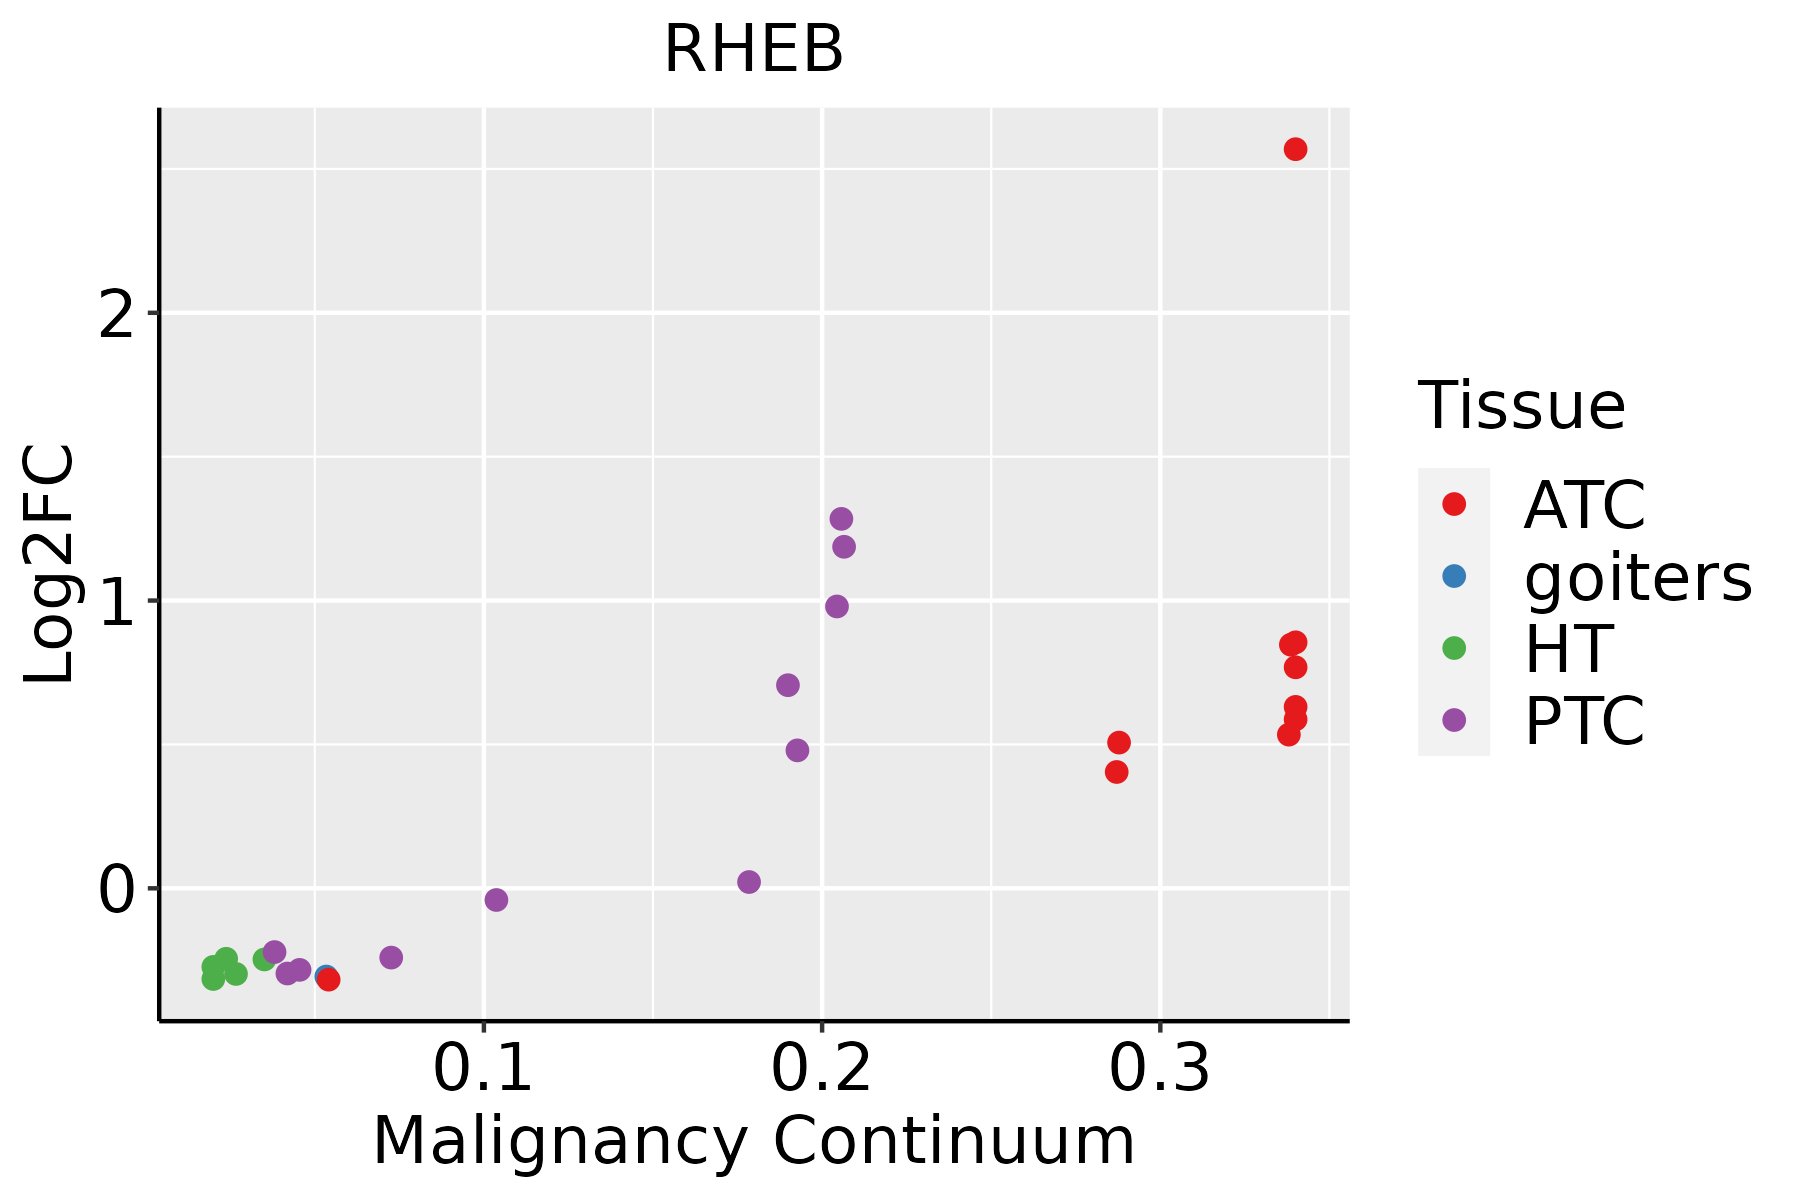 | ATC: Anaplastic thyroid cancer |
| HT: Hashimoto's thyroiditis | ||
| PTC: Papillary thyroid cancer |
| ∗log2FC in expression of this searched gene in stem-like cells from each diseased tissue sample relative to stem-like cells in normal samples in each tissue plotted against the malignancy continuum. Samples are colored based on if they are from different disease stage. |
Top |
Malignant transformation related pathway analysis |
| Find out the enriched GO biological processes and KEGG pathways involved in transition from healthy to precancer to cancer |
| Tissue | Disease Stage | Enriched GO biological Processes |
| Colorectum | AD |  |
| Colorectum | SER |  |
| Colorectum | MSS |  |
| Colorectum | MSI-H |  |
| Colorectum | FAP |  |
| ∗Top 15 enriched GO BP terms are showed in the bar plot of each disease state in each tissue. Each row represents a significant GO biological process which is colored according to the -log10(p.adjust). |
| Page: 1 2 3 4 5 6 7 8 9 |
| GO ID | Tissue | Disease Stage | Description | Gene Ratio | Bg Ratio | pvalue | p.adjust | Count |
| GO:00420633 | Breast | Precancer | gliogenesis | 33/1080 | 301/18723 | 3.06e-04 | 4.40e-03 | 33 |
| GO:00100013 | Breast | Precancer | glial cell differentiation | 25/1080 | 225/18723 | 1.29e-03 | 1.37e-02 | 25 |
| GO:00020649 | Breast | Precancer | epithelial cell development | 23/1080 | 220/18723 | 4.28e-03 | 3.35e-02 | 23 |
| GO:004206311 | Breast | IDC | gliogenesis | 39/1434 | 301/18723 | 8.63e-04 | 1.00e-02 | 39 |
| GO:00100011 | Breast | IDC | glial cell differentiation | 31/1434 | 225/18723 | 1.04e-03 | 1.15e-02 | 31 |
| GO:000206414 | Breast | IDC | epithelial cell development | 28/1434 | 220/18723 | 5.53e-03 | 4.05e-02 | 28 |
| GO:00420632 | Breast | DCIS | gliogenesis | 39/1390 | 301/18723 | 4.76e-04 | 6.25e-03 | 39 |
| GO:00100012 | Breast | DCIS | glial cell differentiation | 31/1390 | 225/18723 | 6.24e-04 | 7.87e-03 | 31 |
| GO:00020642 | Colorectum | MSS | epithelial cell development | 81/3467 | 220/18723 | 1.02e-10 | 1.06e-08 | 81 |
| GO:00162362 | Colorectum | MSS | macroautophagy | 93/3467 | 291/18723 | 2.08e-08 | 1.17e-06 | 93 |
| GO:00105062 | Colorectum | MSS | regulation of autophagy | 95/3467 | 317/18723 | 4.36e-07 | 1.71e-05 | 95 |
| GO:00107202 | Colorectum | MSS | positive regulation of cell development | 81/3467 | 298/18723 | 1.38e-04 | 2.06e-03 | 81 |
| GO:00162412 | Colorectum | MSS | regulation of macroautophagy | 44/3467 | 141/18723 | 1.88e-04 | 2.64e-03 | 44 |
| GO:00507671 | Colorectum | MSS | regulation of neurogenesis | 94/3467 | 364/18723 | 3.12e-04 | 4.06e-03 | 94 |
| GO:0050769 | Colorectum | MSS | positive regulation of neurogenesis | 57/3467 | 225/18723 | 6.60e-03 | 4.38e-02 | 57 |
| GO:0051960 | Colorectum | MSS | regulation of nervous system development | 103/3467 | 443/18723 | 6.68e-03 | 4.38e-02 | 103 |
| GO:0031929 | Colorectum | MSS | TOR signaling | 35/3467 | 126/18723 | 6.91e-03 | 4.44e-02 | 35 |
| GO:00020644 | Colorectum | FAP | epithelial cell development | 62/2622 | 220/18723 | 2.74e-08 | 2.54e-06 | 62 |
| GO:00105063 | Colorectum | FAP | regulation of autophagy | 80/2622 | 317/18723 | 6.43e-08 | 4.54e-06 | 80 |
| GO:00107203 | Colorectum | FAP | positive regulation of cell development | 72/2622 | 298/18723 | 1.67e-06 | 6.99e-05 | 72 |
| Page: 1 2 3 4 5 6 7 8 9 10 11 12 |
| Pathway ID | Tissue | Disease Stage | Description | Gene Ratio | Bg Ratio | pvalue | p.adjust | qvalue | Count |
| hsa0471418 | Breast | Precancer | Thermogenesis | 68/684 | 232/8465 | 4.40e-22 | 1.26e-20 | 9.69e-21 | 68 |
| hsa042189 | Breast | Precancer | Cellular senescence | 29/684 | 156/8465 | 1.66e-05 | 1.69e-04 | 1.30e-04 | 29 |
| hsa0516316 | Breast | Precancer | Human cytomegalovirus infection | 32/684 | 225/8465 | 1.13e-03 | 7.57e-03 | 5.80e-03 | 32 |
| hsa0471419 | Breast | Precancer | Thermogenesis | 68/684 | 232/8465 | 4.40e-22 | 1.26e-20 | 9.69e-21 | 68 |
| hsa0421814 | Breast | Precancer | Cellular senescence | 29/684 | 156/8465 | 1.66e-05 | 1.69e-04 | 1.30e-04 | 29 |
| hsa0516317 | Breast | Precancer | Human cytomegalovirus infection | 32/684 | 225/8465 | 1.13e-03 | 7.57e-03 | 5.80e-03 | 32 |
| hsa0471424 | Breast | IDC | Thermogenesis | 75/867 | 232/8465 | 8.41e-21 | 3.04e-19 | 2.27e-19 | 75 |
| hsa0421824 | Breast | IDC | Cellular senescence | 35/867 | 156/8465 | 5.49e-06 | 7.43e-05 | 5.56e-05 | 35 |
| hsa0516324 | Breast | IDC | Human cytomegalovirus infection | 39/867 | 225/8465 | 6.66e-04 | 5.41e-03 | 4.05e-03 | 39 |
| hsa0491916 | Breast | IDC | Thyroid hormone signaling pathway | 23/867 | 121/8465 | 2.45e-03 | 1.69e-02 | 1.27e-02 | 23 |
| hsa0471434 | Breast | IDC | Thermogenesis | 75/867 | 232/8465 | 8.41e-21 | 3.04e-19 | 2.27e-19 | 75 |
| hsa0421834 | Breast | IDC | Cellular senescence | 35/867 | 156/8465 | 5.49e-06 | 7.43e-05 | 5.56e-05 | 35 |
| hsa0516334 | Breast | IDC | Human cytomegalovirus infection | 39/867 | 225/8465 | 6.66e-04 | 5.41e-03 | 4.05e-03 | 39 |
| hsa0491917 | Breast | IDC | Thyroid hormone signaling pathway | 23/867 | 121/8465 | 2.45e-03 | 1.69e-02 | 1.27e-02 | 23 |
| hsa0471443 | Breast | DCIS | Thermogenesis | 74/846 | 232/8465 | 8.72e-21 | 3.13e-19 | 2.30e-19 | 74 |
| hsa0421844 | Breast | DCIS | Cellular senescence | 34/846 | 156/8465 | 8.53e-06 | 1.06e-04 | 7.80e-05 | 34 |
| hsa0516344 | Breast | DCIS | Human cytomegalovirus infection | 38/846 | 225/8465 | 8.11e-04 | 5.95e-03 | 4.38e-03 | 38 |
| hsa0491922 | Breast | DCIS | Thyroid hormone signaling pathway | 23/846 | 121/8465 | 1.78e-03 | 1.22e-02 | 9.00e-03 | 23 |
| hsa0471453 | Breast | DCIS | Thermogenesis | 74/846 | 232/8465 | 8.72e-21 | 3.13e-19 | 2.30e-19 | 74 |
| hsa0421854 | Breast | DCIS | Cellular senescence | 34/846 | 156/8465 | 8.53e-06 | 1.06e-04 | 7.80e-05 | 34 |
| Page: 1 2 3 4 5 6 7 8 9 10 11 12 13 14 15 |
Top |
Cell-cell communication analysis |
| Identification of potential cell-cell interactions between two cell types and their ligand-receptor pairs for different disease states |
| Ligand | Receptor | LRpair | Pathway | Tissue | Disease Stage |
| Page: 1 |
Top |
Single-cell gene regulatory network inference analysis |
| Find out the significant the regulons (TFs) and the target genes of each regulon across cell types for different disease states |
| TF | Cell Type | Tissue | Disease Stage | Target Gene | RSS | Regulon Activity |
| ∗The dot plots of a searched regulon are shown for all cell subpopulations in each disease state of each tissue based on the regulon specific score inferred using pySCENIC and by calculating the average expression. |
| Page: 1 |
Top |
Somatic mutation of malignant transformation related genes |
| Annotation of somatic variants for genes involved in malignant transformation |
| Hugo Symbol | Variant Class | Variant Classification | dbSNP RS | HGVSc | HGVSp | HGVSp Short | SWISSPROT | BIOTYPE | SIFT | PolyPhen | Tumor Sample Barcode | Tissue | Histology | Sex | Age | Stage | Therapy Types | Drugs | Outcome |
| RHEB | SNV | Missense_Mutation | c.85N>A | p.Gly29Ser | p.G29S | Q15382 | protein_coding | tolerated(0.07) | probably_damaging(0.967) | TCGA-A8-A06U-01 | Breast | breast invasive carcinoma | Female | >=65 | I/II | Unknown | Unknown | SD | |
| RHEB | insertion | Nonsense_Mutation | novel | c.100_101insACAAAGCCTAAAATATTTACTGGTACTGTCTGGC | p.Ser34TyrfsTer4 | p.S34Yfs*4 | Q15382 | protein_coding | TCGA-A2-A0D1-01 | Breast | breast invasive carcinoma | Female | >=65 | I/II | Chemotherapy | taxotere | SD | ||
| RHEB | SNV | Missense_Mutation | c.125N>T | p.Thr42Ile | p.T42I | Q15382 | protein_coding | deleterious(0.03) | probably_damaging(0.995) | TCGA-AZ-4315-01 | Colorectum | colon adenocarcinoma | Male | <65 | I/II | Unknown | Unknown | SD | |
| RHEB | SNV | Missense_Mutation | rs867628277 | c.68N>T | p.Thr23Met | p.T23M | Q15382 | protein_coding | deleterious(0) | benign(0.288) | TCGA-CK-4952-01 | Colorectum | colon adenocarcinoma | Female | <65 | III/IV | Unknown | Unknown | SD |
| RHEB | SNV | Missense_Mutation | c.383T>A | p.Val128Glu | p.V128E | Q15382 | protein_coding | tolerated(0.58) | benign(0.026) | TCGA-G5-6641-01 | Colorectum | rectum adenocarcinoma | Male | >=65 | III/IV | Chemotherapy | oxaliplatin | SD | |
| RHEB | SNV | Missense_Mutation | c.125C>A | p.Thr42Asn | p.T42N | Q15382 | protein_coding | deleterious(0.02) | probably_damaging(0.99) | TCGA-AP-A051-01 | Endometrium | uterine corpus endometrioid carcinoma | Female | >=65 | I/II | Unknown | Unknown | SD | |
| RHEB | SNV | Missense_Mutation | c.103N>A | p.Tyr35Asn | p.Y35N | Q15382 | protein_coding | deleterious(0) | probably_damaging(1) | TCGA-B5-A11W-01 | Endometrium | uterine corpus endometrioid carcinoma | Female | <65 | I/II | Unknown | Unknown | SD | |
| RHEB | SNV | Missense_Mutation | novel | c.449C>T | p.Ala150Val | p.A150V | Q15382 | protein_coding | tolerated(0.05) | probably_damaging(1) | TCGA-BG-A222-01 | Endometrium | uterine corpus endometrioid carcinoma | Female | <65 | I/II | Unknown | Unknown | SD |
| RHEB | SNV | Missense_Mutation | c.70N>G | p.Ile24Val | p.I24V | Q15382 | protein_coding | tolerated(0.99) | possibly_damaging(0.65) | TCGA-BS-A0V6-01 | Endometrium | uterine corpus endometrioid carcinoma | Female | <65 | I/II | Unknown | Unknown | SD | |
| RHEB | SNV | Missense_Mutation | novel | c.78N>G | p.Phe26Leu | p.F26L | Q15382 | protein_coding | deleterious(0.02) | possibly_damaging(0.693) | TCGA-E6-A1LX-01 | Endometrium | uterine corpus endometrioid carcinoma | Female | <65 | I/II | Unknown | Unknown | SD |
| Page: 1 2 |
Top |
Related drugs of malignant transformation related genes |
| Identification of chemicals and drugs interact with genes involved in malignant transfromation |
| (DGIdb 4.0) |
| Entrez ID | Symbol | Category | Interaction Types | Drug Claim Name | Drug Name | PMIDs |
| 6009 | RHEB | TUMOR SUPPRESSOR, DRUG RESISTANCE, KINASE, CLINICALLY ACTIONABLE | 4,4'-HYDROXYBIPHENYL | CHEMBL76398 | 24266771 | |
| 6009 | RHEB | TUMOR SUPPRESSOR, DRUG RESISTANCE, KINASE, CLINICALLY ACTIONABLE | SIROLIMUS | SIROLIMUS | 26255626 |
| Page: 1 |

Copyright 2023-Present -The University of Texas Health Science Center at Houston |