
|
|||||
|
 | |
| |
| |
| |
| |
| |
|
Gene: RHCG |
Gene summary for RHCG |
| Gene information | Species | Human | Gene symbol | RHCG | Gene ID | 51458 |
| Gene name | Rh family C glycoprotein | |
| Gene Alias | C15orf6 | |
| Cytomap | 15q26.1 | |
| Gene Type | protein-coding | GO ID | GO:0006810 | UniProtAcc | Q9UBD6 |
Top |
Malignant transformation analysis |
| Identification of the aberrant gene expression in precancerous and cancerous lesions by comparing the gene expression of stem-like cells in diseased tissues with normal stem cells |
| Entrez ID | Symbol | Replicates | Species | Organ | Tissue | Adj P-value | Log2FC | Malignancy |
| 51458 | RHCG | P4T-E | Human | Esophagus | ESCC | 7.03e-05 | 8.57e-01 | 0.1323 |
| 51458 | RHCG | P24T-E | Human | Esophagus | ESCC | 1.73e-09 | 5.19e-01 | 0.1287 |
| 51458 | RHCG | P28T-E | Human | Esophagus | ESCC | 2.80e-03 | 1.29e-01 | 0.1149 |
| 51458 | RHCG | P36T-E | Human | Esophagus | ESCC | 1.78e-03 | 1.08e+00 | 0.1187 |
| 51458 | RHCG | P38T-E | Human | Esophagus | ESCC | 4.90e-12 | 1.27e+00 | 0.127 |
| 51458 | RHCG | P42T-E | Human | Esophagus | ESCC | 9.07e-07 | 1.96e+00 | 0.1175 |
| 51458 | RHCG | P49T-E | Human | Esophagus | ESCC | 4.13e-02 | 2.68e+00 | 0.1768 |
| 51458 | RHCG | P83T-E | Human | Esophagus | ESCC | 2.82e-07 | 9.87e-01 | 0.1738 |
| 51458 | RHCG | P89T-E | Human | Esophagus | ESCC | 8.84e-17 | 2.83e+00 | 0.1752 |
| 51458 | RHCG | C43 | Human | Oral cavity | OSCC | 1.64e-05 | 1.19e+00 | 0.1704 |
| 51458 | RHCG | C46 | Human | Oral cavity | OSCC | 4.17e-03 | -3.86e-01 | 0.1673 |
| 51458 | RHCG | C57 | Human | Oral cavity | OSCC | 1.51e-44 | 3.04e+00 | 0.1679 |
| 51458 | RHCG | EOLP-1 | Human | Oral cavity | EOLP | 8.20e-06 | -4.19e-01 | -0.0202 |
| 51458 | RHCG | EOLP-2 | Human | Oral cavity | EOLP | 4.14e-10 | -4.37e-01 | -0.0203 |
| 51458 | RHCG | NEOLP-1 | Human | Oral cavity | NEOLP | 1.99e-06 | -4.14e-01 | -0.0194 |
| 51458 | RHCG | NEOLP-2 | Human | Oral cavity | NEOLP | 5.00e-04 | -3.92e-01 | -0.0196 |
| 51458 | RHCG | NEOLP-3 | Human | Oral cavity | NEOLP | 2.96e-06 | -3.96e-01 | -0.0191 |
| 51458 | RHCG | SYSMH3 | Human | Oral cavity | OSCC | 6.06e-10 | -1.02e-01 | 0.2442 |
| 51458 | RHCG | SYSMH4 | Human | Oral cavity | OSCC | 1.65e-18 | 4.36e-02 | 0.1226 |
| 51458 | RHCG | SYSMH6 | Human | Oral cavity | OSCC | 1.34e-03 | -3.07e-01 | 0.1275 |
| Page: 1 |
| Tissue | Expression Dynamics | Abbreviation |
| Esophagus | 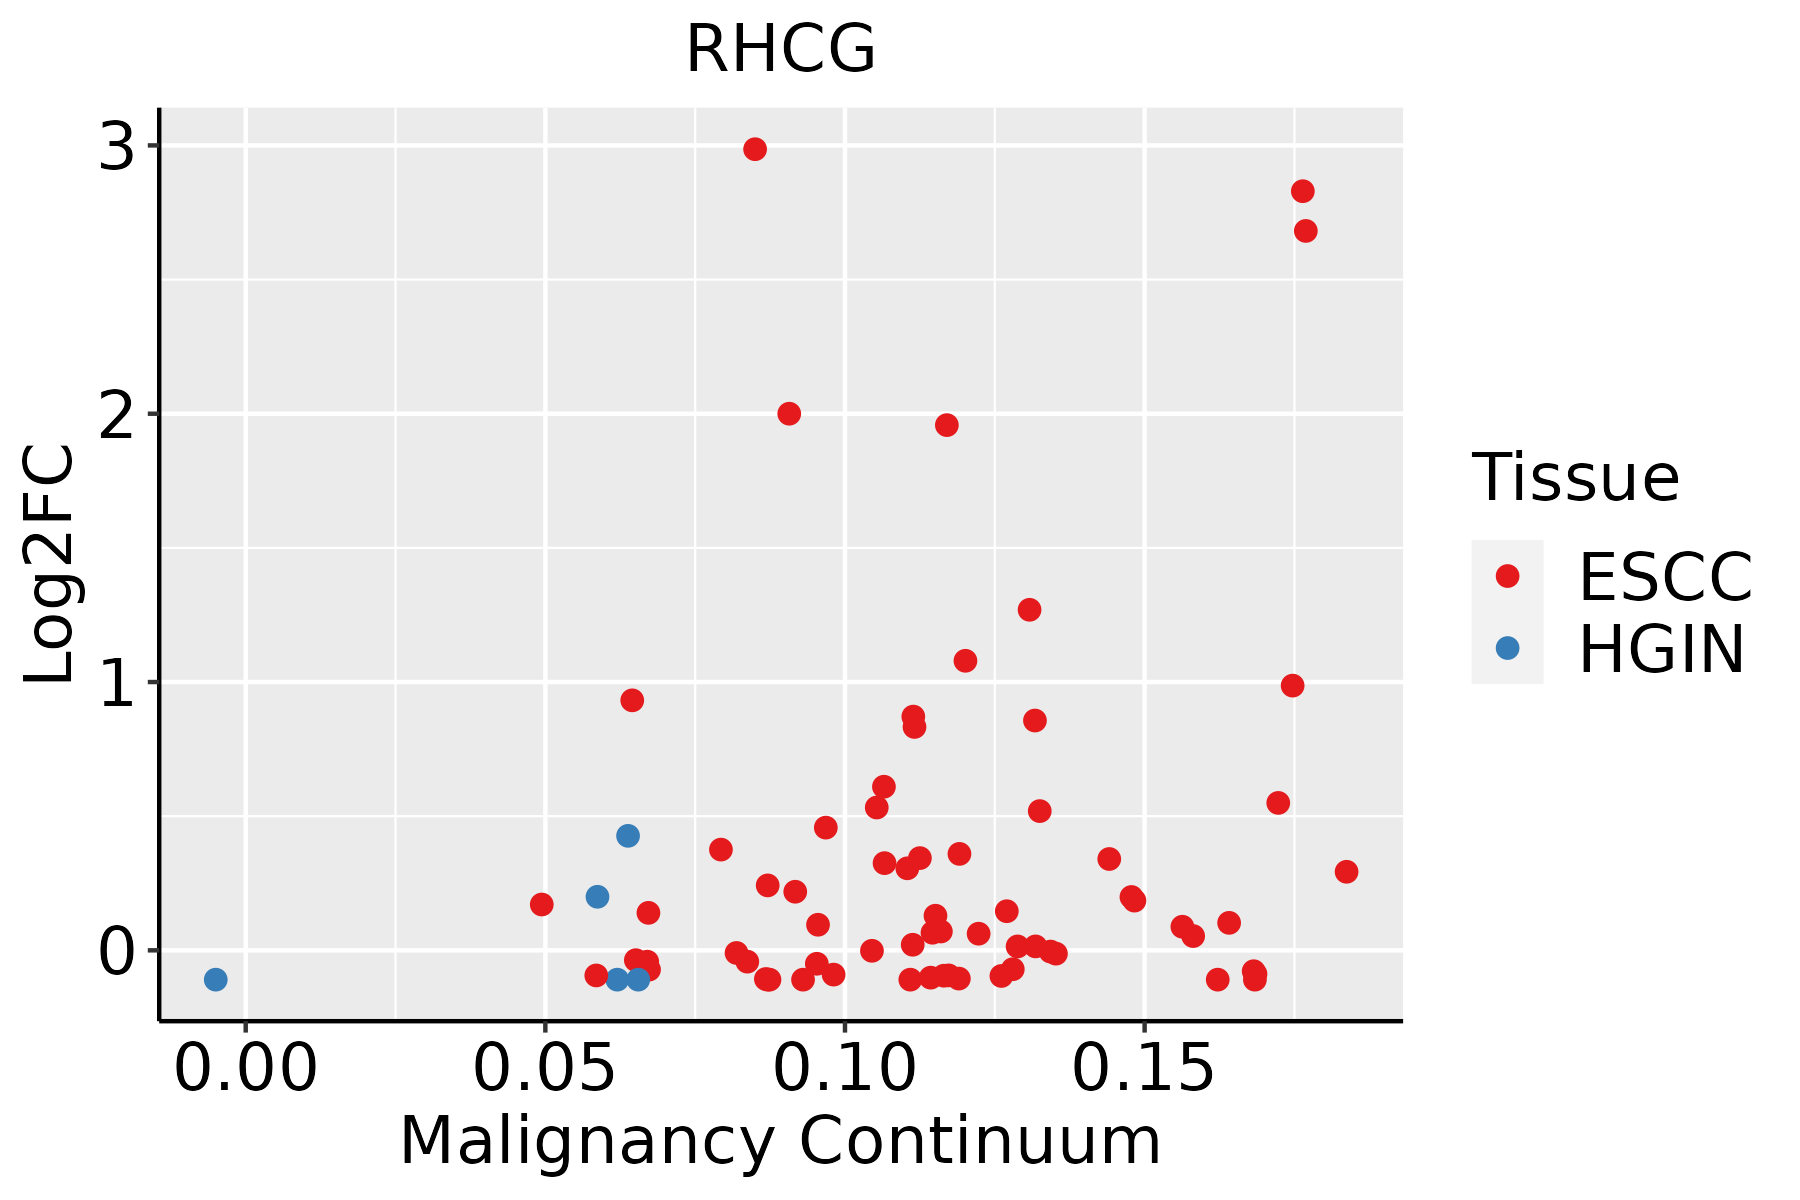 | ESCC: Esophageal squamous cell carcinoma |
| HGIN: High-grade intraepithelial neoplasias | ||
| LGIN: Low-grade intraepithelial neoplasias | ||
| Oral Cavity | 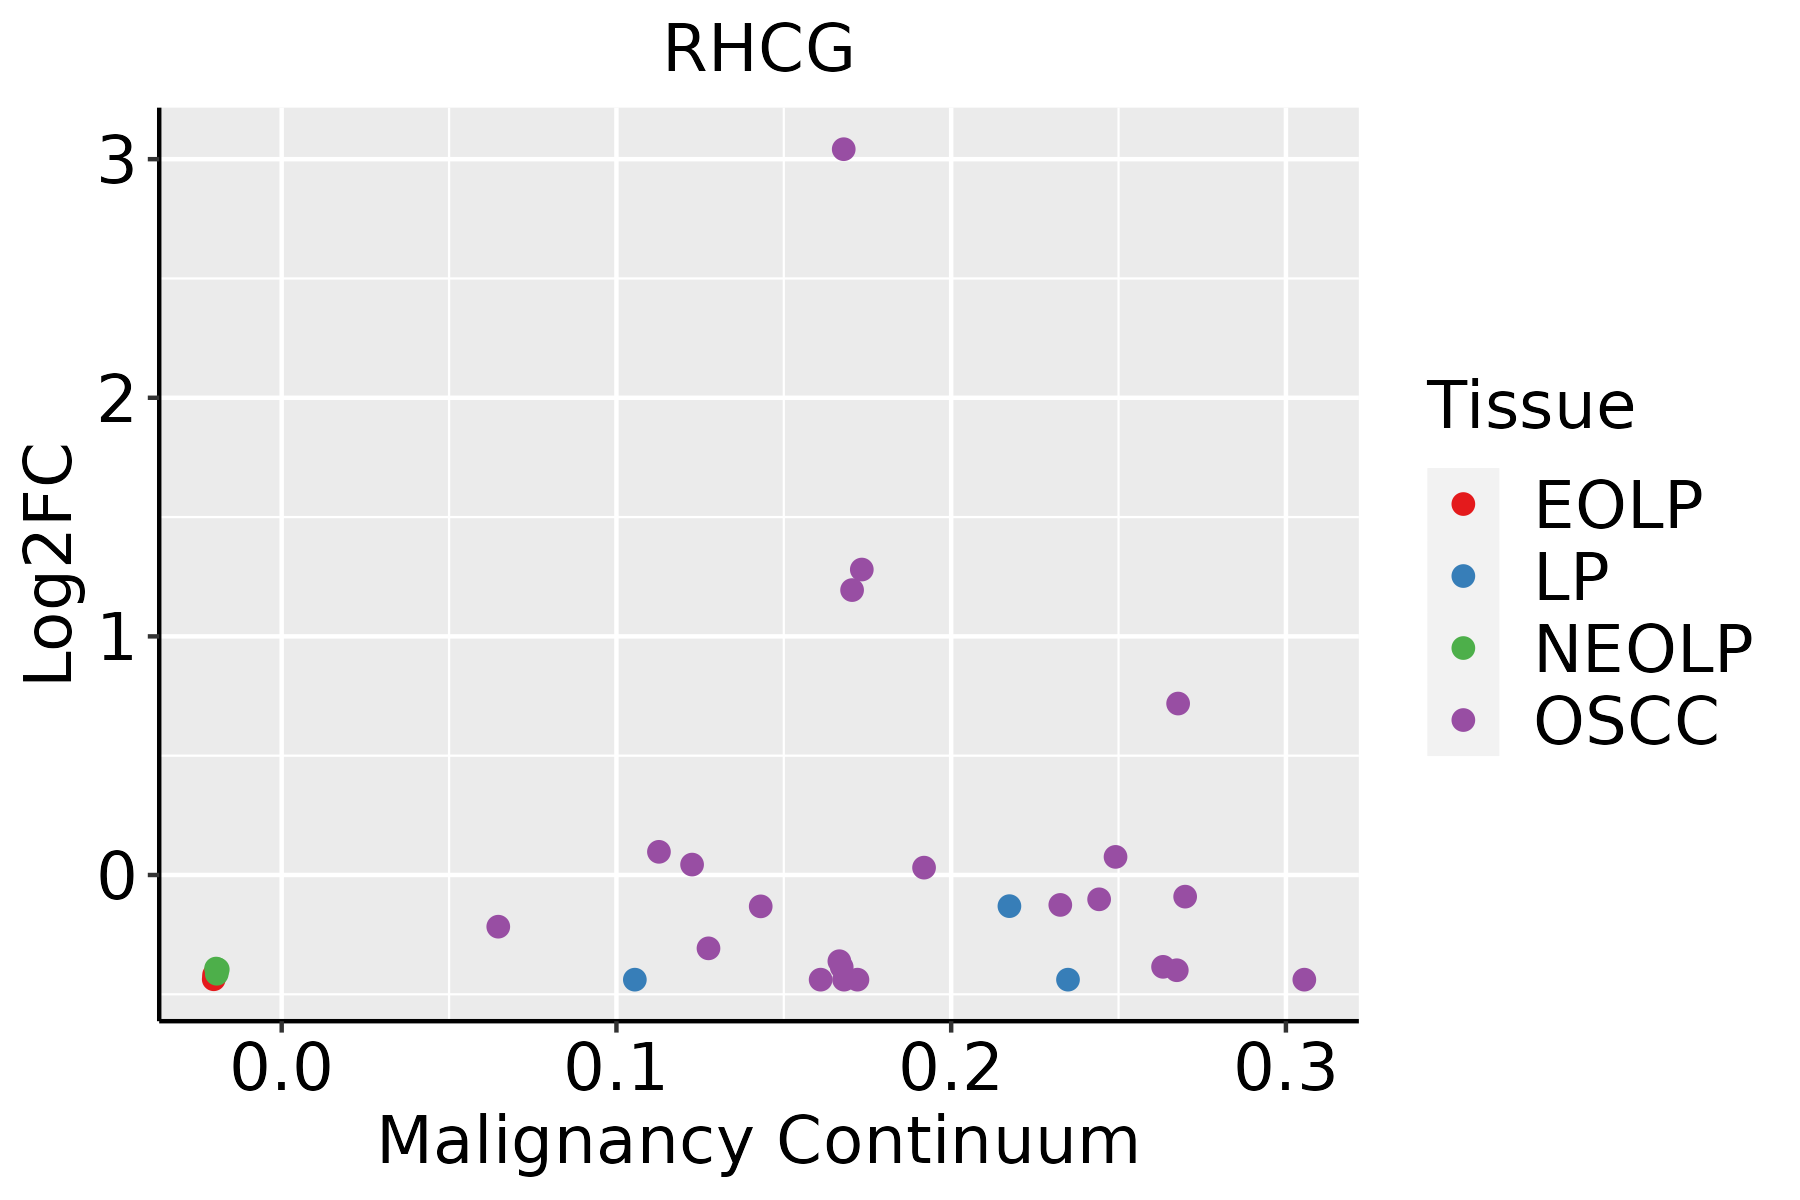 | EOLP: Erosive Oral lichen planus |
| LP: leukoplakia | ||
| NEOLP: Non-erosive oral lichen planus | ||
| OSCC: Oral squamous cell carcinoma |
| ∗log2FC in expression of this searched gene in stem-like cells from each diseased tissue sample relative to stem-like cells in normal samples in each tissue plotted against the malignancy continuum. Samples are colored based on if they are from different disease stage. |
Top |
Malignant transformation related pathway analysis |
| Find out the enriched GO biological processes and KEGG pathways involved in transition from healthy to precancer to cancer |
| Tissue | Disease Stage | Enriched GO biological Processes |
| Colorectum | AD |  |
| Colorectum | SER |  |
| Colorectum | MSS |  |
| Colorectum | MSI-H |  |
| Colorectum | FAP |  |
| ∗Top 15 enriched GO BP terms are showed in the bar plot of each disease state in each tissue. Each row represents a significant GO biological process which is colored according to the -log10(p.adjust). |
| Page: 1 2 3 4 5 6 7 8 9 |
| GO ID | Tissue | Disease Stage | Description | Gene Ratio | Bg Ratio | pvalue | p.adjust | Count |
| Page: 1 |
| Pathway ID | Tissue | Disease Stage | Description | Gene Ratio | Bg Ratio | pvalue | p.adjust | qvalue | Count |
| Page: 1 |
Top |
Cell-cell communication analysis |
| Identification of potential cell-cell interactions between two cell types and their ligand-receptor pairs for different disease states |
| Ligand | Receptor | LRpair | Pathway | Tissue | Disease Stage |
| Page: 1 |
Top |
Single-cell gene regulatory network inference analysis |
| Find out the significant the regulons (TFs) and the target genes of each regulon across cell types for different disease states |
| TF | Cell Type | Tissue | Disease Stage | Target Gene | RSS | Regulon Activity |
| ∗The dot plots of a searched regulon are shown for all cell subpopulations in each disease state of each tissue based on the regulon specific score inferred using pySCENIC and by calculating the average expression. |
| Page: 1 |
Top |
Somatic mutation of malignant transformation related genes |
| Annotation of somatic variants for genes involved in malignant transformation |
| Hugo Symbol | Variant Class | Variant Classification | dbSNP RS | HGVSc | HGVSp | HGVSp Short | SWISSPROT | BIOTYPE | SIFT | PolyPhen | Tumor Sample Barcode | Tissue | Histology | Sex | Age | Stage | Therapy Types | Drugs | Outcome |
| RHCG | SNV | Missense_Mutation | c.1134N>A | p.Phe378Leu | p.F378L | Q9UBD6 | protein_coding | tolerated(0.69) | benign(0.003) | TCGA-BH-A0HK-01 | Breast | breast invasive carcinoma | Female | >=65 | I/II | Hormone Therapy | arimidex | SD | |
| RHCG | SNV | Missense_Mutation | novel | c.662N>T | p.Ala221Val | p.A221V | Q9UBD6 | protein_coding | deleterious(0) | possibly_damaging(0.803) | TCGA-2W-A8YY-01 | Cervix | cervical & endocervical cancer | Female | <65 | I/II | Chemotherapy | cisplatin | CR |
| RHCG | SNV | Missense_Mutation | c.1359C>A | p.Phe453Leu | p.F453L | Q9UBD6 | protein_coding | tolerated(0.93) | benign(0) | TCGA-EK-A2RJ-01 | Cervix | cervical & endocervical cancer | Female | <65 | I/II | Unknown | Unknown | SD | |
| RHCG | SNV | Missense_Mutation | c.1318N>C | p.Glu440Gln | p.E440Q | Q9UBD6 | protein_coding | tolerated(0.08) | benign(0.206) | TCGA-IR-A3LA-01 | Cervix | cervical & endocervical cancer | Female | <65 | I/II | Chemotherapy | cisplatin | CR | |
| RHCG | SNV | Missense_Mutation | c.88G>A | p.Val30Met | p.V30M | Q9UBD6 | protein_coding | deleterious(0.01) | possibly_damaging(0.852) | TCGA-AA-3672-01 | Colorectum | colon adenocarcinoma | Female | >=65 | III/IV | Unknown | Unknown | SD | |
| RHCG | SNV | Missense_Mutation | c.647N>G | p.Gln216Arg | p.Q216R | Q9UBD6 | protein_coding | deleterious(0.03) | benign(0.007) | TCGA-AA-3833-01 | Colorectum | colon adenocarcinoma | Female | <65 | I/II | Unknown | Unknown | SD | |
| RHCG | SNV | Missense_Mutation | rs368487303 | c.1076N>T | p.Ala359Val | p.A359V | Q9UBD6 | protein_coding | tolerated(0.14) | benign(0.2) | TCGA-AA-A01R-01 | Colorectum | colon adenocarcinoma | Male | <65 | III/IV | Chemotherapy | 5-fluorouracil | PD |
| RHCG | SNV | Missense_Mutation | c.100N>G | p.Phe34Val | p.F34V | Q9UBD6 | protein_coding | tolerated(0.58) | benign(0.001) | TCGA-AU-6004-01 | Colorectum | colon adenocarcinoma | Female | >=65 | I/II | Unknown | Unknown | SD | |
| RHCG | SNV | Missense_Mutation | c.88N>A | p.Val30Met | p.V30M | Q9UBD6 | protein_coding | deleterious(0.01) | possibly_damaging(0.852) | TCGA-AZ-6599-01 | Colorectum | colon adenocarcinoma | Male | >=65 | I/II | Unknown | Unknown | SD | |
| RHCG | SNV | Missense_Mutation | novel | c.1362G>T | p.Lys454Asn | p.K454N | Q9UBD6 | protein_coding | deleterious(0.03) | benign(0.425) | TCGA-EI-6917-01 | Colorectum | rectum adenocarcinoma | Male | <65 | III/IV | Chemotherapy | 5fluorouracil+oxaciplatina+l-folinian | SD |
| Page: 1 2 3 4 5 6 |
Top |
Related drugs of malignant transformation related genes |
| Identification of chemicals and drugs interact with genes involved in malignant transfromation |
| (DGIdb 4.0) |
| Entrez ID | Symbol | Category | Interaction Types | Drug Claim Name | Drug Name | PMIDs |
| Page: 1 |

Copyright 2023-Present -The University of Texas Health Science Center at Houston |