
|
|||||
|
 | |
| |
| |
| |
| |
| |
|
Gene: RHBG |
Gene summary for RHBG |
| Gene information | Species | Human | Gene symbol | RHBG | Gene ID | 57127 |
| Gene name | Rh family B glycoprotein | |
| Gene Alias | SLC42A2 | |
| Cytomap | 1q22 | |
| Gene Type | protein-coding | GO ID | GO:0006810 | UniProtAcc | Q9H310 |
Top |
Malignant transformation analysis |
| Identification of the aberrant gene expression in precancerous and cancerous lesions by comparing the gene expression of stem-like cells in diseased tissues with normal stem cells |
| Entrez ID | Symbol | Replicates | Species | Organ | Tissue | Adj P-value | Log2FC | Malignancy |
| 57127 | RHBG | HCC1 | Human | Liver | HCC | 5.67e-25 | 4.73e+00 | 0.5336 |
| 57127 | RHBG | HCC2 | Human | Liver | HCC | 1.55e-07 | 2.78e+00 | 0.5341 |
| 57127 | RHBG | HCC5 | Human | Liver | HCC | 5.27e-03 | 2.42e+00 | 0.4932 |
| 57127 | RHBG | S014 | Human | Liver | HCC | 2.30e-23 | 7.61e-01 | 0.2254 |
| 57127 | RHBG | S015 | Human | Liver | HCC | 4.27e-24 | 8.10e-01 | 0.2375 |
| 57127 | RHBG | S016 | Human | Liver | HCC | 1.43e-35 | 9.30e-01 | 0.2243 |
| Page: 1 |
| Tissue | Expression Dynamics | Abbreviation |
| Liver | 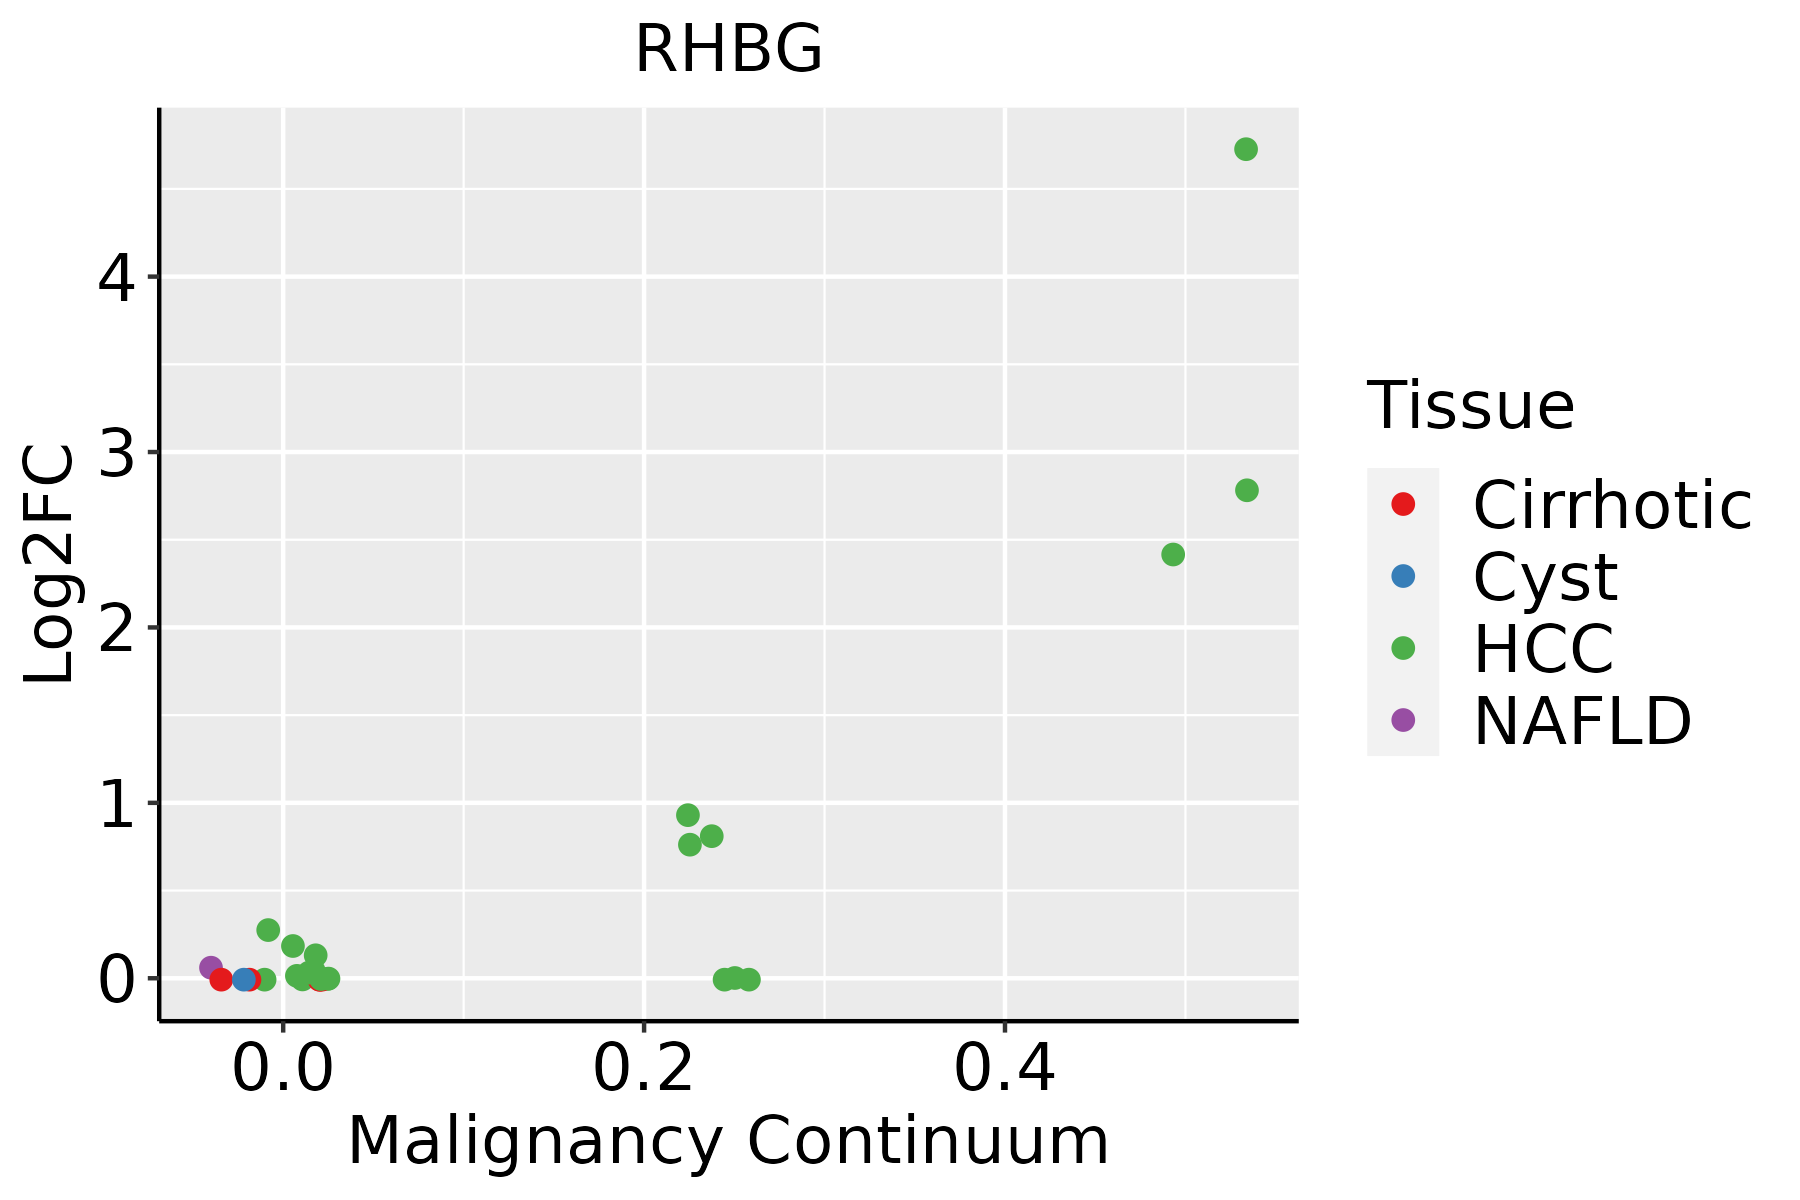 | HCC: Hepatocellular carcinoma |
| NAFLD: Non-alcoholic fatty liver disease |
| ∗log2FC in expression of this searched gene in stem-like cells from each diseased tissue sample relative to stem-like cells in normal samples in each tissue plotted against the malignancy continuum. Samples are colored based on if they are from different disease stage. |
Top |
Malignant transformation related pathway analysis |
| Find out the enriched GO biological processes and KEGG pathways involved in transition from healthy to precancer to cancer |
| Tissue | Disease Stage | Enriched GO biological Processes |
| Colorectum | AD |  |
| Colorectum | SER |  |
| Colorectum | MSS |  |
| Colorectum | MSI-H |  |
| Colorectum | FAP |  |
| ∗Top 15 enriched GO BP terms are showed in the bar plot of each disease state in each tissue. Each row represents a significant GO biological process which is colored according to the -log10(p.adjust). |
| Page: 1 2 3 4 5 6 7 8 9 |
| GO ID | Tissue | Disease Stage | Description | Gene Ratio | Bg Ratio | pvalue | p.adjust | Count |
| Page: 1 |
| Pathway ID | Tissue | Disease Stage | Description | Gene Ratio | Bg Ratio | pvalue | p.adjust | qvalue | Count |
| Page: 1 |
Top |
Cell-cell communication analysis |
| Identification of potential cell-cell interactions between two cell types and their ligand-receptor pairs for different disease states |
| Ligand | Receptor | LRpair | Pathway | Tissue | Disease Stage |
| Page: 1 |
Top |
Single-cell gene regulatory network inference analysis |
| Find out the significant the regulons (TFs) and the target genes of each regulon across cell types for different disease states |
| TF | Cell Type | Tissue | Disease Stage | Target Gene | RSS | Regulon Activity |
| ∗The dot plots of a searched regulon are shown for all cell subpopulations in each disease state of each tissue based on the regulon specific score inferred using pySCENIC and by calculating the average expression. |
| Page: 1 |
Top |
Somatic mutation of malignant transformation related genes |
| Annotation of somatic variants for genes involved in malignant transformation |
| Hugo Symbol | Variant Class | Variant Classification | dbSNP RS | HGVSc | HGVSp | HGVSp Short | SWISSPROT | BIOTYPE | SIFT | PolyPhen | Tumor Sample Barcode | Tissue | Histology | Sex | Age | Stage | Therapy Types | Drugs | Outcome |
| RHBG | SNV | Missense_Mutation | novel | c.499N>C | p.Glu167Gln | p.E167Q | Q9H310 | protein_coding | deleterious(0.01) | probably_damaging(0.999) | TCGA-5L-AAT1-01 | Breast | breast invasive carcinoma | Female | <65 | III/IV | Hormone Therapy | letrozol | SD |
| RHBG | insertion | Frame_Shift_Ins | novel | c.1100_1101insGGCAGGAAAAGGAAGCAAGGACTACCCTGCTTGTG | p.Tyr368AlafsTer24 | p.Y368Afs*24 | Q9H310 | protein_coding | TCGA-A8-A08T-01 | Breast | breast invasive carcinoma | Female | <65 | III/IV | Unknown | Unknown | PD | ||
| RHBG | SNV | Missense_Mutation | novel | c.646T>G | p.Tyr216Asp | p.Y216D | Q9H310 | protein_coding | deleterious(0) | possibly_damaging(0.771) | TCGA-C5-A8XH-01 | Cervix | cervical & endocervical cancer | Female | <65 | I/II | Unknown | Unknown | SD |
| RHBG | SNV | Missense_Mutation | rs776794312 | c.1318G>A | p.Glu440Lys | p.E440K | Q9H310 | protein_coding | deleterious(0.04) | benign(0.381) | TCGA-EK-A2RA-01 | Cervix | cervical & endocervical cancer | Female | >=65 | I/II | Unknown | Unknown | SD |
| RHBG | SNV | Missense_Mutation | rs202077403 | c.1043C>T | p.Pro348Leu | p.P348L | Q9H310 | protein_coding | deleterious(0) | possibly_damaging(0.888) | TCGA-A6-2686-01 | Colorectum | colon adenocarcinoma | Female | >=65 | I/II | Unknown | Unknown | SD |
| RHBG | SNV | Missense_Mutation | rs371854390 | c.406N>A | p.Val136Met | p.V136M | Q9H310 | protein_coding | deleterious(0.03) | possibly_damaging(0.705) | TCGA-AA-3713-01 | Colorectum | colon adenocarcinoma | Male | >=65 | III/IV | Chemotherapy | 5-fluorouracil | PR |
| RHBG | SNV | Missense_Mutation | c.955A>G | p.Thr319Ala | p.T319A | Q9H310 | protein_coding | deleterious(0.02) | possibly_damaging(0.61) | TCGA-AA-3864-01 | Colorectum | colon adenocarcinoma | Male | >=65 | I/II | Unknown | Unknown | SD | |
| RHBG | SNV | Missense_Mutation | novel | c.1247N>G | p.Lys416Arg | p.K416R | Q9H310 | protein_coding | tolerated(0.45) | benign(0.001) | TCGA-AA-3966-01 | Colorectum | colon adenocarcinoma | Female | >=65 | I/II | Unknown | Unknown | SD |
| RHBG | SNV | Missense_Mutation | novel | c.871G>A | p.Gly291Arg | p.G291R | Q9H310 | protein_coding | deleterious(0) | probably_damaging(1) | TCGA-AA-A00N-01 | Colorectum | colon adenocarcinoma | Male | >=65 | I/II | Unknown | Unknown | PD |
| RHBG | SNV | Missense_Mutation | rs776794312 | c.1318N>A | p.Glu440Lys | p.E440K | Q9H310 | protein_coding | deleterious(0.04) | benign(0.381) | TCGA-AZ-6598-01 | Colorectum | colon adenocarcinoma | Female | >=65 | I/II | Unknown | Unknown | SD |
| Page: 1 2 3 4 5 6 |
Top |
Related drugs of malignant transformation related genes |
| Identification of chemicals and drugs interact with genes involved in malignant transfromation |
| (DGIdb 4.0) |
| Entrez ID | Symbol | Category | Interaction Types | Drug Claim Name | Drug Name | PMIDs |
| Page: 1 |

Copyright 2023-Present -The University of Texas Health Science Center at Houston |