
|
|||||
|
 | |
| |
| |
| |
| |
| |
|
Gene: RHBDF1 |
Gene summary for RHBDF1 |
| Gene information | Species | Human | Gene symbol | RHBDF1 | Gene ID | 64285 |
| Gene name | rhomboid 5 homolog 1 | |
| Gene Alias | C16orf8 | |
| Cytomap | 16p13.3 | |
| Gene Type | protein-coding | GO ID | GO:0006508 | UniProtAcc | Q96CC6 |
Top |
Malignant transformation analysis |
| Identification of the aberrant gene expression in precancerous and cancerous lesions by comparing the gene expression of stem-like cells in diseased tissues with normal stem cells |
| Entrez ID | Symbol | Replicates | Species | Organ | Tissue | Adj P-value | Log2FC | Malignancy |
| 64285 | RHBDF1 | HTA11_2487_2000001011 | Human | Colorectum | SER | 1.64e-05 | 2.63e-01 | -0.1808 |
| 64285 | RHBDF1 | HTA11_1938_2000001011 | Human | Colorectum | AD | 5.43e-03 | 2.23e-01 | -0.0811 |
| 64285 | RHBDF1 | HTA11_411_2000001011 | Human | Colorectum | SER | 2.50e-07 | 8.33e-01 | -0.2602 |
| 64285 | RHBDF1 | HTA11_2112_2000001011 | Human | Colorectum | SER | 3.53e-02 | 5.13e-01 | -0.2196 |
| 64285 | RHBDF1 | HTA11_696_2000001011 | Human | Colorectum | AD | 9.89e-04 | 1.34e-01 | -0.1464 |
| 64285 | RHBDF1 | HTA11_866_2000001011 | Human | Colorectum | AD | 9.28e-04 | 9.40e-02 | -0.1001 |
| 64285 | RHBDF1 | HTA11_1391_2000001011 | Human | Colorectum | AD | 4.36e-02 | 1.99e-01 | -0.059 |
| 64285 | RHBDF1 | HTA11_866_3004761011 | Human | Colorectum | AD | 4.50e-03 | 1.62e-01 | 0.096 |
| 64285 | RHBDF1 | HTA11_7696_3000711011 | Human | Colorectum | AD | 1.63e-07 | 1.96e-01 | 0.0674 |
| 64285 | RHBDF1 | HTA11_99999970781_79442 | Human | Colorectum | MSS | 1.17e-15 | 4.07e-01 | 0.294 |
| 64285 | RHBDF1 | HTA11_99999971662_82457 | Human | Colorectum | MSS | 2.77e-13 | 3.53e-01 | 0.3859 |
| 64285 | RHBDF1 | HTA11_99999973899_84307 | Human | Colorectum | MSS | 7.99e-05 | 4.27e-01 | 0.2585 |
| 64285 | RHBDF1 | HTA11_99999974143_84620 | Human | Colorectum | MSS | 1.32e-08 | 1.77e-01 | 0.3005 |
| 64285 | RHBDF1 | C21 | Human | Oral cavity | OSCC | 3.06e-17 | 4.78e-01 | 0.2678 |
| 64285 | RHBDF1 | C30 | Human | Oral cavity | OSCC | 1.71e-15 | 6.90e-01 | 0.3055 |
| 64285 | RHBDF1 | C43 | Human | Oral cavity | OSCC | 2.88e-04 | 1.11e-01 | 0.1704 |
| 64285 | RHBDF1 | C46 | Human | Oral cavity | OSCC | 2.12e-04 | 1.32e-01 | 0.1673 |
| 64285 | RHBDF1 | C57 | Human | Oral cavity | OSCC | 5.84e-17 | 2.94e-01 | 0.1679 |
| 64285 | RHBDF1 | C06 | Human | Oral cavity | OSCC | 7.98e-03 | 5.38e-01 | 0.2699 |
| 64285 | RHBDF1 | C08 | Human | Oral cavity | OSCC | 2.83e-11 | 1.36e-01 | 0.1919 |
| Page: 1 2 |
| Tissue | Expression Dynamics | Abbreviation |
| Colorectum (GSE201348) |  | FAP: Familial adenomatous polyposis |
| CRC: Colorectal cancer | ||
| Colorectum (HTA11) |  | AD: Adenomas |
| SER: Sessile serrated lesions | ||
| MSI-H: Microsatellite-high colorectal cancer | ||
| MSS: Microsatellite stable colorectal cancer | ||
| Oral Cavity |  | EOLP: Erosive Oral lichen planus |
| LP: leukoplakia | ||
| NEOLP: Non-erosive oral lichen planus | ||
| OSCC: Oral squamous cell carcinoma | ||
| Thyroid | 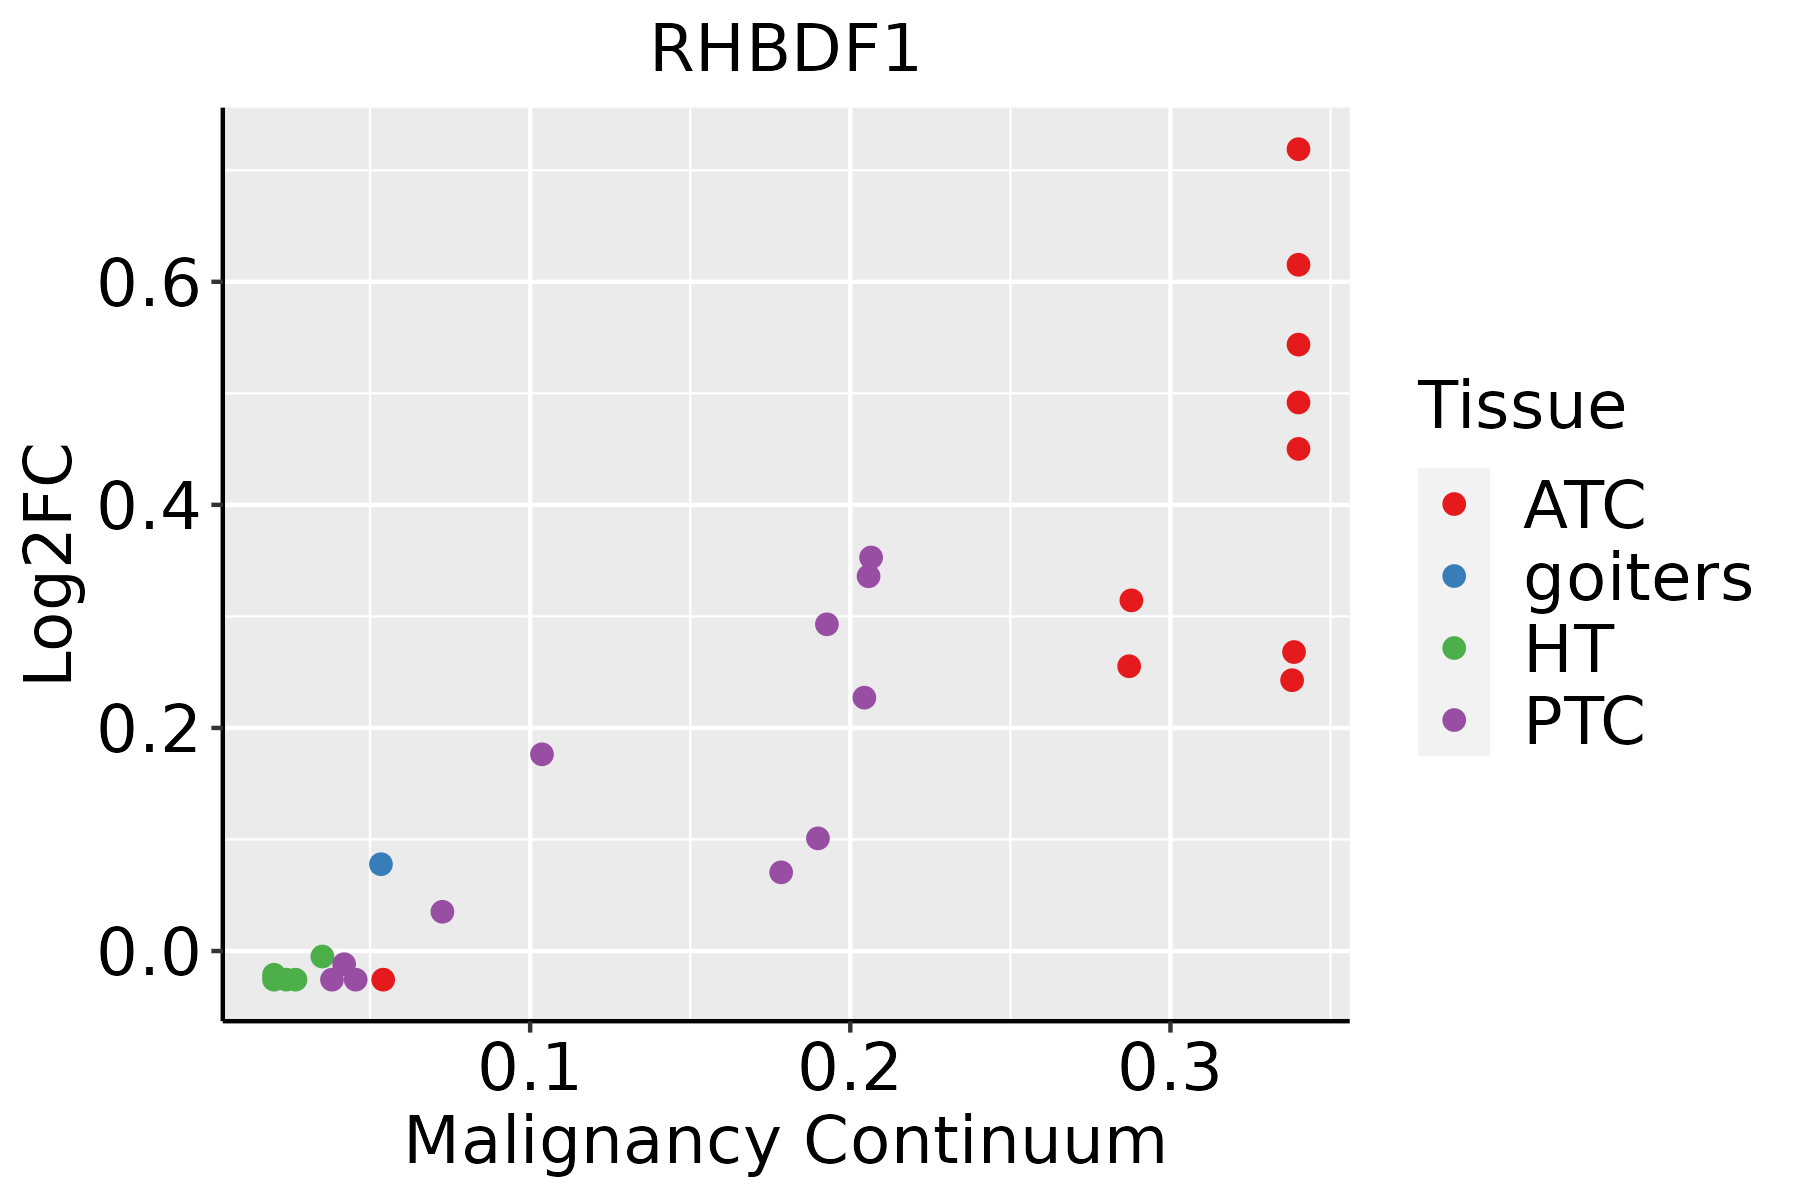 | ATC: Anaplastic thyroid cancer |
| HT: Hashimoto's thyroiditis | ||
| PTC: Papillary thyroid cancer |
| ∗log2FC in expression of this searched gene in stem-like cells from each diseased tissue sample relative to stem-like cells in normal samples in each tissue plotted against the malignancy continuum. Samples are colored based on if they are from different disease stage. |
Top |
Malignant transformation related pathway analysis |
| Find out the enriched GO biological processes and KEGG pathways involved in transition from healthy to precancer to cancer |
| Tissue | Disease Stage | Enriched GO biological Processes |
| Colorectum | AD |  |
| Colorectum | SER |  |
| Colorectum | MSS |  |
| Colorectum | MSI-H |  |
| Colorectum | FAP |  |
| ∗Top 15 enriched GO BP terms are showed in the bar plot of each disease state in each tissue. Each row represents a significant GO biological process which is colored according to the -log10(p.adjust). |
| Page: 1 2 3 4 5 6 7 8 9 |
| GO ID | Tissue | Disease Stage | Description | Gene Ratio | Bg Ratio | pvalue | p.adjust | Count |
| GO:0042176 | Colorectum | AD | regulation of protein catabolic process | 160/3918 | 391/18723 | 1.06e-19 | 7.34e-17 | 160 |
| GO:1903362 | Colorectum | AD | regulation of cellular protein catabolic process | 109/3918 | 255/18723 | 2.14e-15 | 6.08e-13 | 109 |
| GO:0010498 | Colorectum | AD | proteasomal protein catabolic process | 174/3918 | 490/18723 | 3.18e-14 | 7.66e-12 | 174 |
| GO:1903050 | Colorectum | AD | regulation of proteolysis involved in cellular protein catabolic process | 92/3918 | 221/18723 | 2.04e-12 | 3.19e-10 | 92 |
| GO:0038127 | Colorectum | AD | ERBB signaling pathway | 55/3918 | 121/18723 | 1.19e-09 | 8.85e-08 | 55 |
| GO:0061136 | Colorectum | AD | regulation of proteasomal protein catabolic process | 75/3918 | 187/18723 | 1.65e-09 | 1.20e-07 | 75 |
| GO:0007173 | Colorectum | AD | epidermal growth factor receptor signaling pathway | 50/3918 | 108/18723 | 3.08e-09 | 2.07e-07 | 50 |
| GO:1901184 | Colorectum | AD | regulation of ERBB signaling pathway | 34/3918 | 79/18723 | 7.46e-06 | 1.82e-04 | 34 |
| GO:0042058 | Colorectum | AD | regulation of epidermal growth factor receptor signaling pathway | 31/3918 | 73/18723 | 2.56e-05 | 4.89e-04 | 31 |
| GO:0050708 | Colorectum | AD | regulation of protein secretion | 83/3918 | 268/18723 | 6.59e-05 | 1.07e-03 | 83 |
| GO:0009306 | Colorectum | AD | protein secretion | 105/3918 | 359/18723 | 1.05e-04 | 1.57e-03 | 105 |
| GO:0035592 | Colorectum | AD | establishment of protein localization to extracellular region | 105/3918 | 360/18723 | 1.18e-04 | 1.73e-03 | 105 |
| GO:0071692 | Colorectum | AD | protein localization to extracellular region | 106/3918 | 368/18723 | 1.86e-04 | 2.49e-03 | 106 |
| GO:00421761 | Colorectum | SER | regulation of protein catabolic process | 126/2897 | 391/18723 | 5.33e-17 | 2.52e-14 | 126 |
| GO:19033621 | Colorectum | SER | regulation of cellular protein catabolic process | 91/2897 | 255/18723 | 1.22e-15 | 5.36e-13 | 91 |
| GO:19030501 | Colorectum | SER | regulation of proteolysis involved in cellular protein catabolic process | 77/2897 | 221/18723 | 7.85e-13 | 2.00e-10 | 77 |
| GO:00104981 | Colorectum | SER | proteasomal protein catabolic process | 132/2897 | 490/18723 | 3.08e-11 | 5.55e-09 | 132 |
| GO:00611361 | Colorectum | SER | regulation of proteasomal protein catabolic process | 62/2897 | 187/18723 | 1.28e-09 | 1.31e-07 | 62 |
| GO:00381271 | Colorectum | SER | ERBB signaling pathway | 35/2897 | 121/18723 | 1.21e-04 | 2.49e-03 | 35 |
| GO:00071731 | Colorectum | SER | epidermal growth factor receptor signaling pathway | 32/2897 | 108/18723 | 1.42e-04 | 2.82e-03 | 32 |
| Page: 1 2 3 4 5 |
| Pathway ID | Tissue | Disease Stage | Description | Gene Ratio | Bg Ratio | pvalue | p.adjust | qvalue | Count |
| Page: 1 |
Top |
Cell-cell communication analysis |
| Identification of potential cell-cell interactions between two cell types and their ligand-receptor pairs for different disease states |
| Ligand | Receptor | LRpair | Pathway | Tissue | Disease Stage |
| Page: 1 |
Top |
Single-cell gene regulatory network inference analysis |
| Find out the significant the regulons (TFs) and the target genes of each regulon across cell types for different disease states |
| TF | Cell Type | Tissue | Disease Stage | Target Gene | RSS | Regulon Activity |
| ∗The dot plots of a searched regulon are shown for all cell subpopulations in each disease state of each tissue based on the regulon specific score inferred using pySCENIC and by calculating the average expression. |
| Page: 1 |
Top |
Somatic mutation of malignant transformation related genes |
| Annotation of somatic variants for genes involved in malignant transformation |
| Hugo Symbol | Variant Class | Variant Classification | dbSNP RS | HGVSc | HGVSp | HGVSp Short | SWISSPROT | BIOTYPE | SIFT | PolyPhen | Tumor Sample Barcode | Tissue | Histology | Sex | Age | Stage | Therapy Types | Drugs | Outcome |
| RHBDF1 | SNV | Missense_Mutation | c.1739N>A | p.Ser580Asn | p.S580N | Q96CC6 | protein_coding | tolerated(0.7) | benign(0.001) | TCGA-E9-A1R3-01 | Breast | breast invasive carcinoma | Female | >=65 | III/IV | Chemotherapy | methotrexate | SD | |
| RHBDF1 | insertion | In_Frame_Ins | novel | c.58_59insAGG | p.Leu20delinsGlnVal | p.L20delinsQV | Q96CC6 | protein_coding | TCGA-A2-A0ER-01 | Breast | breast invasive carcinoma | Female | <65 | I/II | Chemotherapy | cytoxan | SD | ||
| RHBDF1 | insertion | Frame_Shift_Ins | novel | c.57_58insATGGGGACATGGTCTTGGGATTGCAC | p.Leu20MetfsTer10 | p.L20Mfs*10 | Q96CC6 | protein_coding | TCGA-A2-A0ER-01 | Breast | breast invasive carcinoma | Female | <65 | I/II | Chemotherapy | cytoxan | SD | ||
| RHBDF1 | deletion | Frame_Shift_Del | c.1295delT | p.Phe432SerfsTer95 | p.F432Sfs*95 | Q96CC6 | protein_coding | TCGA-D8-A27V-01 | Breast | breast invasive carcinoma | Female | <65 | I/II | Hormone Therapy | tamoxiphen | SD | |||
| RHBDF1 | SNV | Missense_Mutation | rs772594707 | c.177N>G | p.Ile59Met | p.I59M | Q96CC6 | protein_coding | tolerated(0.24) | benign(0.001) | TCGA-C5-A1MK-01 | Cervix | cervical & endocervical cancer | Female | >=65 | III/IV | Chemotherapy | carboplatin | PD |
| RHBDF1 | SNV | Missense_Mutation | c.224N>T | p.Thr75Met | p.T75M | Q96CC6 | protein_coding | tolerated(0.09) | benign(0.014) | TCGA-AA-3864-01 | Colorectum | colon adenocarcinoma | Male | >=65 | I/II | Unknown | Unknown | SD | |
| RHBDF1 | SNV | Missense_Mutation | c.1453G>A | p.Val485Met | p.V485M | Q96CC6 | protein_coding | deleterious(0) | benign(0.06) | TCGA-AD-5900-01 | Colorectum | colon adenocarcinoma | Male | >=65 | I/II | Unknown | Unknown | SD | |
| RHBDF1 | SNV | Missense_Mutation | c.1433N>A | p.Cys478Tyr | p.C478Y | Q96CC6 | protein_coding | deleterious(0) | probably_damaging(0.922) | TCGA-AD-6889-01 | Colorectum | colon adenocarcinoma | Male | >=65 | I/II | Chemotherapy | xeloda | PD | |
| RHBDF1 | SNV | Missense_Mutation | c.1861T>C | p.Tyr621His | p.Y621H | Q96CC6 | protein_coding | deleterious(0.01) | possibly_damaging(0.54) | TCGA-AD-A5EJ-01 | Colorectum | colon adenocarcinoma | Female | >=65 | I/II | Unknown | Unknown | SD | |
| RHBDF1 | SNV | Missense_Mutation | rs573506725 | c.1327N>T | p.Arg443Trp | p.R443W | Q96CC6 | protein_coding | deleterious(0.03) | benign(0.174) | TCGA-D5-6530-01 | Colorectum | colon adenocarcinoma | Male | <65 | I/II | Unknown | Unknown | SD |
| Page: 1 2 3 4 5 6 7 8 |
Top |
Related drugs of malignant transformation related genes |
| Identification of chemicals and drugs interact with genes involved in malignant transfromation |
| (DGIdb 4.0) |
| Entrez ID | Symbol | Category | Interaction Types | Drug Claim Name | Drug Name | PMIDs |
| Page: 1 |

Copyright 2023-Present -The University of Texas Health Science Center at Houston |