
|
|||||
|
 | |
| |
| |
| |
| |
| |
|
Gene: RHBDD3 |
Gene summary for RHBDD3 |
| Gene information | Species | Human | Gene symbol | RHBDD3 | Gene ID | 25807 |
| Gene name | rhomboid domain containing 3 | |
| Gene Alias | C22orf3 | |
| Cytomap | 22q12.2 | |
| Gene Type | protein-coding | GO ID | GO:0000165 | UniProtAcc | A0A024R1J2 |
Top |
Malignant transformation analysis |
| Identification of the aberrant gene expression in precancerous and cancerous lesions by comparing the gene expression of stem-like cells in diseased tissues with normal stem cells |
| Entrez ID | Symbol | Replicates | Species | Organ | Tissue | Adj P-value | Log2FC | Malignancy |
| 25807 | RHBDD3 | LZE4T | Human | Esophagus | ESCC | 1.57e-03 | 1.56e-01 | 0.0811 |
| 25807 | RHBDD3 | LZE7T | Human | Esophagus | ESCC | 4.16e-07 | 3.94e-01 | 0.0667 |
| 25807 | RHBDD3 | LZE8T | Human | Esophagus | ESCC | 3.16e-05 | 1.97e-01 | 0.067 |
| 25807 | RHBDD3 | LZE24T | Human | Esophagus | ESCC | 2.52e-09 | 2.93e-01 | 0.0596 |
| 25807 | RHBDD3 | LZE21T | Human | Esophagus | ESCC | 1.74e-03 | 2.40e-01 | 0.0655 |
| 25807 | RHBDD3 | LZE6T | Human | Esophagus | ESCC | 3.40e-02 | 1.99e-01 | 0.0845 |
| 25807 | RHBDD3 | P1T-E | Human | Esophagus | ESCC | 6.30e-06 | 3.45e-01 | 0.0875 |
| 25807 | RHBDD3 | P2T-E | Human | Esophagus | ESCC | 2.47e-27 | 4.42e-01 | 0.1177 |
| 25807 | RHBDD3 | P4T-E | Human | Esophagus | ESCC | 2.86e-30 | 6.73e-01 | 0.1323 |
| 25807 | RHBDD3 | P5T-E | Human | Esophagus | ESCC | 5.98e-07 | 1.16e-01 | 0.1327 |
| 25807 | RHBDD3 | P8T-E | Human | Esophagus | ESCC | 3.92e-24 | 3.74e-01 | 0.0889 |
| 25807 | RHBDD3 | P9T-E | Human | Esophagus | ESCC | 6.93e-11 | 2.60e-01 | 0.1131 |
| 25807 | RHBDD3 | P10T-E | Human | Esophagus | ESCC | 2.42e-27 | 4.38e-01 | 0.116 |
| 25807 | RHBDD3 | P11T-E | Human | Esophagus | ESCC | 7.95e-08 | 3.91e-01 | 0.1426 |
| 25807 | RHBDD3 | P12T-E | Human | Esophagus | ESCC | 1.33e-22 | 4.08e-01 | 0.1122 |
| 25807 | RHBDD3 | P15T-E | Human | Esophagus | ESCC | 7.01e-19 | 4.12e-01 | 0.1149 |
| 25807 | RHBDD3 | P16T-E | Human | Esophagus | ESCC | 6.26e-27 | 4.29e-01 | 0.1153 |
| 25807 | RHBDD3 | P17T-E | Human | Esophagus | ESCC | 8.04e-08 | 3.36e-01 | 0.1278 |
| 25807 | RHBDD3 | P20T-E | Human | Esophagus | ESCC | 4.20e-12 | 2.37e-01 | 0.1124 |
| 25807 | RHBDD3 | P21T-E | Human | Esophagus | ESCC | 3.28e-07 | 2.49e-01 | 0.1617 |
| Page: 1 2 3 4 5 |
| Tissue | Expression Dynamics | Abbreviation |
| Esophagus |  | ESCC: Esophageal squamous cell carcinoma |
| HGIN: High-grade intraepithelial neoplasias | ||
| LGIN: Low-grade intraepithelial neoplasias | ||
| Liver | 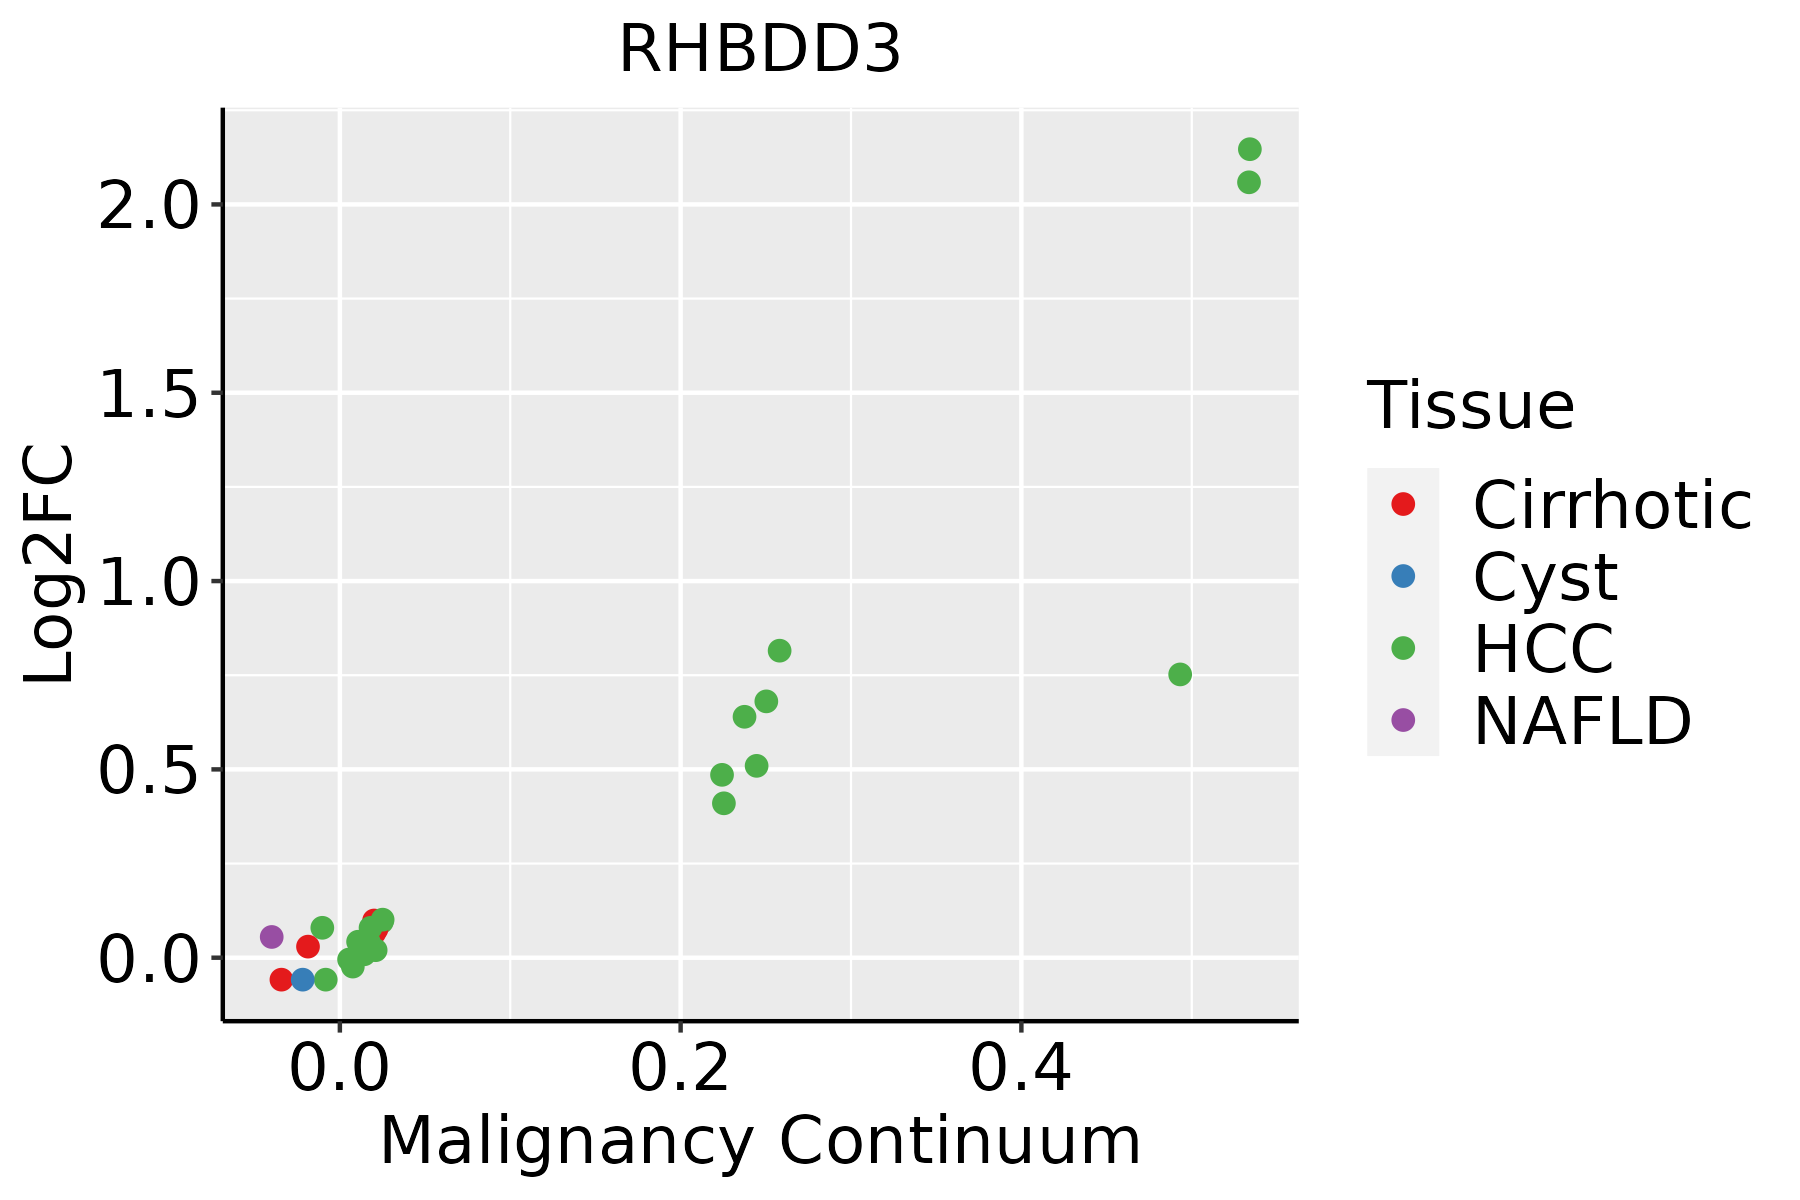 | HCC: Hepatocellular carcinoma |
| NAFLD: Non-alcoholic fatty liver disease | ||
| Oral Cavity |  | EOLP: Erosive Oral lichen planus |
| LP: leukoplakia | ||
| NEOLP: Non-erosive oral lichen planus | ||
| OSCC: Oral squamous cell carcinoma |
| ∗log2FC in expression of this searched gene in stem-like cells from each diseased tissue sample relative to stem-like cells in normal samples in each tissue plotted against the malignancy continuum. Samples are colored based on if they are from different disease stage. |
Top |
Malignant transformation related pathway analysis |
| Find out the enriched GO biological processes and KEGG pathways involved in transition from healthy to precancer to cancer |
| Tissue | Disease Stage | Enriched GO biological Processes |
| Colorectum | AD |  |
| Colorectum | SER |  |
| Colorectum | MSS |  |
| Colorectum | MSI-H |  |
| Colorectum | FAP |  |
| ∗Top 15 enriched GO BP terms are showed in the bar plot of each disease state in each tissue. Each row represents a significant GO biological process which is colored according to the -log10(p.adjust). |
| Page: 1 2 3 4 5 6 7 8 9 |
| GO ID | Tissue | Disease Stage | Description | Gene Ratio | Bg Ratio | pvalue | p.adjust | Count |
| GO:0042176111 | Esophagus | ESCC | regulation of protein catabolic process | 280/8552 | 391/18723 | 8.65e-26 | 2.39e-23 | 280 |
| GO:0009896111 | Esophagus | ESCC | positive regulation of catabolic process | 332/8552 | 492/18723 | 4.36e-23 | 9.22e-21 | 332 |
| GO:0045732111 | Esophagus | ESCC | positive regulation of protein catabolic process | 167/8552 | 231/18723 | 1.47e-16 | 1.14e-14 | 167 |
| GO:0048732111 | Esophagus | ESCC | gland development | 269/8552 | 436/18723 | 7.81e-12 | 2.95e-10 | 269 |
| GO:0061008110 | Esophagus | ESCC | hepaticobiliary system development | 98/8552 | 150/18723 | 8.91e-07 | 1.15e-05 | 98 |
| GO:0001889110 | Esophagus | ESCC | liver development | 96/8552 | 147/18723 | 1.18e-06 | 1.47e-05 | 96 |
| GO:000941020 | Esophagus | ESCC | response to xenobiotic stimulus | 253/8552 | 462/18723 | 4.55e-05 | 3.58e-04 | 253 |
| GO:000268316 | Esophagus | ESCC | negative regulation of immune system process | 231/8552 | 434/18723 | 8.48e-04 | 4.36e-03 | 231 |
| GO:000930617 | Esophagus | ESCC | protein secretion | 190/8552 | 359/18723 | 3.22e-03 | 1.34e-02 | 190 |
| GO:003559217 | Esophagus | ESCC | establishment of protein localization to extracellular region | 190/8552 | 360/18723 | 3.77e-03 | 1.53e-02 | 190 |
| GO:007169210 | Esophagus | ESCC | protein localization to extracellular region | 193/8552 | 368/18723 | 5.01e-03 | 1.92e-02 | 193 |
| GO:005070810 | Esophagus | ESCC | regulation of protein secretion | 142/8552 | 268/18723 | 9.31e-03 | 3.24e-02 | 142 |
| GO:000989622 | Liver | HCC | positive regulation of catabolic process | 335/7958 | 492/18723 | 3.83e-31 | 1.87e-28 | 335 |
| GO:004217622 | Liver | HCC | regulation of protein catabolic process | 267/7958 | 391/18723 | 2.45e-25 | 7.38e-23 | 267 |
| GO:004573222 | Liver | HCC | positive regulation of protein catabolic process | 163/7958 | 231/18723 | 4.00e-18 | 4.69e-16 | 163 |
| GO:000188922 | Liver | HCC | liver development | 108/7958 | 147/18723 | 2.16e-14 | 1.41e-12 | 108 |
| GO:006100822 | Liver | HCC | hepaticobiliary system development | 109/7958 | 150/18723 | 5.72e-14 | 3.42e-12 | 109 |
| GO:004873222 | Liver | HCC | gland development | 242/7958 | 436/18723 | 2.26e-08 | 5.28e-07 | 242 |
| GO:000941022 | Liver | HCC | response to xenobiotic stimulus | 248/7958 | 462/18723 | 6.47e-07 | 1.02e-05 | 248 |
| GO:00025262 | Liver | HCC | acute inflammatory response | 62/7958 | 112/18723 | 4.06e-03 | 1.77e-02 | 62 |
| Page: 1 2 3 |
| Pathway ID | Tissue | Disease Stage | Description | Gene Ratio | Bg Ratio | pvalue | p.adjust | qvalue | Count |
| Page: 1 |
Top |
Cell-cell communication analysis |
| Identification of potential cell-cell interactions between two cell types and their ligand-receptor pairs for different disease states |
| Ligand | Receptor | LRpair | Pathway | Tissue | Disease Stage |
| Page: 1 |
Top |
Single-cell gene regulatory network inference analysis |
| Find out the significant the regulons (TFs) and the target genes of each regulon across cell types for different disease states |
| TF | Cell Type | Tissue | Disease Stage | Target Gene | RSS | Regulon Activity |
| ∗The dot plots of a searched regulon are shown for all cell subpopulations in each disease state of each tissue based on the regulon specific score inferred using pySCENIC and by calculating the average expression. |
| Page: 1 |
Top |
Somatic mutation of malignant transformation related genes |
| Annotation of somatic variants for genes involved in malignant transformation |
| Hugo Symbol | Variant Class | Variant Classification | dbSNP RS | HGVSc | HGVSp | HGVSp Short | SWISSPROT | BIOTYPE | SIFT | PolyPhen | Tumor Sample Barcode | Tissue | Histology | Sex | Age | Stage | Therapy Types | Drugs | Outcome |
| RHBDD3 | SNV | Missense_Mutation | rs751207459 | c.860C>T | p.Pro287Leu | p.P287L | Q9Y3P4 | protein_coding | tolerated(0.31) | benign(0.005) | TCGA-A6-5661-01 | Colorectum | colon adenocarcinoma | Female | >=65 | I/II | Unknown | Unknown | SD |
| RHBDD3 | SNV | Missense_Mutation | novel | c.563C>T | p.Pro188Leu | p.P188L | Q9Y3P4 | protein_coding | tolerated(1) | benign(0) | TCGA-CM-6168-01 | Colorectum | colon adenocarcinoma | Female | >=65 | I/II | Unknown | Unknown | SD |
| RHBDD3 | SNV | Missense_Mutation | c.628N>T | p.Pro210Ser | p.P210S | Q9Y3P4 | protein_coding | tolerated(0.33) | possibly_damaging(0.831) | TCGA-D5-6927-01 | Colorectum | colon adenocarcinoma | Male | <65 | I/II | Unknown | Unknown | SD | |
| RHBDD3 | SNV | Missense_Mutation | c.1100A>G | p.Glu367Gly | p.E367G | Q9Y3P4 | protein_coding | deleterious(0.04) | benign(0.001) | TCGA-G5-6233-01 | Colorectum | rectum adenocarcinoma | Male | >=65 | III/IV | Chemotherapy | 5-fluorouracil | PD | |
| RHBDD3 | SNV | Missense_Mutation | c.512N>A | p.Gly171Asp | p.G171D | Q9Y3P4 | protein_coding | deleterious(0) | probably_damaging(0.995) | TCGA-A5-A0G1-01 | Endometrium | uterine corpus endometrioid carcinoma | Female | >=65 | I/II | Unknown | Unknown | SD | |
| RHBDD3 | SNV | Missense_Mutation | novel | c.686N>T | p.Ala229Val | p.A229V | Q9Y3P4 | protein_coding | tolerated(0.09) | benign(0.001) | TCGA-AP-A1DH-01 | Endometrium | uterine corpus endometrioid carcinoma | Female | <65 | I/II | Unknown | Unknown | SD |
| RHBDD3 | SNV | Missense_Mutation | novel | c.1148C>A | p.Pro383His | p.P383H | Q9Y3P4 | protein_coding | tolerated_low_confidence(0.06) | benign(0.431) | TCGA-B5-A1MX-01 | Endometrium | uterine corpus endometrioid carcinoma | Female | <65 | I/II | Hormone Therapy | megace | SD |
| RHBDD3 | SNV | Missense_Mutation | rs751651782 | c.434C>T | p.Pro145Leu | p.P145L | Q9Y3P4 | protein_coding | tolerated(0.23) | benign(0.036) | TCGA-B5-A1MX-01 | Endometrium | uterine corpus endometrioid carcinoma | Female | <65 | I/II | Hormone Therapy | megace | SD |
| RHBDD3 | SNV | Missense_Mutation | c.1079N>A | p.Val360Asp | p.V360D | Q9Y3P4 | protein_coding | deleterious(0) | probably_damaging(0.963) | TCGA-D1-A103-01 | Endometrium | uterine corpus endometrioid carcinoma | Female | >=65 | I/II | Unknown | Unknown | SD | |
| RHBDD3 | SNV | Missense_Mutation | rs751650483 | c.523N>A | p.Gly175Ser | p.G175S | Q9Y3P4 | protein_coding | deleterious(0) | probably_damaging(1) | TCGA-D1-A167-01 | Endometrium | uterine corpus endometrioid carcinoma | Female | >=65 | I/II | Unknown | Unknown | SD |
| Page: 1 2 |
Top |
Related drugs of malignant transformation related genes |
| Identification of chemicals and drugs interact with genes involved in malignant transfromation |
| (DGIdb 4.0) |
| Entrez ID | Symbol | Category | Interaction Types | Drug Claim Name | Drug Name | PMIDs |
| Page: 1 |

Copyright 2023-Present -The University of Texas Health Science Center at Houston |