
|
|||||
|
 | |
| |
| |
| |
| |
| |
|
Gene: RGS6 |
Gene summary for RGS6 |
| Gene information | Species | Human | Gene symbol | RGS6 | Gene ID | 9628 |
| Gene name | regulator of G protein signaling 6 | |
| Gene Alias | GAP | |
| Cytomap | 14q24.2 | |
| Gene Type | protein-coding | GO ID | GO:0007154 | UniProtAcc | P49758 |
Top |
Malignant transformation analysis |
| Identification of the aberrant gene expression in precancerous and cancerous lesions by comparing the gene expression of stem-like cells in diseased tissues with normal stem cells |
| Entrez ID | Symbol | Replicates | Species | Organ | Tissue | Adj P-value | Log2FC | Malignancy |
| 9628 | RGS6 | CCI_3 | Human | Cervix | CC | 1.06e-14 | 9.13e-01 | 0.516 |
| 9628 | RGS6 | H2 | Human | Cervix | HSIL_HPV | 8.73e-03 | 1.24e-01 | 0.0632 |
| 9628 | RGS6 | HTA11_2487_2000001011 | Human | Colorectum | SER | 4.90e-08 | 4.37e-01 | -0.1808 |
| 9628 | RGS6 | HTA11_7663_2000001011 | Human | Colorectum | SER | 4.04e-05 | 6.49e-01 | 0.0131 |
| 9628 | RGS6 | HTA11_10711_2000001011 | Human | Colorectum | AD | 1.60e-09 | 4.69e-01 | 0.0338 |
| 9628 | RGS6 | HTA11_99999974143_84620 | Human | Colorectum | MSS | 6.26e-04 | 2.17e-01 | 0.3005 |
| 9628 | RGS6 | F007 | Human | Colorectum | FAP | 2.87e-04 | 5.10e-01 | 0.1176 |
| 9628 | RGS6 | A002-C-010 | Human | Colorectum | FAP | 2.05e-13 | 5.12e-01 | 0.242 |
| 9628 | RGS6 | A014-C-040 | Human | Colorectum | FAP | 4.50e-02 | 5.92e-01 | -0.1184 |
| 9628 | RGS6 | A002-C-203 | Human | Colorectum | FAP | 5.14e-03 | 3.24e-01 | 0.2786 |
| 9628 | RGS6 | A001-C-108 | Human | Colorectum | FAP | 1.68e-09 | 4.47e-01 | -0.0272 |
| 9628 | RGS6 | A001-C-104 | Human | Colorectum | FAP | 4.10e-08 | 4.07e-01 | 0.0184 |
| 9628 | RGS6 | A015-C-202 | Human | Colorectum | FAP | 1.42e-03 | 3.19e-01 | -0.0849 |
| 9628 | RGS6 | A001-C-014 | Human | Colorectum | FAP | 1.85e-02 | 3.78e-01 | 0.0135 |
| 9628 | RGS6 | A001-C-203 | Human | Colorectum | FAP | 2.05e-06 | 4.54e-01 | -0.0481 |
| 9628 | RGS6 | A008-E-015 | Human | Colorectum | FAP | 5.65e-11 | 3.94e-01 | 0.0177 |
| 9628 | RGS6 | CRC-1-8810 | Human | Colorectum | CRC | 2.63e-02 | 3.01e-01 | 0.6257 |
| 9628 | RGS6 | AEH-subject1 | Human | Endometrium | AEH | 2.67e-12 | 3.94e-01 | -0.3059 |
| 9628 | RGS6 | AEH-subject2 | Human | Endometrium | AEH | 4.17e-11 | 4.21e-01 | -0.2525 |
| 9628 | RGS6 | AEH-subject3 | Human | Endometrium | AEH | 1.60e-05 | 2.99e-01 | -0.2576 |
| Page: 1 2 3 |
| Tissue | Expression Dynamics | Abbreviation |
| Cervix |  | CC: Cervix cancer |
| HSIL_HPV: HPV-infected high-grade squamous intraepithelial lesions | ||
| N_HPV: HPV-infected normal cervix | ||
| Colorectum (GSE201348) |  | FAP: Familial adenomatous polyposis |
| CRC: Colorectal cancer | ||
| Colorectum (HTA11) |  | AD: Adenomas |
| SER: Sessile serrated lesions | ||
| MSI-H: Microsatellite-high colorectal cancer | ||
| MSS: Microsatellite stable colorectal cancer | ||
| Endometrium |  | AEH: Atypical endometrial hyperplasia |
| EEC: Endometrioid Cancer | ||
| Oral Cavity | 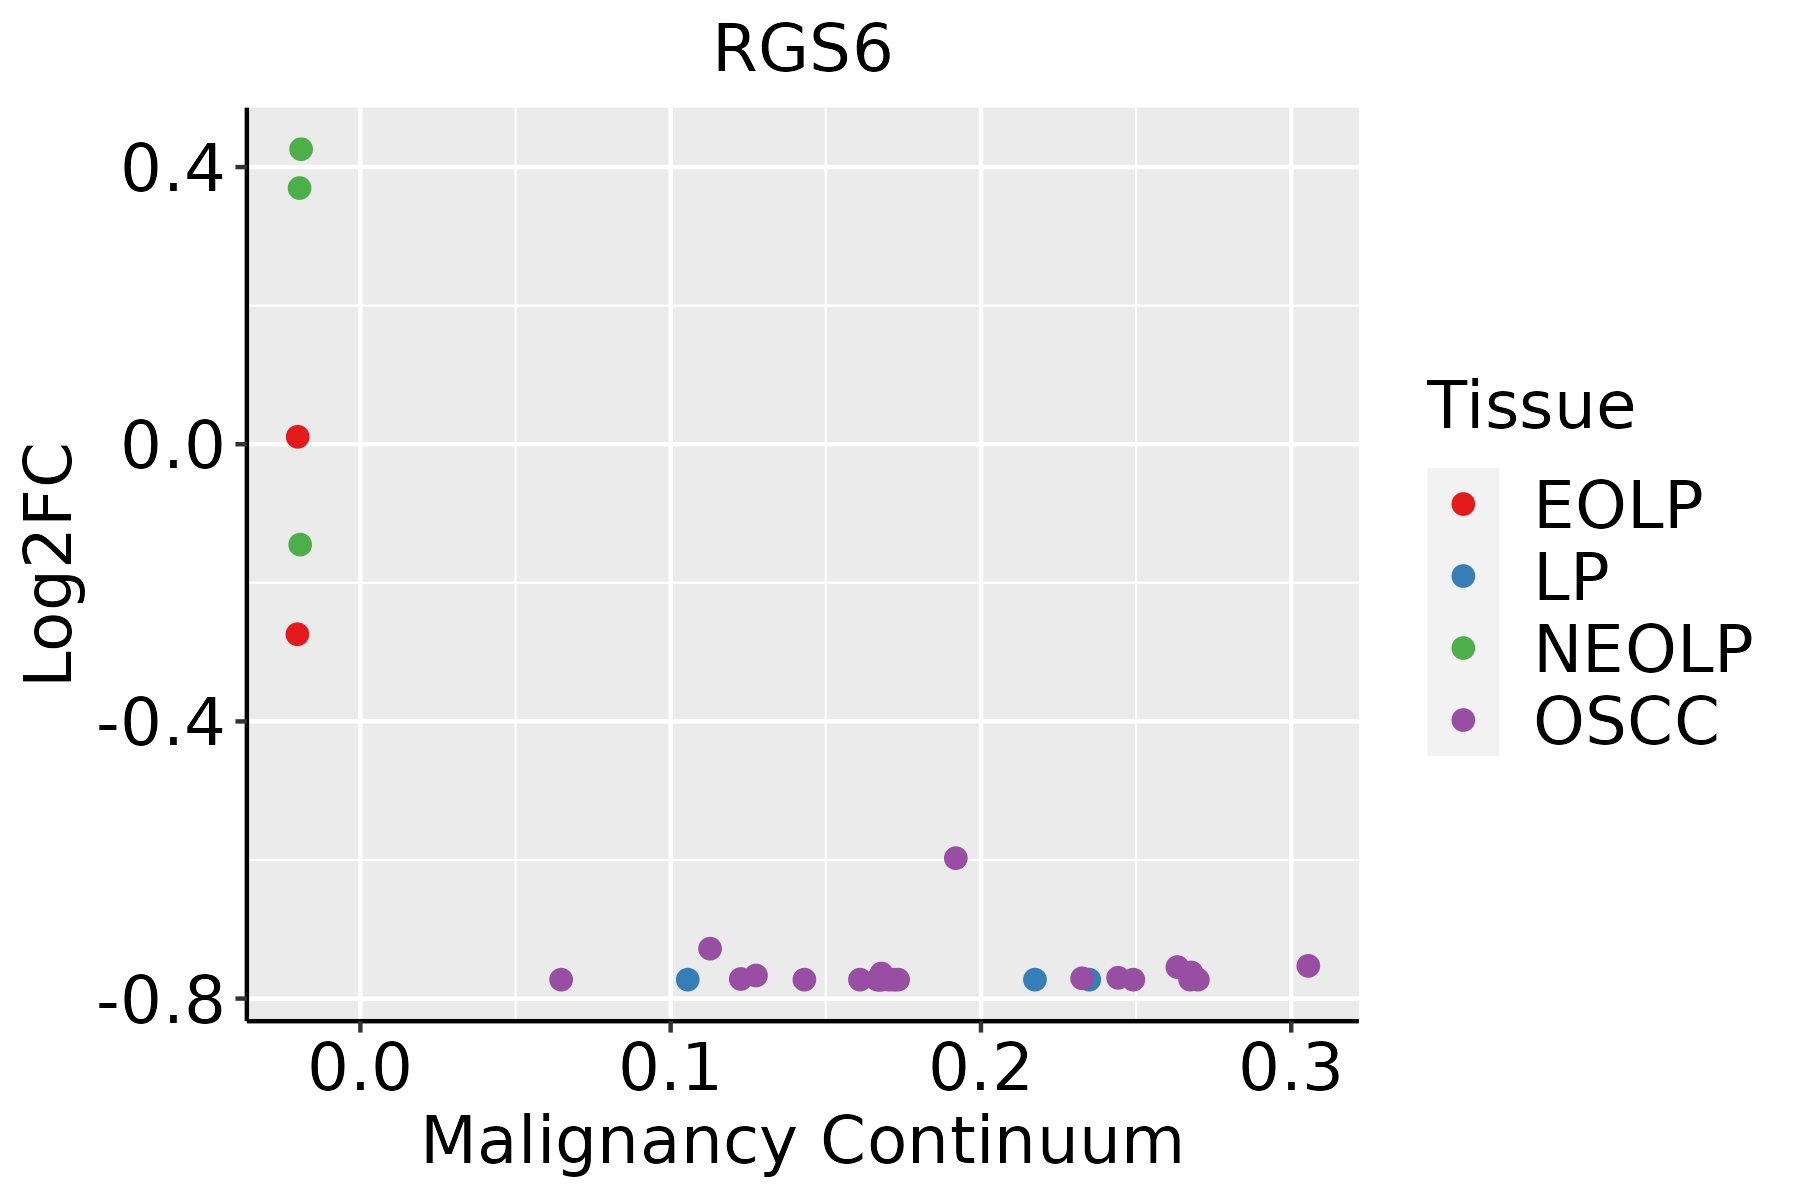 | EOLP: Erosive Oral lichen planus |
| LP: leukoplakia | ||
| NEOLP: Non-erosive oral lichen planus | ||
| OSCC: Oral squamous cell carcinoma |
| ∗log2FC in expression of this searched gene in stem-like cells from each diseased tissue sample relative to stem-like cells in normal samples in each tissue plotted against the malignancy continuum. Samples are colored based on if they are from different disease stage. |
Top |
Malignant transformation related pathway analysis |
| Find out the enriched GO biological processes and KEGG pathways involved in transition from healthy to precancer to cancer |
| Tissue | Disease Stage | Enriched GO biological Processes |
| Colorectum | AD |  |
| Colorectum | SER |  |
| Colorectum | MSS |  |
| Colorectum | MSI-H |  |
| Colorectum | FAP |  |
| ∗Top 15 enriched GO BP terms are showed in the bar plot of each disease state in each tissue. Each row represents a significant GO biological process which is colored according to the -log10(p.adjust). |
| Page: 1 2 3 4 5 6 7 8 9 |
| GO ID | Tissue | Disease Stage | Description | Gene Ratio | Bg Ratio | pvalue | p.adjust | Count |
| GO:00430877 | Cervix | CC | regulation of GTPase activity | 79/2311 | 348/18723 | 4.21e-08 | 2.60e-06 | 79 |
| GO:00435476 | Cervix | CC | positive regulation of GTPase activity | 53/2311 | 255/18723 | 8.72e-05 | 1.16e-03 | 53 |
| GO:0043087 | Colorectum | AD | regulation of GTPase activity | 110/3918 | 348/18723 | 1.64e-06 | 5.03e-05 | 110 |
| GO:0043547 | Colorectum | AD | positive regulation of GTPase activity | 75/3918 | 255/18723 | 7.95e-04 | 7.91e-03 | 75 |
| GO:00430871 | Colorectum | SER | regulation of GTPase activity | 77/2897 | 348/18723 | 5.90e-04 | 8.07e-03 | 77 |
| GO:00430872 | Colorectum | MSS | regulation of GTPase activity | 101/3467 | 348/18723 | 1.00e-06 | 3.46e-05 | 101 |
| GO:00435471 | Colorectum | MSS | positive regulation of GTPase activity | 68/3467 | 255/18723 | 7.97e-04 | 8.38e-03 | 68 |
| GO:00430873 | Colorectum | FAP | regulation of GTPase activity | 85/2622 | 348/18723 | 1.20e-07 | 7.68e-06 | 85 |
| GO:00435472 | Colorectum | FAP | positive regulation of GTPase activity | 61/2622 | 255/18723 | 1.39e-05 | 3.73e-04 | 61 |
| GO:00430874 | Colorectum | CRC | regulation of GTPase activity | 69/2078 | 348/18723 | 1.11e-06 | 6.69e-05 | 69 |
| GO:00435473 | Colorectum | CRC | positive regulation of GTPase activity | 49/2078 | 255/18723 | 8.67e-05 | 1.77e-03 | 49 |
| GO:00430878 | Endometrium | AEH | regulation of GTPase activity | 66/2100 | 348/18723 | 1.26e-05 | 2.77e-04 | 66 |
| GO:00435477 | Endometrium | AEH | positive regulation of GTPase activity | 48/2100 | 255/18723 | 2.18e-04 | 2.67e-03 | 48 |
| GO:004308712 | Endometrium | EEC | regulation of GTPase activity | 67/2168 | 348/18723 | 1.84e-05 | 3.43e-04 | 67 |
| GO:004354712 | Endometrium | EEC | positive regulation of GTPase activity | 50/2168 | 255/18723 | 1.26e-04 | 1.66e-03 | 50 |
| GO:004308710 | Oral cavity | OSCC | regulation of GTPase activity | 165/7305 | 348/18723 | 7.94e-04 | 4.27e-03 | 165 |
| GO:004308714 | Oral cavity | EOLP | regulation of GTPase activity | 66/2218 | 348/18723 | 6.92e-05 | 8.55e-04 | 66 |
| GO:00435479 | Oral cavity | EOLP | positive regulation of GTPase activity | 47/2218 | 255/18723 | 1.34e-03 | 9.33e-03 | 47 |
| GO:004308722 | Oral cavity | NEOLP | regulation of GTPase activity | 54/2005 | 348/18723 | 3.36e-03 | 2.00e-02 | 54 |
| Page: 1 |
| Pathway ID | Tissue | Disease Stage | Description | Gene Ratio | Bg Ratio | pvalue | p.adjust | qvalue | Count |
| Page: 1 |
Top |
Cell-cell communication analysis |
| Identification of potential cell-cell interactions between two cell types and their ligand-receptor pairs for different disease states |
| Ligand | Receptor | LRpair | Pathway | Tissue | Disease Stage |
| Page: 1 |
Top |
Single-cell gene regulatory network inference analysis |
| Find out the significant the regulons (TFs) and the target genes of each regulon across cell types for different disease states |
| TF | Cell Type | Tissue | Disease Stage | Target Gene | RSS | Regulon Activity |
| ∗The dot plots of a searched regulon are shown for all cell subpopulations in each disease state of each tissue based on the regulon specific score inferred using pySCENIC and by calculating the average expression. |
| Page: 1 |
Top |
Somatic mutation of malignant transformation related genes |
| Annotation of somatic variants for genes involved in malignant transformation |
| Hugo Symbol | Variant Class | Variant Classification | dbSNP RS | HGVSc | HGVSp | HGVSp Short | SWISSPROT | BIOTYPE | SIFT | PolyPhen | Tumor Sample Barcode | Tissue | Histology | Sex | Age | Stage | Therapy Types | Drugs | Outcome |
| RGS6 | SNV | Missense_Mutation | c.998G>T | p.Trp333Leu | p.W333L | P49758 | protein_coding | deleterious(0) | possibly_damaging(0.475) | TCGA-A8-A09Z-01 | Breast | breast invasive carcinoma | Female | >=65 | I/II | Unknown | Unknown | SD | |
| RGS6 | SNV | Missense_Mutation | c.1358N>T | p.Ala453Val | p.A453V | P49758 | protein_coding | deleterious(0.04) | benign(0.41) | TCGA-AN-A0AK-01 | Breast | breast invasive carcinoma | Female | >=65 | I/II | Unknown | Unknown | SD | |
| RGS6 | SNV | Missense_Mutation | c.1189C>G | p.Pro397Ala | p.P397A | P49758 | protein_coding | tolerated(0.08) | benign(0.141) | TCGA-D8-A27G-01 | Breast | breast invasive carcinoma | Female | >=65 | I/II | Unknown | Unknown | SD | |
| RGS6 | SNV | Missense_Mutation | novel | c.963N>A | p.Met321Ile | p.M321I | P49758 | protein_coding | tolerated(0.54) | benign(0.017) | TCGA-PE-A5DE-01 | Breast | breast invasive carcinoma | Female | <65 | I/II | Chemotherapy | taxotere | CR |
| RGS6 | insertion | Nonsense_Mutation | novel | c.1356_1357insTAATCTGGAGCTTGGCTTTTTTACTCATCCTAATTCCCTTGA | p.Leu452_Ala453insTer | p.L452_A453ins* | P49758 | protein_coding | TCGA-BH-A0BJ-01 | Breast | breast invasive carcinoma | Female | <65 | I/II | Chemotherapy | doxorubicin | SD | ||
| RGS6 | SNV | Missense_Mutation | novel | c.669N>C | p.Leu223Phe | p.L223F | P49758 | protein_coding | tolerated(0.29) | benign(0.09) | TCGA-JW-AAVH-01 | Cervix | cervical & endocervical cancer | Female | <65 | I/II | Unknown | Unknown | SD |
| RGS6 | SNV | Missense_Mutation | novel | c.80N>A | p.Cys27Tyr | p.C27Y | P49758 | protein_coding | deleterious(0.01) | benign(0.069) | TCGA-VS-A94W-01 | Cervix | cervical & endocervical cancer | Female | <65 | I/II | Chemotherapy | cisplatin | CR |
| RGS6 | SNV | Missense_Mutation | c.334C>T | p.Arg112Cys | p.R112C | P49758 | protein_coding | deleterious(0) | probably_damaging(1) | TCGA-AA-3688-01 | Colorectum | colon adenocarcinoma | Male | >=65 | III/IV | Unknown | Unknown | SD | |
| RGS6 | SNV | Missense_Mutation | c.1142C>T | p.Ala381Val | p.A381V | P49758 | protein_coding | deleterious(0.01) | benign(0.094) | TCGA-AA-3710-01 | Colorectum | colon adenocarcinoma | Female | >=65 | I/II | Unknown | Unknown | SD | |
| RGS6 | SNV | Missense_Mutation | c.583N>G | p.Gln195Glu | p.Q195E | P49758 | protein_coding | deleterious(0) | probably_damaging(0.983) | TCGA-AA-A01D-01 | Colorectum | colon adenocarcinoma | Female | <65 | III/IV | Chemotherapy | capecitabine | PD |
| Page: 1 2 3 4 5 6 7 8 9 |
Top |
Related drugs of malignant transformation related genes |
| Identification of chemicals and drugs interact with genes involved in malignant transfromation |
| (DGIdb 4.0) |
| Entrez ID | Symbol | Category | Interaction Types | Drug Claim Name | Drug Name | PMIDs |
| Page: 1 |

Copyright 2023-Present -The University of Texas Health Science Center at Houston |