
|
|||||
|
 | |
| |
| |
| |
| |
| |
|
Gene: RGS3 |
Gene summary for RGS3 |
| Gene information | Species | Human | Gene symbol | RGS3 | Gene ID | 5998 |
| Gene name | regulator of G protein signaling 3 | |
| Gene Alias | C2PA | |
| Cytomap | 9q32 | |
| Gene Type | protein-coding | GO ID | GO:0007154 | UniProtAcc | A0A024R831 |
Top |
Malignant transformation analysis |
| Identification of the aberrant gene expression in precancerous and cancerous lesions by comparing the gene expression of stem-like cells in diseased tissues with normal stem cells |
| Entrez ID | Symbol | Replicates | Species | Organ | Tissue | Adj P-value | Log2FC | Malignancy |
| 5998 | RGS3 | HTA11_347_2000001011 | Human | Colorectum | AD | 7.82e-09 | 3.73e-01 | -0.1954 |
| 5998 | RGS3 | HTA11_696_2000001011 | Human | Colorectum | AD | 2.68e-04 | 4.38e-01 | -0.1464 |
| 5998 | RGS3 | HTA11_1391_2000001011 | Human | Colorectum | AD | 1.87e-04 | 3.18e-01 | -0.059 |
| 5998 | RGS3 | A015-C-203 | Human | Colorectum | FAP | 2.22e-07 | -1.94e-01 | -0.1294 |
| 5998 | RGS3 | A001-C-108 | Human | Colorectum | FAP | 3.09e-03 | -1.67e-01 | -0.0272 |
| 5998 | RGS3 | A015-C-104 | Human | Colorectum | FAP | 1.83e-07 | -1.85e-01 | -0.1899 |
| 5998 | RGS3 | A002-C-016 | Human | Colorectum | FAP | 6.10e-05 | -1.12e-01 | 0.0521 |
| 5998 | RGS3 | A002-C-116 | Human | Colorectum | FAP | 1.16e-04 | -8.77e-02 | -0.0452 |
| 5998 | RGS3 | F034 | Human | Colorectum | FAP | 4.14e-02 | -1.23e-01 | -0.0665 |
| 5998 | RGS3 | P2T-E | Human | Esophagus | ESCC | 3.80e-17 | 3.19e-01 | 0.1177 |
| 5998 | RGS3 | P5T-E | Human | Esophagus | ESCC | 6.90e-04 | 2.50e-01 | 0.1327 |
| 5998 | RGS3 | P8T-E | Human | Esophagus | ESCC | 1.72e-03 | 1.10e-01 | 0.0889 |
| 5998 | RGS3 | P9T-E | Human | Esophagus | ESCC | 3.64e-04 | 4.05e-01 | 0.1131 |
| 5998 | RGS3 | P11T-E | Human | Esophagus | ESCC | 1.99e-20 | 9.68e-01 | 0.1426 |
| 5998 | RGS3 | P17T-E | Human | Esophagus | ESCC | 1.33e-02 | 3.03e-01 | 0.1278 |
| 5998 | RGS3 | P19T-E | Human | Esophagus | ESCC | 5.55e-08 | 9.59e-01 | 0.1662 |
| 5998 | RGS3 | P21T-E | Human | Esophagus | ESCC | 4.98e-21 | 5.61e-01 | 0.1617 |
| 5998 | RGS3 | P23T-E | Human | Esophagus | ESCC | 1.32e-02 | 4.44e-01 | 0.108 |
| 5998 | RGS3 | P24T-E | Human | Esophagus | ESCC | 2.13e-06 | 3.62e-01 | 0.1287 |
| 5998 | RGS3 | P27T-E | Human | Esophagus | ESCC | 4.55e-03 | 5.34e-02 | 0.1055 |
| Page: 1 2 3 4 |
| Tissue | Expression Dynamics | Abbreviation |
| Colorectum (GSE201348) |  | FAP: Familial adenomatous polyposis |
| CRC: Colorectal cancer | ||
| Colorectum (HTA11) |  | AD: Adenomas |
| SER: Sessile serrated lesions | ||
| MSI-H: Microsatellite-high colorectal cancer | ||
| MSS: Microsatellite stable colorectal cancer | ||
| Esophagus | 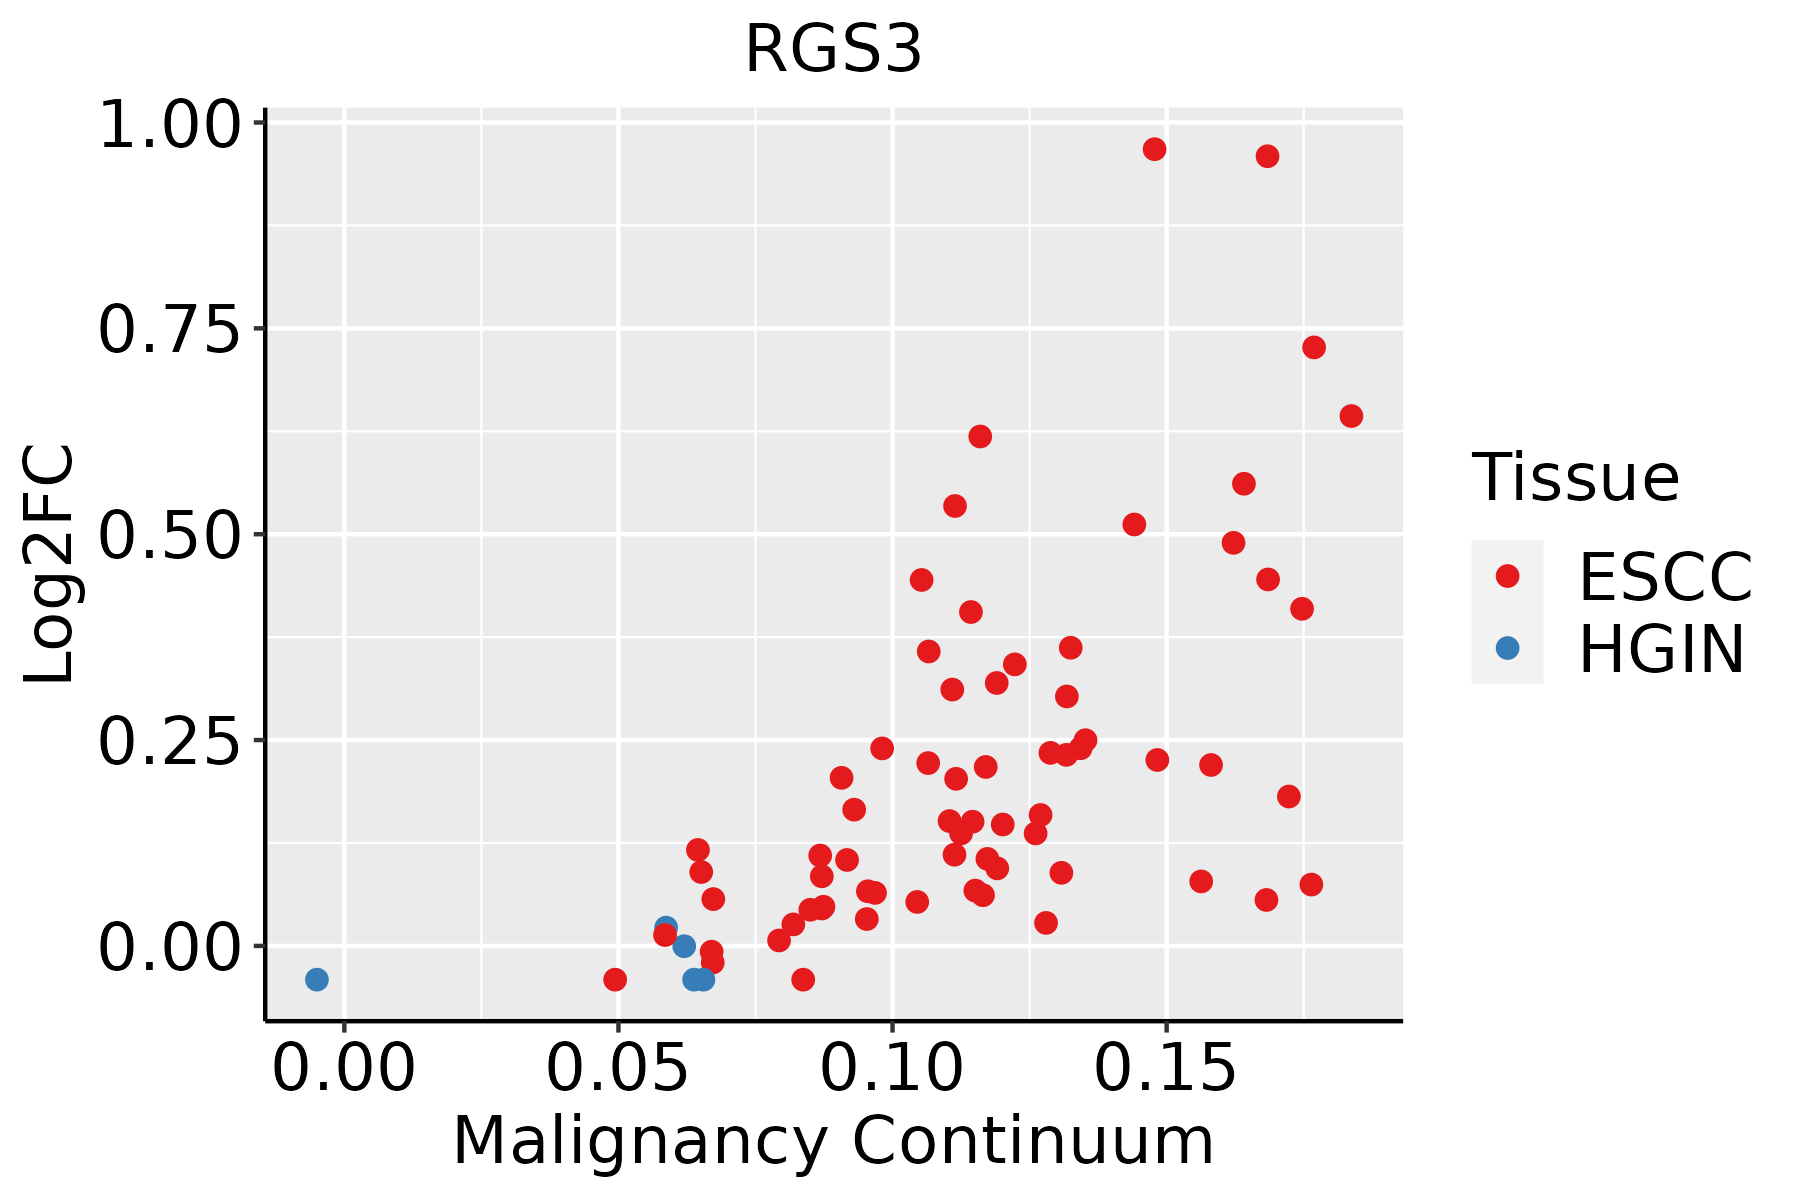 | ESCC: Esophageal squamous cell carcinoma |
| HGIN: High-grade intraepithelial neoplasias | ||
| LGIN: Low-grade intraepithelial neoplasias | ||
| Liver | 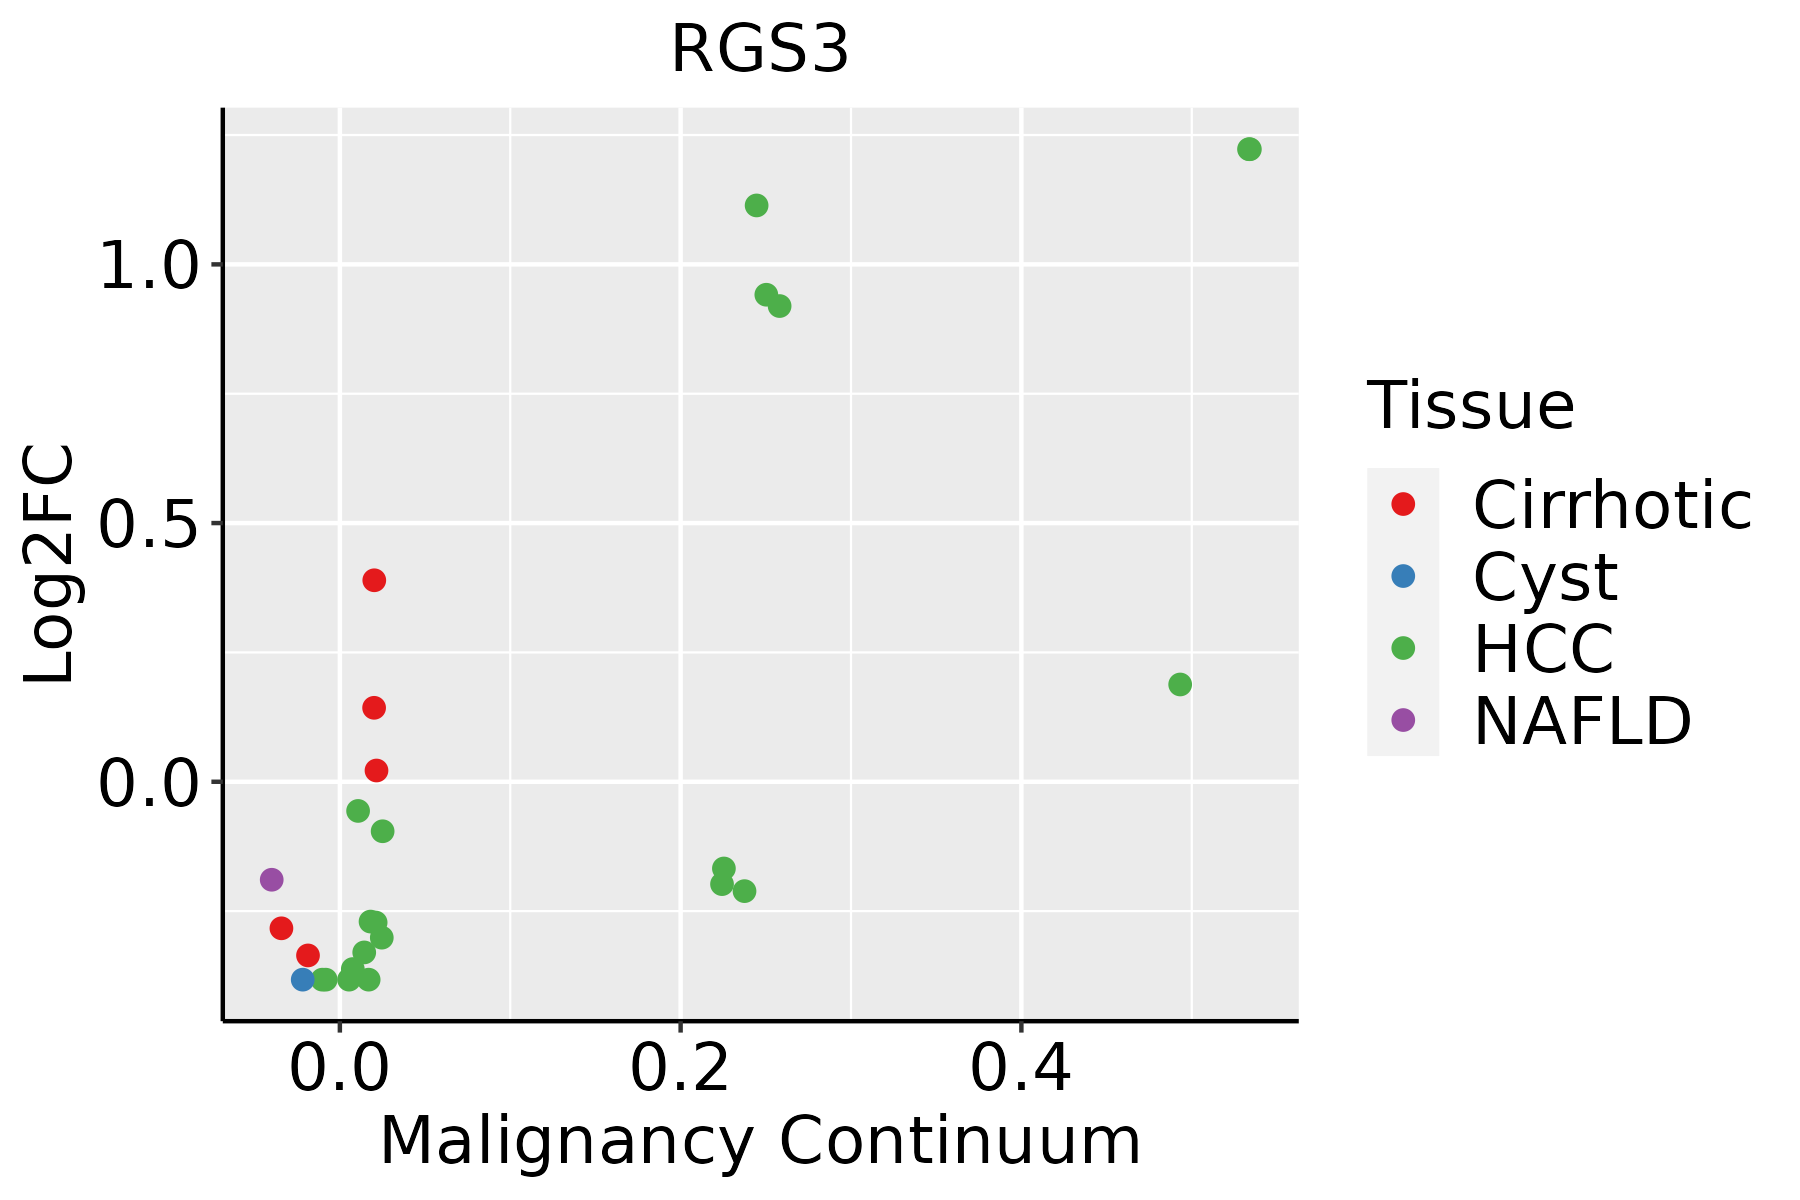 | HCC: Hepatocellular carcinoma |
| NAFLD: Non-alcoholic fatty liver disease | ||
| Oral Cavity | 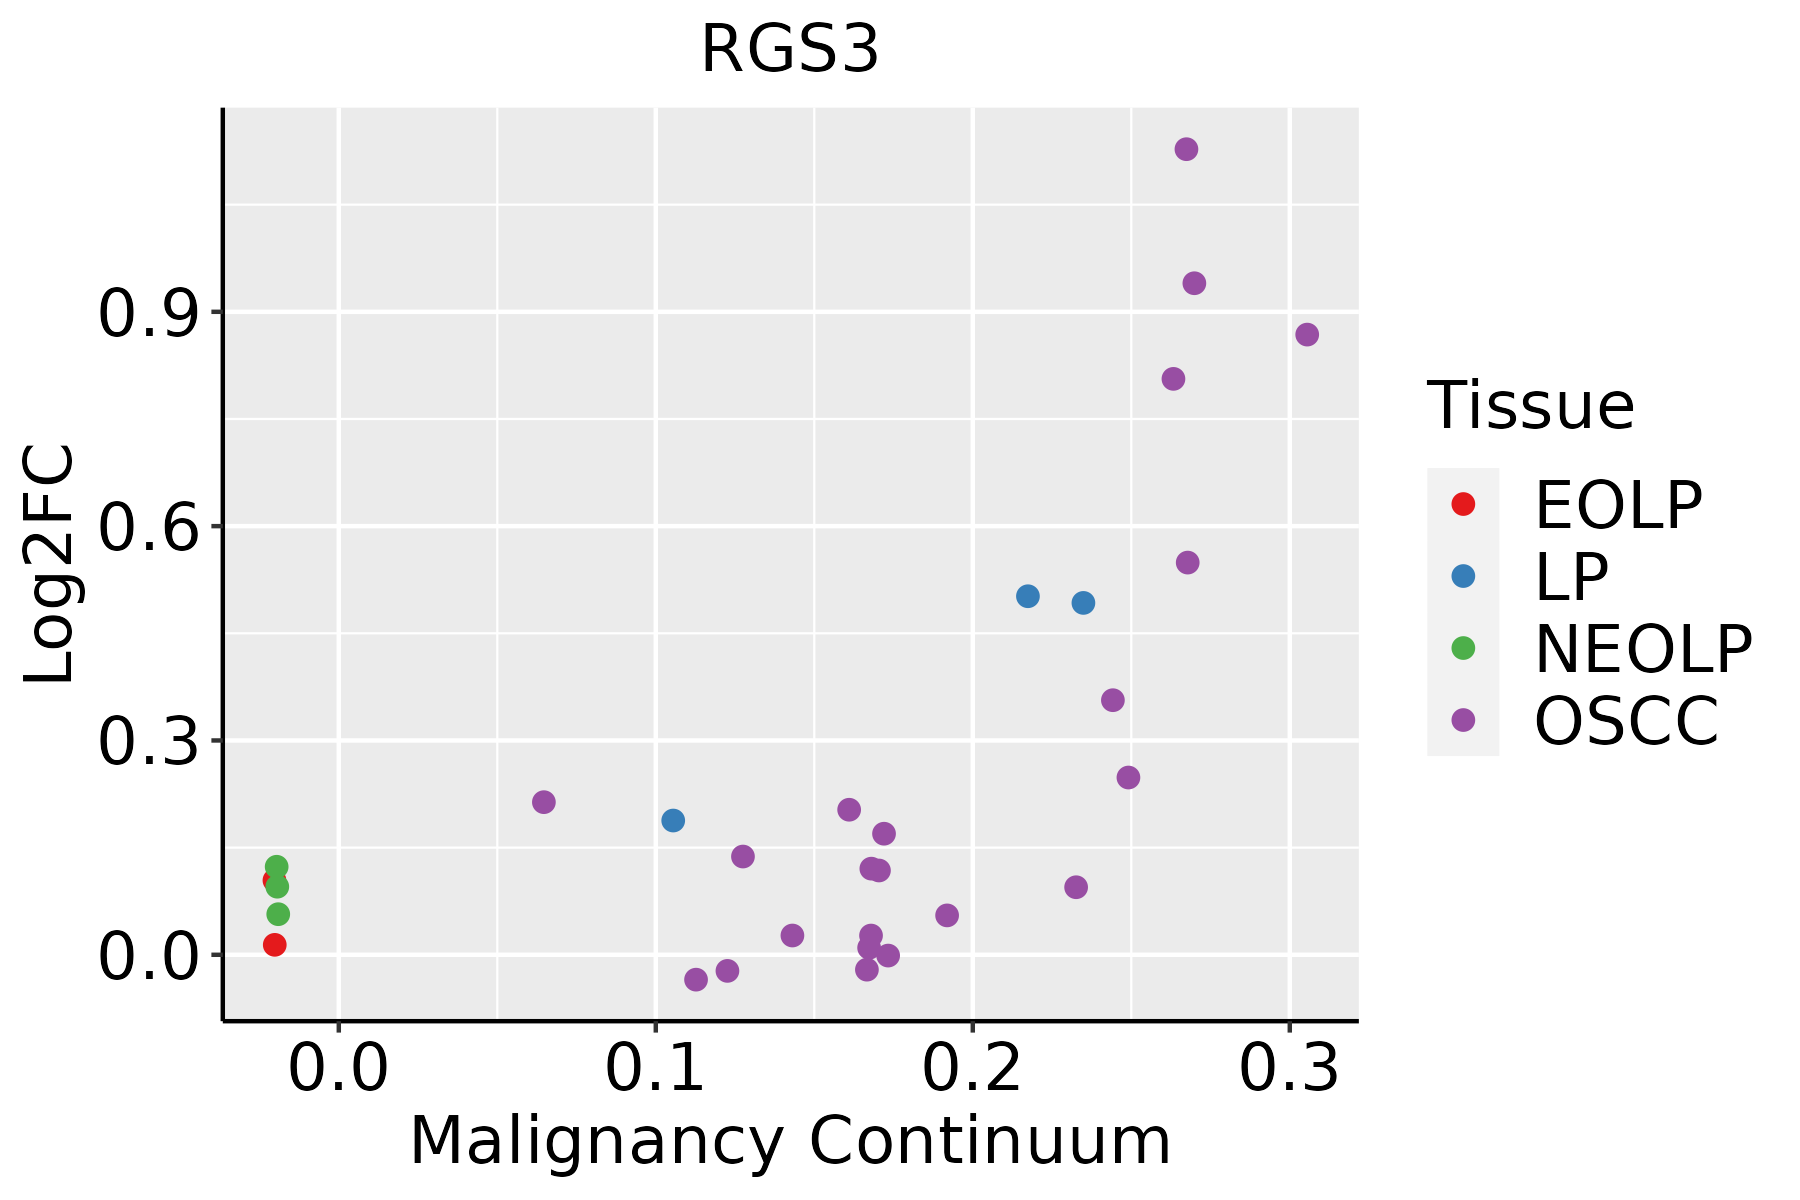 | EOLP: Erosive Oral lichen planus |
| LP: leukoplakia | ||
| NEOLP: Non-erosive oral lichen planus | ||
| OSCC: Oral squamous cell carcinoma | ||
| Thyroid | 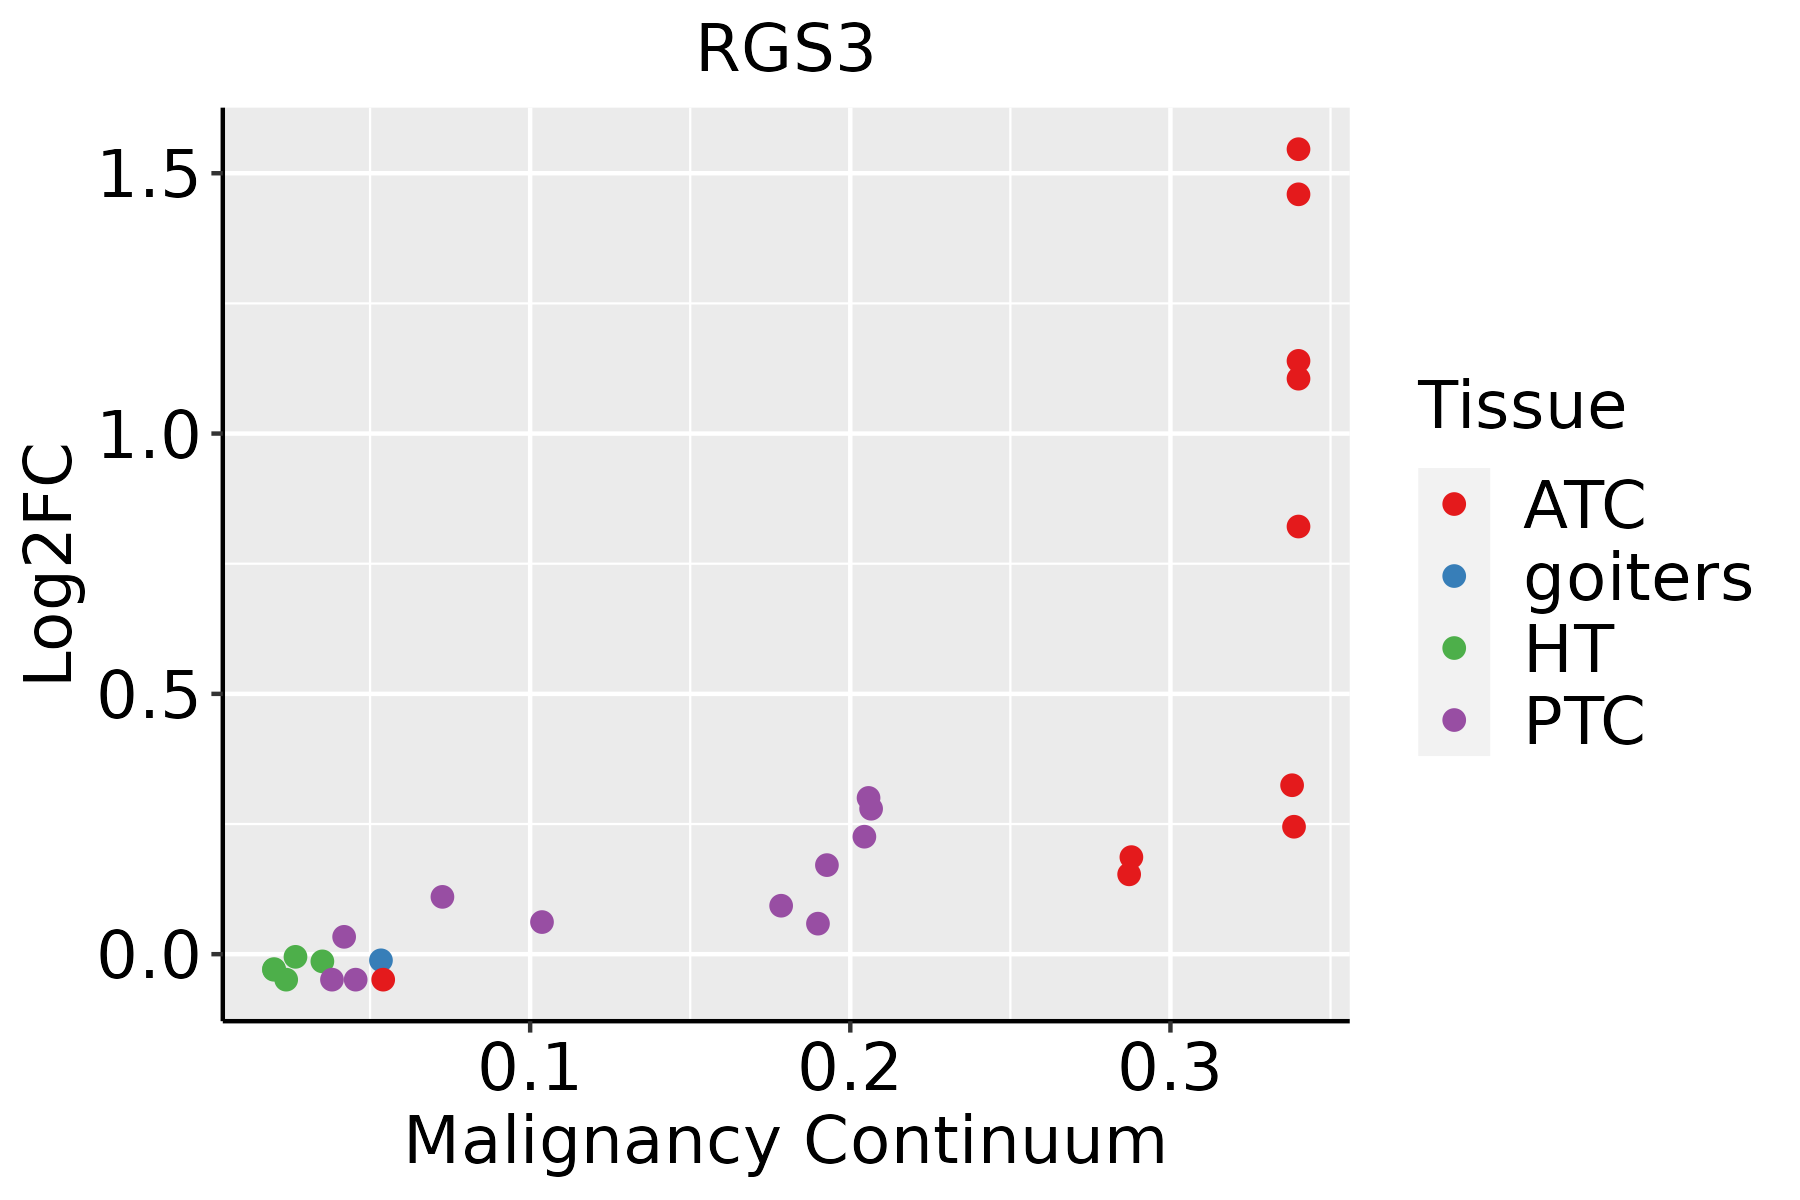 | ATC: Anaplastic thyroid cancer |
| HT: Hashimoto's thyroiditis | ||
| PTC: Papillary thyroid cancer |
| ∗log2FC in expression of this searched gene in stem-like cells from each diseased tissue sample relative to stem-like cells in normal samples in each tissue plotted against the malignancy continuum. Samples are colored based on if they are from different disease stage. |
Top |
Malignant transformation related pathway analysis |
| Find out the enriched GO biological processes and KEGG pathways involved in transition from healthy to precancer to cancer |
| Tissue | Disease Stage | Enriched GO biological Processes |
| Colorectum | AD |  |
| Colorectum | SER |  |
| Colorectum | MSS |  |
| Colorectum | MSI-H |  |
| Colorectum | FAP |  |
| ∗Top 15 enriched GO BP terms are showed in the bar plot of each disease state in each tissue. Each row represents a significant GO biological process which is colored according to the -log10(p.adjust). |
| Page: 1 2 3 4 5 6 7 8 9 |
| GO ID | Tissue | Disease Stage | Description | Gene Ratio | Bg Ratio | pvalue | p.adjust | Count |
| Page: 1 |
| Pathway ID | Tissue | Disease Stage | Description | Gene Ratio | Bg Ratio | pvalue | p.adjust | qvalue | Count |
| hsa04360 | Colorectum | AD | Axon guidance | 61/2092 | 182/8465 | 4.36e-03 | 2.17e-02 | 1.38e-02 | 61 |
| hsa043601 | Colorectum | AD | Axon guidance | 61/2092 | 182/8465 | 4.36e-03 | 2.17e-02 | 1.38e-02 | 61 |
| hsa043604 | Colorectum | FAP | Axon guidance | 47/1404 | 182/8465 | 9.09e-04 | 5.20e-03 | 3.16e-03 | 47 |
| hsa043605 | Colorectum | FAP | Axon guidance | 47/1404 | 182/8465 | 9.09e-04 | 5.20e-03 | 3.16e-03 | 47 |
| hsa0436016 | Esophagus | ESCC | Axon guidance | 108/4205 | 182/8465 | 5.13e-03 | 1.30e-02 | 6.67e-03 | 108 |
| hsa0436017 | Esophagus | ESCC | Axon guidance | 108/4205 | 182/8465 | 5.13e-03 | 1.30e-02 | 6.67e-03 | 108 |
| hsa0436014 | Oral cavity | OSCC | Axon guidance | 97/3704 | 182/8465 | 5.59e-03 | 1.33e-02 | 6.76e-03 | 97 |
| hsa0436015 | Oral cavity | OSCC | Axon guidance | 97/3704 | 182/8465 | 5.59e-03 | 1.33e-02 | 6.76e-03 | 97 |
| Page: 1 |
Top |
Cell-cell communication analysis |
| Identification of potential cell-cell interactions between two cell types and their ligand-receptor pairs for different disease states |
| Ligand | Receptor | LRpair | Pathway | Tissue | Disease Stage |
| Page: 1 |
Top |
Single-cell gene regulatory network inference analysis |
| Find out the significant the regulons (TFs) and the target genes of each regulon across cell types for different disease states |
| TF | Cell Type | Tissue | Disease Stage | Target Gene | RSS | Regulon Activity |
| ∗The dot plots of a searched regulon are shown for all cell subpopulations in each disease state of each tissue based on the regulon specific score inferred using pySCENIC and by calculating the average expression. |
| Page: 1 |
Top |
Somatic mutation of malignant transformation related genes |
| Annotation of somatic variants for genes involved in malignant transformation |
| Hugo Symbol | Variant Class | Variant Classification | dbSNP RS | HGVSc | HGVSp | HGVSp Short | SWISSPROT | BIOTYPE | SIFT | PolyPhen | Tumor Sample Barcode | Tissue | Histology | Sex | Age | Stage | Therapy Types | Drugs | Outcome |
| RGS3 | SNV | Missense_Mutation | novel | c.560A>T | p.His187Leu | p.H187L | P49796 | protein_coding | deleterious(0.05) | benign(0) | TCGA-A1-A0SQ-01 | Breast | breast invasive carcinoma | Female | <65 | I/II | Chemotherapy | ac | SD |
| RGS3 | SNV | Missense_Mutation | c.1097N>A | p.Ser366Asn | p.S366N | P49796 | protein_coding | tolerated(0.38) | benign(0.031) | TCGA-BH-A0HF-01 | Breast | breast invasive carcinoma | Female | >=65 | I/II | Hormone Therapy | arimidex | SD | |
| RGS3 | SNV | Missense_Mutation | rs200679819 | c.676N>C | p.Ala226Pro | p.A226P | P49796 | protein_coding | tolerated(0.23) | possibly_damaging(0.908) | TCGA-BH-A0HU-01 | Breast | breast invasive carcinoma | Female | <65 | I/II | Chemotherapy | docetaxel | SD |
| RGS3 | SNV | Missense_Mutation | c.3491A>G | p.Gln1164Arg | p.Q1164R | P49796 | protein_coding | deleterious(0) | probably_damaging(0.999) | TCGA-BH-A1EX-01 | Breast | breast invasive carcinoma | Female | >=65 | I/II | Unknown | Unknown | PD | |
| RGS3 | SNV | Missense_Mutation | rs200679819 | c.676N>C | p.Ala226Pro | p.A226P | P49796 | protein_coding | tolerated(0.23) | possibly_damaging(0.908) | TCGA-D8-A1JI-01 | Breast | breast invasive carcinoma | Female | <65 | I/II | Chemotherapy | doxorubicine | SD |
| RGS3 | SNV | Missense_Mutation | c.2668N>A | p.Glu890Lys | p.E890K | P49796 | protein_coding | deleterious(0.01) | possibly_damaging(0.874) | TCGA-E2-A1B4-01 | Breast | breast invasive carcinoma | Female | >=65 | III/IV | Hormone Therapy | arimidex | SD | |
| RGS3 | SNV | Missense_Mutation | rs201175305 | c.110N>G | p.Asn37Ser | p.N37S | P49796 | protein_coding | tolerated_low_confidence(0.57) | benign(0) | TCGA-E9-A1R7-01 | Breast | breast invasive carcinoma | Female | <65 | I/II | Hormone Therapy | fareston | SD |
| RGS3 | SNV | Missense_Mutation | rs200679819 | c.676N>C | p.Ala226Pro | p.A226P | P49796 | protein_coding | tolerated(0.23) | possibly_damaging(0.908) | TCGA-E9-A22A-01 | Breast | breast invasive carcinoma | Female | >=65 | I/II | Hormone Therapy | tamoxiphen | SD |
| RGS3 | deletion | Frame_Shift_Del | novel | c.2501delN | p.Met834ArgfsTer7 | p.M834Rfs*7 | P49796 | protein_coding | TCGA-D8-A27V-01 | Breast | breast invasive carcinoma | Female | <65 | I/II | Hormone Therapy | tamoxiphen | SD | ||
| RGS3 | SNV | Missense_Mutation | rs772200505 | c.1169N>A | p.Arg390Gln | p.R390Q | P49796 | protein_coding | deleterious(0.05) | probably_damaging(0.941) | TCGA-2W-A8YY-01 | Cervix | cervical & endocervical cancer | Female | <65 | I/II | Chemotherapy | cisplatin | CR |
| Page: 1 2 3 4 5 6 7 8 9 10 11 12 13 |
Top |
Related drugs of malignant transformation related genes |
| Identification of chemicals and drugs interact with genes involved in malignant transfromation |
| (DGIdb 4.0) |
| Entrez ID | Symbol | Category | Interaction Types | Drug Claim Name | Drug Name | PMIDs |
| Page: 1 |

Copyright 2023-Present -The University of Texas Health Science Center at Houston |