
|
|||||
|
 | |
| |
| |
| |
| |
| |
|
Gene: RGS20 |
Gene summary for RGS20 |
| Gene information | Species | Human | Gene symbol | RGS20 | Gene ID | 8601 |
| Gene name | regulator of G protein signaling 20 | |
| Gene Alias | RGSZ1 | |
| Cytomap | 8q11.23 | |
| Gene Type | protein-coding | GO ID | GO:0007154 | UniProtAcc | O76081 |
Top |
Malignant transformation analysis |
| Identification of the aberrant gene expression in precancerous and cancerous lesions by comparing the gene expression of stem-like cells in diseased tissues with normal stem cells |
| Entrez ID | Symbol | Replicates | Species | Organ | Tissue | Adj P-value | Log2FC | Malignancy |
| 8601 | RGS20 | LZE4T | Human | Esophagus | ESCC | 2.31e-02 | 2.18e-01 | 0.0811 |
| 8601 | RGS20 | P9T-E | Human | Esophagus | ESCC | 1.39e-02 | 8.65e-02 | 0.1131 |
| 8601 | RGS20 | P17T-E | Human | Esophagus | ESCC | 7.80e-04 | 2.85e-01 | 0.1278 |
| 8601 | RGS20 | P21T-E | Human | Esophagus | ESCC | 1.13e-18 | 5.53e-01 | 0.1617 |
| 8601 | RGS20 | P22T-E | Human | Esophagus | ESCC | 3.38e-04 | 7.92e-02 | 0.1236 |
| 8601 | RGS20 | P24T-E | Human | Esophagus | ESCC | 4.18e-10 | 2.88e-01 | 0.1287 |
| 8601 | RGS20 | P30T-E | Human | Esophagus | ESCC | 5.34e-06 | 3.41e-01 | 0.137 |
| 8601 | RGS20 | P31T-E | Human | Esophagus | ESCC | 1.97e-13 | 2.78e-01 | 0.1251 |
| 8601 | RGS20 | P32T-E | Human | Esophagus | ESCC | 2.24e-08 | 2.11e-01 | 0.1666 |
| 8601 | RGS20 | P37T-E | Human | Esophagus | ESCC | 1.21e-03 | 1.30e-01 | 0.1371 |
| 8601 | RGS20 | P38T-E | Human | Esophagus | ESCC | 4.06e-04 | 4.22e-01 | 0.127 |
| 8601 | RGS20 | P42T-E | Human | Esophagus | ESCC | 1.04e-04 | 2.20e-01 | 0.1175 |
| 8601 | RGS20 | P49T-E | Human | Esophagus | ESCC | 3.89e-12 | 1.15e+00 | 0.1768 |
| 8601 | RGS20 | P52T-E | Human | Esophagus | ESCC | 3.59e-06 | 2.23e-01 | 0.1555 |
| 8601 | RGS20 | P62T-E | Human | Esophagus | ESCC | 1.11e-06 | 2.32e-01 | 0.1302 |
| 8601 | RGS20 | P75T-E | Human | Esophagus | ESCC | 1.34e-04 | 1.67e-01 | 0.1125 |
| 8601 | RGS20 | P79T-E | Human | Esophagus | ESCC | 1.29e-05 | 2.27e-01 | 0.1154 |
| 8601 | RGS20 | P83T-E | Human | Esophagus | ESCC | 4.39e-08 | 4.12e-01 | 0.1738 |
| 8601 | RGS20 | P89T-E | Human | Esophagus | ESCC | 1.73e-21 | 1.18e+00 | 0.1752 |
| 8601 | RGS20 | P91T-E | Human | Esophagus | ESCC | 5.03e-03 | 4.64e-01 | 0.1828 |
| Page: 1 2 |
| Tissue | Expression Dynamics | Abbreviation |
| Esophagus | 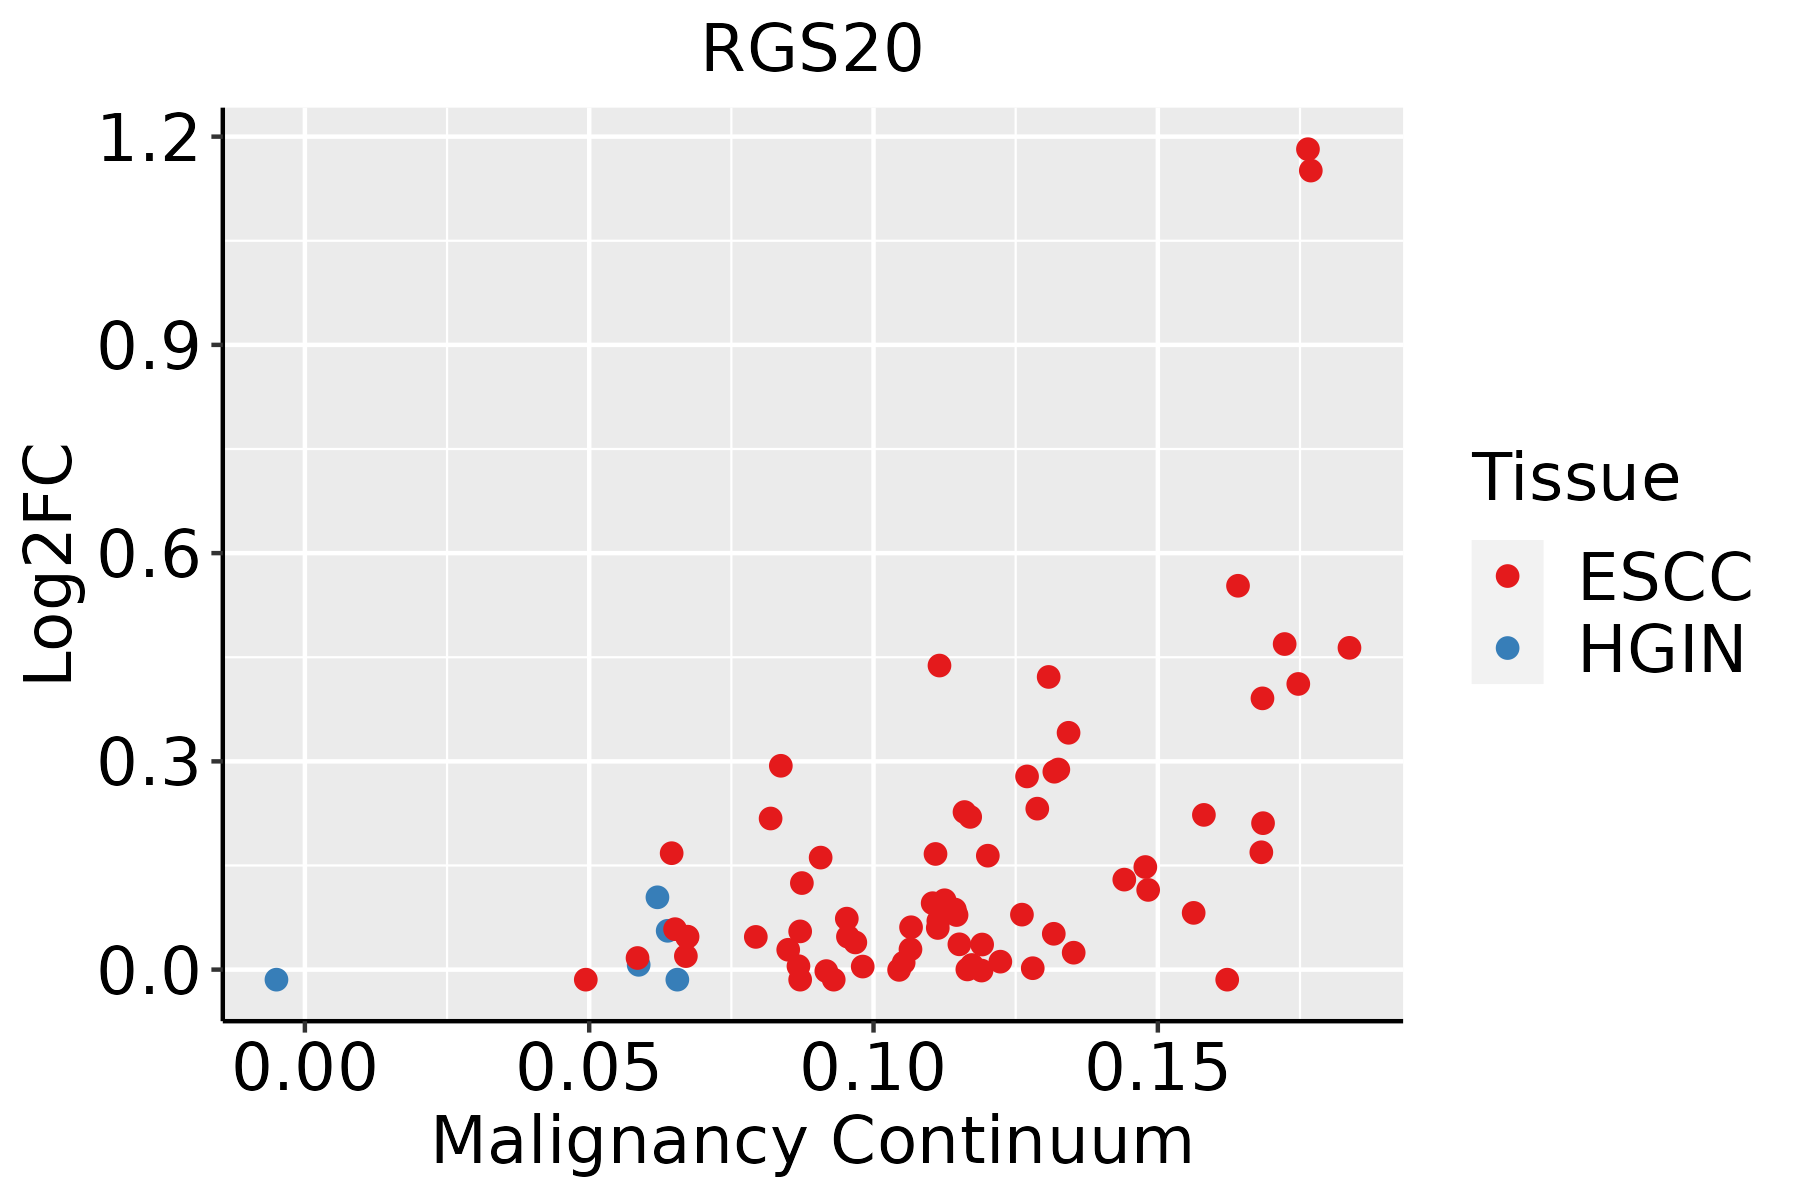 | ESCC: Esophageal squamous cell carcinoma |
| HGIN: High-grade intraepithelial neoplasias | ||
| LGIN: Low-grade intraepithelial neoplasias | ||
| Oral Cavity | 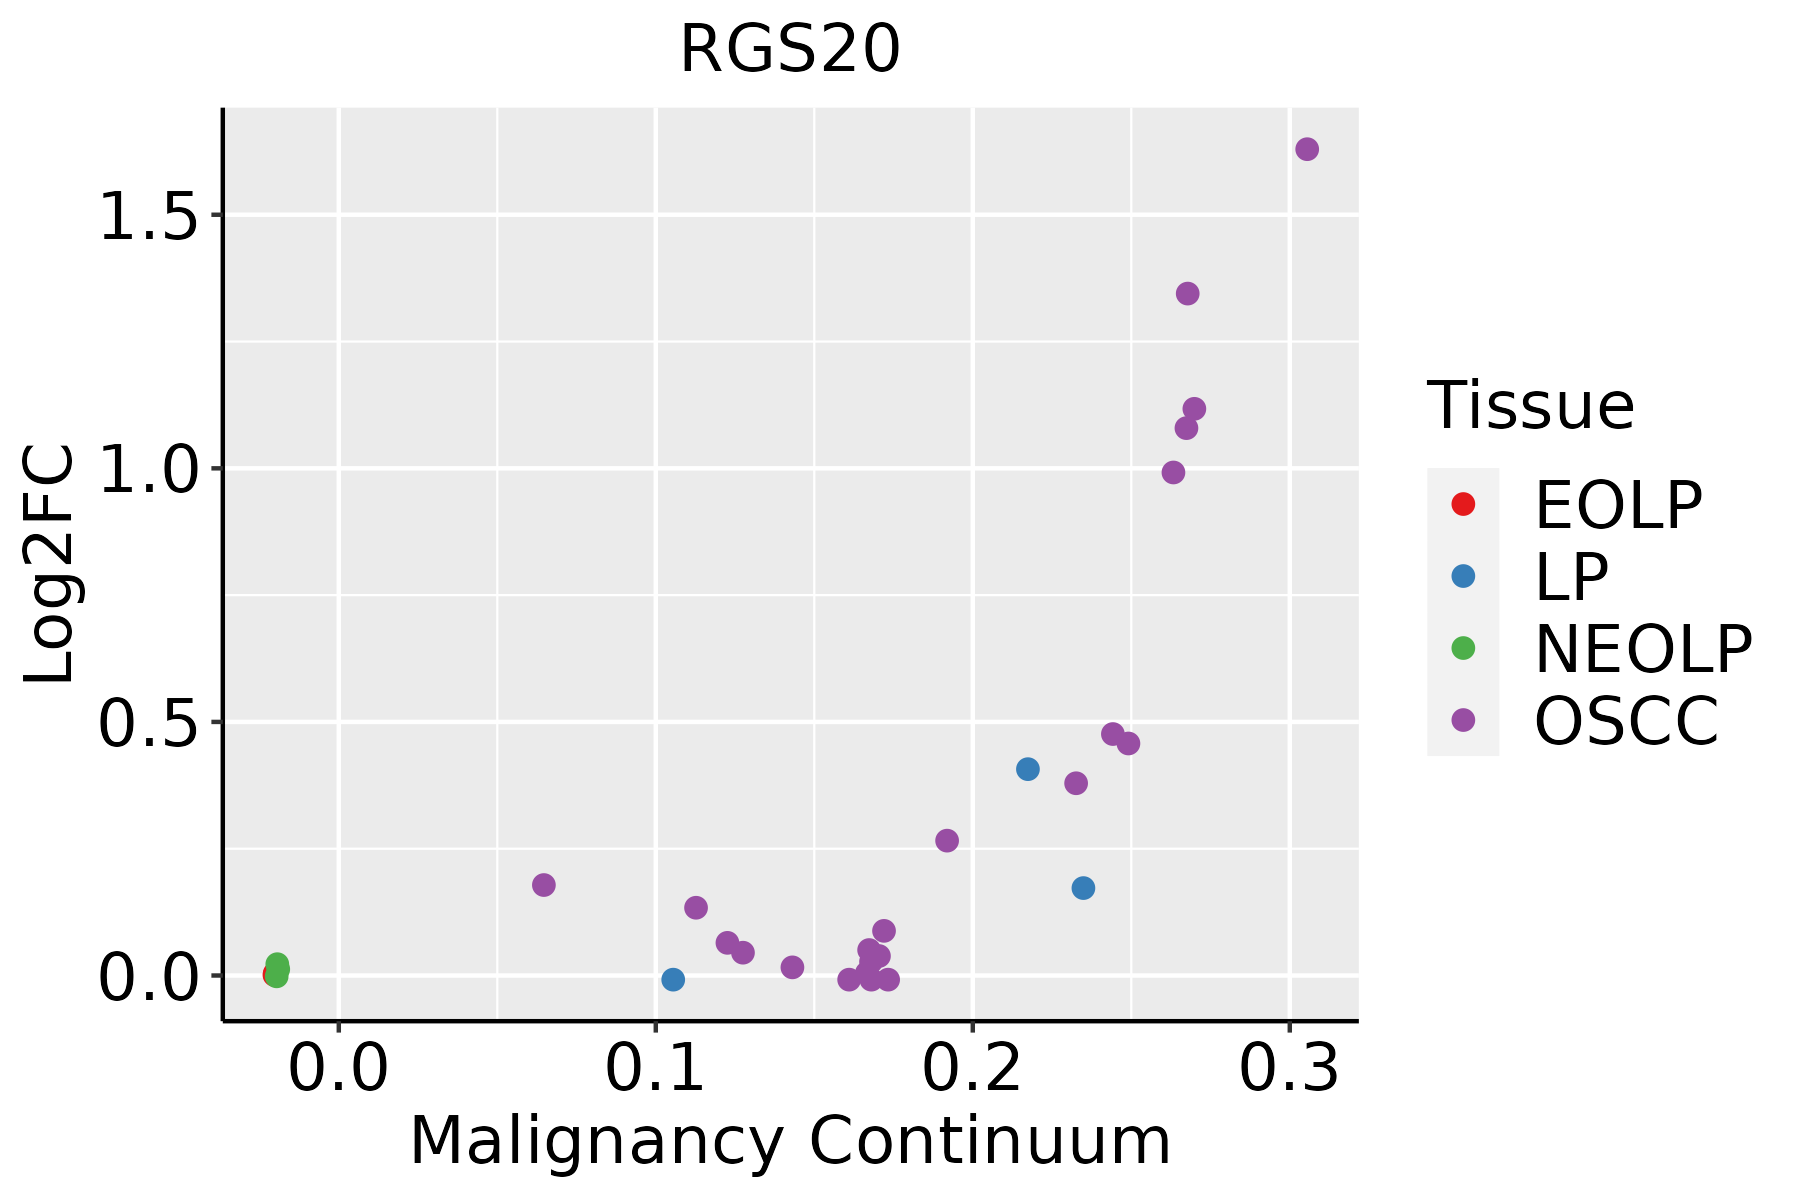 | EOLP: Erosive Oral lichen planus |
| LP: leukoplakia | ||
| NEOLP: Non-erosive oral lichen planus | ||
| OSCC: Oral squamous cell carcinoma |
| ∗log2FC in expression of this searched gene in stem-like cells from each diseased tissue sample relative to stem-like cells in normal samples in each tissue plotted against the malignancy continuum. Samples are colored based on if they are from different disease stage. |
Top |
Malignant transformation related pathway analysis |
| Find out the enriched GO biological processes and KEGG pathways involved in transition from healthy to precancer to cancer |
| Tissue | Disease Stage | Enriched GO biological Processes |
| Colorectum | AD |  |
| Colorectum | SER |  |
| Colorectum | MSS |  |
| Colorectum | MSI-H |  |
| Colorectum | FAP |  |
| ∗Top 15 enriched GO BP terms are showed in the bar plot of each disease state in each tissue. Each row represents a significant GO biological process which is colored according to the -log10(p.adjust). |
| Page: 1 2 3 4 5 6 7 8 9 |
| GO ID | Tissue | Disease Stage | Description | Gene Ratio | Bg Ratio | pvalue | p.adjust | Count |
| Page: 1 |
| Pathway ID | Tissue | Disease Stage | Description | Gene Ratio | Bg Ratio | pvalue | p.adjust | qvalue | Count |
| Page: 1 |
Top |
Cell-cell communication analysis |
| Identification of potential cell-cell interactions between two cell types and their ligand-receptor pairs for different disease states |
| Ligand | Receptor | LRpair | Pathway | Tissue | Disease Stage |
| Page: 1 |
Top |
Single-cell gene regulatory network inference analysis |
| Find out the significant the regulons (TFs) and the target genes of each regulon across cell types for different disease states |
| TF | Cell Type | Tissue | Disease Stage | Target Gene | RSS | Regulon Activity |
| ∗The dot plots of a searched regulon are shown for all cell subpopulations in each disease state of each tissue based on the regulon specific score inferred using pySCENIC and by calculating the average expression. |
| Page: 1 |
Top |
Somatic mutation of malignant transformation related genes |
| Annotation of somatic variants for genes involved in malignant transformation |
| Hugo Symbol | Variant Class | Variant Classification | dbSNP RS | HGVSc | HGVSp | HGVSp Short | SWISSPROT | BIOTYPE | SIFT | PolyPhen | Tumor Sample Barcode | Tissue | Histology | Sex | Age | Stage | Therapy Types | Drugs | Outcome |
| RGS20 | SNV | Missense_Mutation | novel | c.478N>A | p.Asp160Asn | p.D160N | O76081 | protein_coding | deleterious_low_confidence(0) | possibly_damaging(0.461) | TCGA-5L-AAT1-01 | Breast | breast invasive carcinoma | Female | <65 | III/IV | Hormone Therapy | letrozol | SD |
| RGS20 | SNV | Missense_Mutation | novel | c.719C>A | p.Ala240Glu | p.A240E | O76081 | protein_coding | tolerated(0.75) | benign(0) | TCGA-A8-A06U-01 | Breast | breast invasive carcinoma | Female | >=65 | I/II | Unknown | Unknown | SD |
| RGS20 | SNV | Missense_Mutation | c.925N>C | p.Glu309Gln | p.E309Q | O76081 | protein_coding | deleterious(0.02) | possibly_damaging(0.552) | TCGA-A8-A075-01 | Breast | breast invasive carcinoma | Female | <65 | I/II | Chemotherapy | epirubicin | CR | |
| RGS20 | SNV | Missense_Mutation | rs752979708 | c.842N>A | p.Arg281Gln | p.R281Q | O76081 | protein_coding | deleterious(0.02) | possibly_damaging(0.856) | TCGA-AN-A046-01 | Breast | breast invasive carcinoma | Female | >=65 | I/II | Unknown | Unknown | SD |
| RGS20 | SNV | Missense_Mutation | c.217N>A | p.Gly73Ser | p.G73S | O76081 | protein_coding | tolerated_low_confidence(1) | benign(0.003) | TCGA-AR-A0TS-01 | Breast | breast invasive carcinoma | Female | <65 | I/II | Chemotherapy | doxorubicin | SD | |
| RGS20 | SNV | Missense_Mutation | novel | c.549N>C | p.Gln183His | p.Q183H | O76081 | protein_coding | deleterious(0) | probably_damaging(0.935) | TCGA-OL-A5RW-01 | Breast | breast invasive carcinoma | Female | <65 | I/II | Chemotherapy | adriamycin | CR |
| RGS20 | SNV | Missense_Mutation | novel | c.149N>T | p.Ala50Val | p.A50V | O76081 | protein_coding | tolerated_low_confidence(0.13) | benign(0.003) | TCGA-2W-A8YY-01 | Cervix | cervical & endocervical cancer | Female | <65 | I/II | Chemotherapy | cisplatin | CR |
| RGS20 | SNV | Missense_Mutation | novel | c.415N>A | p.Gly139Ser | p.G139S | O76081 | protein_coding | tolerated_low_confidence(0.09) | benign(0.003) | TCGA-2W-A8YY-01 | Cervix | cervical & endocervical cancer | Female | <65 | I/II | Chemotherapy | cisplatin | CR |
| RGS20 | SNV | Missense_Mutation | c.1003N>C | p.Glu335Gln | p.E335Q | O76081 | protein_coding | deleterious(0.01) | possibly_damaging(0.833) | TCGA-EK-A3GK-01 | Cervix | cervical & endocervical cancer | Female | <65 | I/II | Unknown | Unknown | SD | |
| RGS20 | deletion | Frame_Shift_Del | novel | c.281delC | p.Pro94LeufsTer54 | p.P94Lfs*54 | O76081 | protein_coding | TCGA-EA-A410-01 | Cervix | cervical & endocervical cancer | Female | <65 | I/II | Unknown | Unknown | SD |
| Page: 1 2 3 4 5 6 |
Top |
Related drugs of malignant transformation related genes |
| Identification of chemicals and drugs interact with genes involved in malignant transfromation |
| (DGIdb 4.0) |
| Entrez ID | Symbol | Category | Interaction Types | Drug Claim Name | Drug Name | PMIDs |
| Page: 1 |

Copyright 2023-Present -The University of Texas Health Science Center at Houston |