
|
|||||
|
 | |
| |
| |
| |
| |
| |
|
Gene: RGS17 |
Gene summary for RGS17 |
| Gene information | Species | Human | Gene symbol | RGS17 | Gene ID | 26575 |
| Gene name | regulator of G protein signaling 17 | |
| Gene Alias | RGS-17 | |
| Cytomap | 6q25.2 | |
| Gene Type | protein-coding | GO ID | GO:0001975 | UniProtAcc | Q9UGC6 |
Top |
Malignant transformation analysis |
| Identification of the aberrant gene expression in precancerous and cancerous lesions by comparing the gene expression of stem-like cells in diseased tissues with normal stem cells |
| Entrez ID | Symbol | Replicates | Species | Organ | Tissue | Adj P-value | Log2FC | Malignancy |
| 26575 | RGS17 | RNA-P17T-P17T-2 | Human | Lung | IAC | 5.30e-08 | 7.45e-01 | 0.3371 |
| 26575 | RGS17 | RNA-P17T-P17T-4 | Human | Lung | IAC | 4.28e-05 | 6.41e-01 | 0.343 |
| 26575 | RGS17 | RNA-P17T-P17T-6 | Human | Lung | IAC | 4.71e-02 | 3.55e-01 | 0.3385 |
| 26575 | RGS17 | RNA-P17T-P17T-8 | Human | Lung | IAC | 5.44e-06 | 6.85e-01 | 0.3329 |
| 26575 | RGS17 | RNA-P7T1-P7T1-1 | Human | Lung | AIS | 1.36e-03 | 5.42e-01 | -0.0961 |
| 26575 | RGS17 | RNA-P7T1-P7T1-2 | Human | Lung | AIS | 2.97e-09 | 7.13e-01 | -0.0876 |
| 26575 | RGS17 | RNA-P7T1-P7T1-3 | Human | Lung | AIS | 2.97e-07 | 7.12e-01 | -0.0822 |
| 26575 | RGS17 | RNA-P7T1-P7T1-4 | Human | Lung | AIS | 2.35e-06 | 6.11e-01 | -0.0809 |
| 26575 | RGS17 | HTA12-15-2 | Human | Pancreas | PDAC | 5.82e-07 | 6.45e-01 | 0.2315 |
| 26575 | RGS17 | HTA12-23-1 | Human | Pancreas | PDAC | 1.40e-09 | 8.09e-01 | 0.3405 |
| 26575 | RGS17 | HTA12-25-1 | Human | Pancreas | PDAC | 4.31e-08 | 6.21e-01 | 0.313 |
| 26575 | RGS17 | HTA12-26-1 | Human | Pancreas | PDAC | 1.25e-21 | 1.04e+00 | 0.3728 |
| 26575 | RGS17 | HTA12-29-1 | Human | Pancreas | PDAC | 8.98e-63 | 1.25e+00 | 0.3722 |
| 26575 | RGS17 | HTA12-32-1 | Human | Pancreas | PDAC | 8.22e-05 | 1.06e+00 | 0.3624 |
| 26575 | RGS17 | ATC09 | Human | Thyroid | ATC | 3.41e-04 | 1.62e-01 | 0.2871 |
| 26575 | RGS17 | ATC11 | Human | Thyroid | ATC | 9.39e-06 | 4.92e-01 | 0.3386 |
| 26575 | RGS17 | ATC12 | Human | Thyroid | ATC | 2.02e-31 | 6.71e-01 | 0.34 |
| 26575 | RGS17 | ATC13 | Human | Thyroid | ATC | 1.05e-03 | 3.71e-02 | 0.34 |
| 26575 | RGS17 | ATC1 | Human | Thyroid | ATC | 4.99e-04 | 1.75e-01 | 0.2878 |
| 26575 | RGS17 | ATC3 | Human | Thyroid | ATC | 2.11e-13 | 6.36e-01 | 0.338 |
| Page: 1 2 |
| Tissue | Expression Dynamics | Abbreviation |
| Lung | 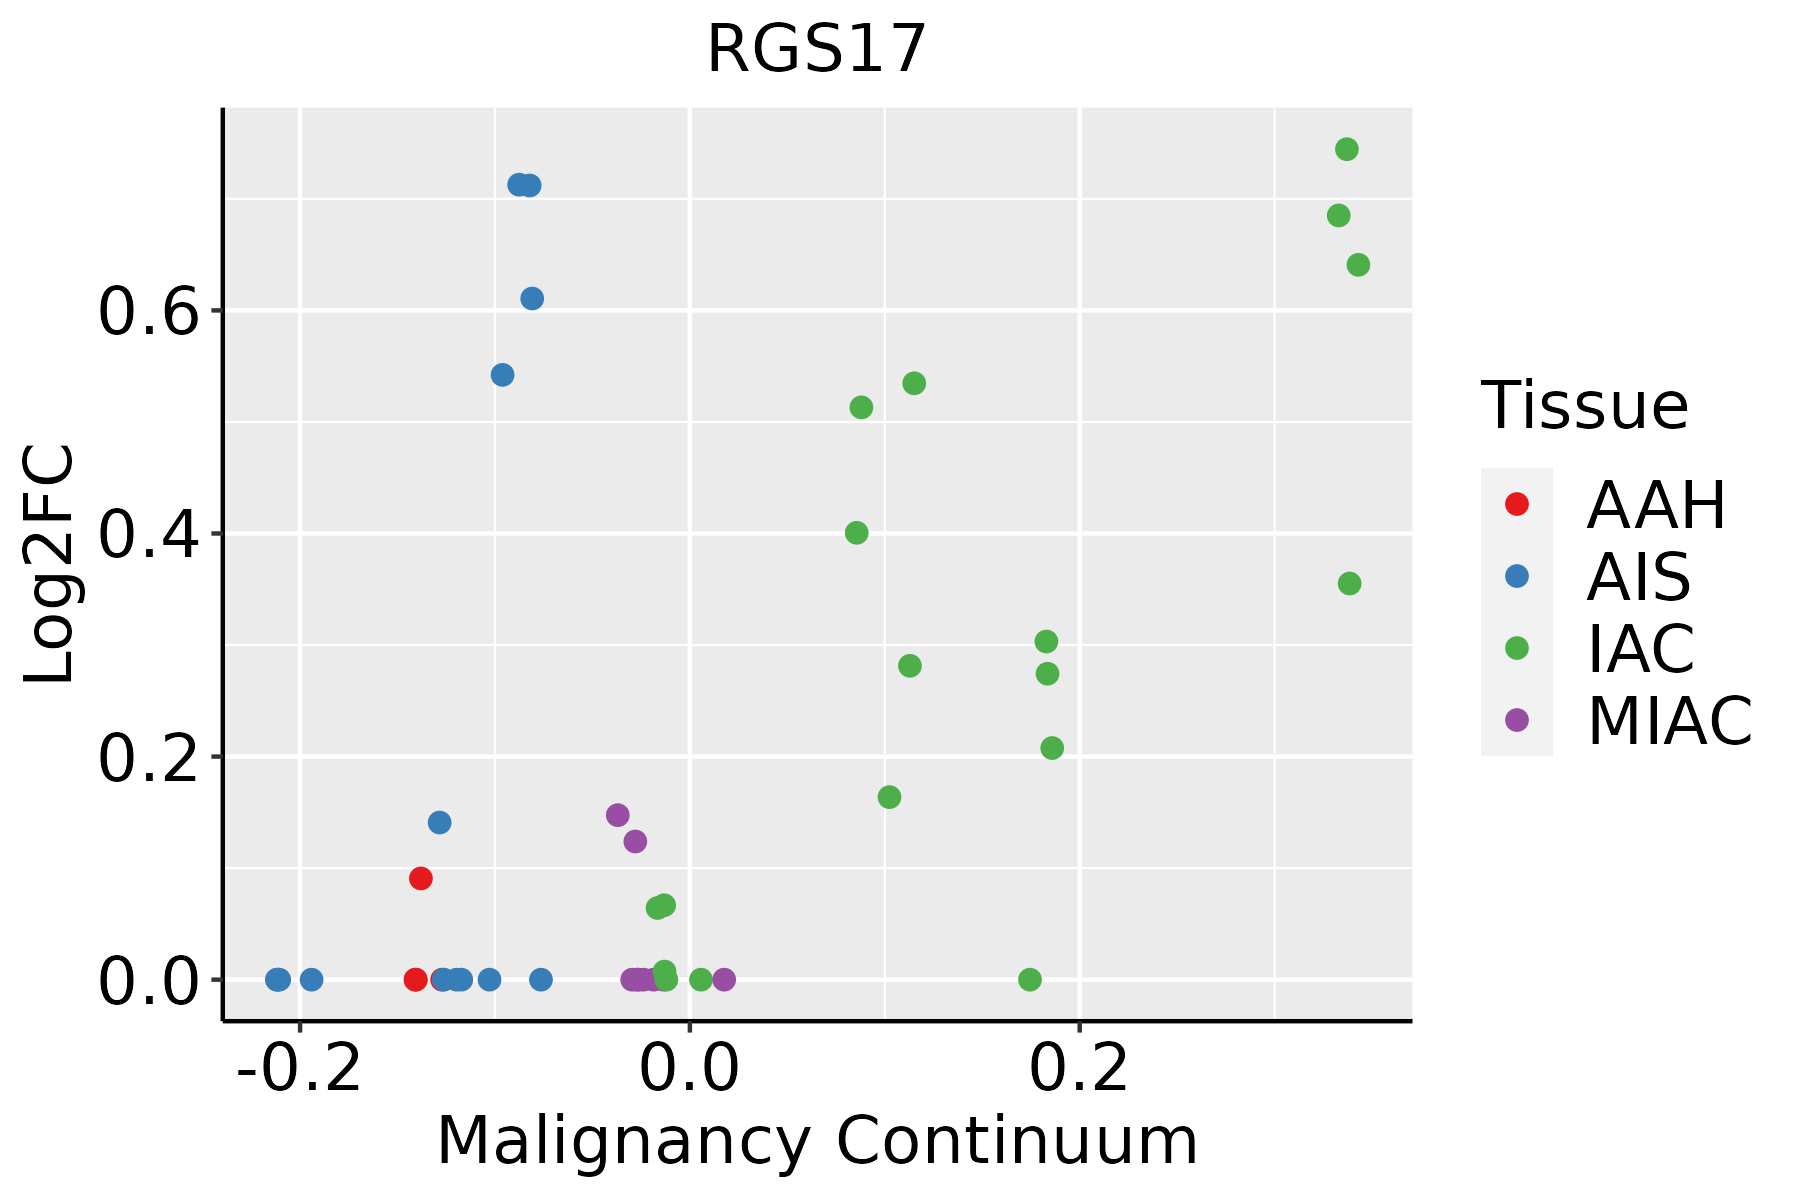 | AAH: Atypical adenomatous hyperplasia |
| AIS: Adenocarcinoma in situ | ||
| IAC: Invasive lung adenocarcinoma | ||
| MIA: Minimally invasive adenocarcinoma | ||
| Thyroid | 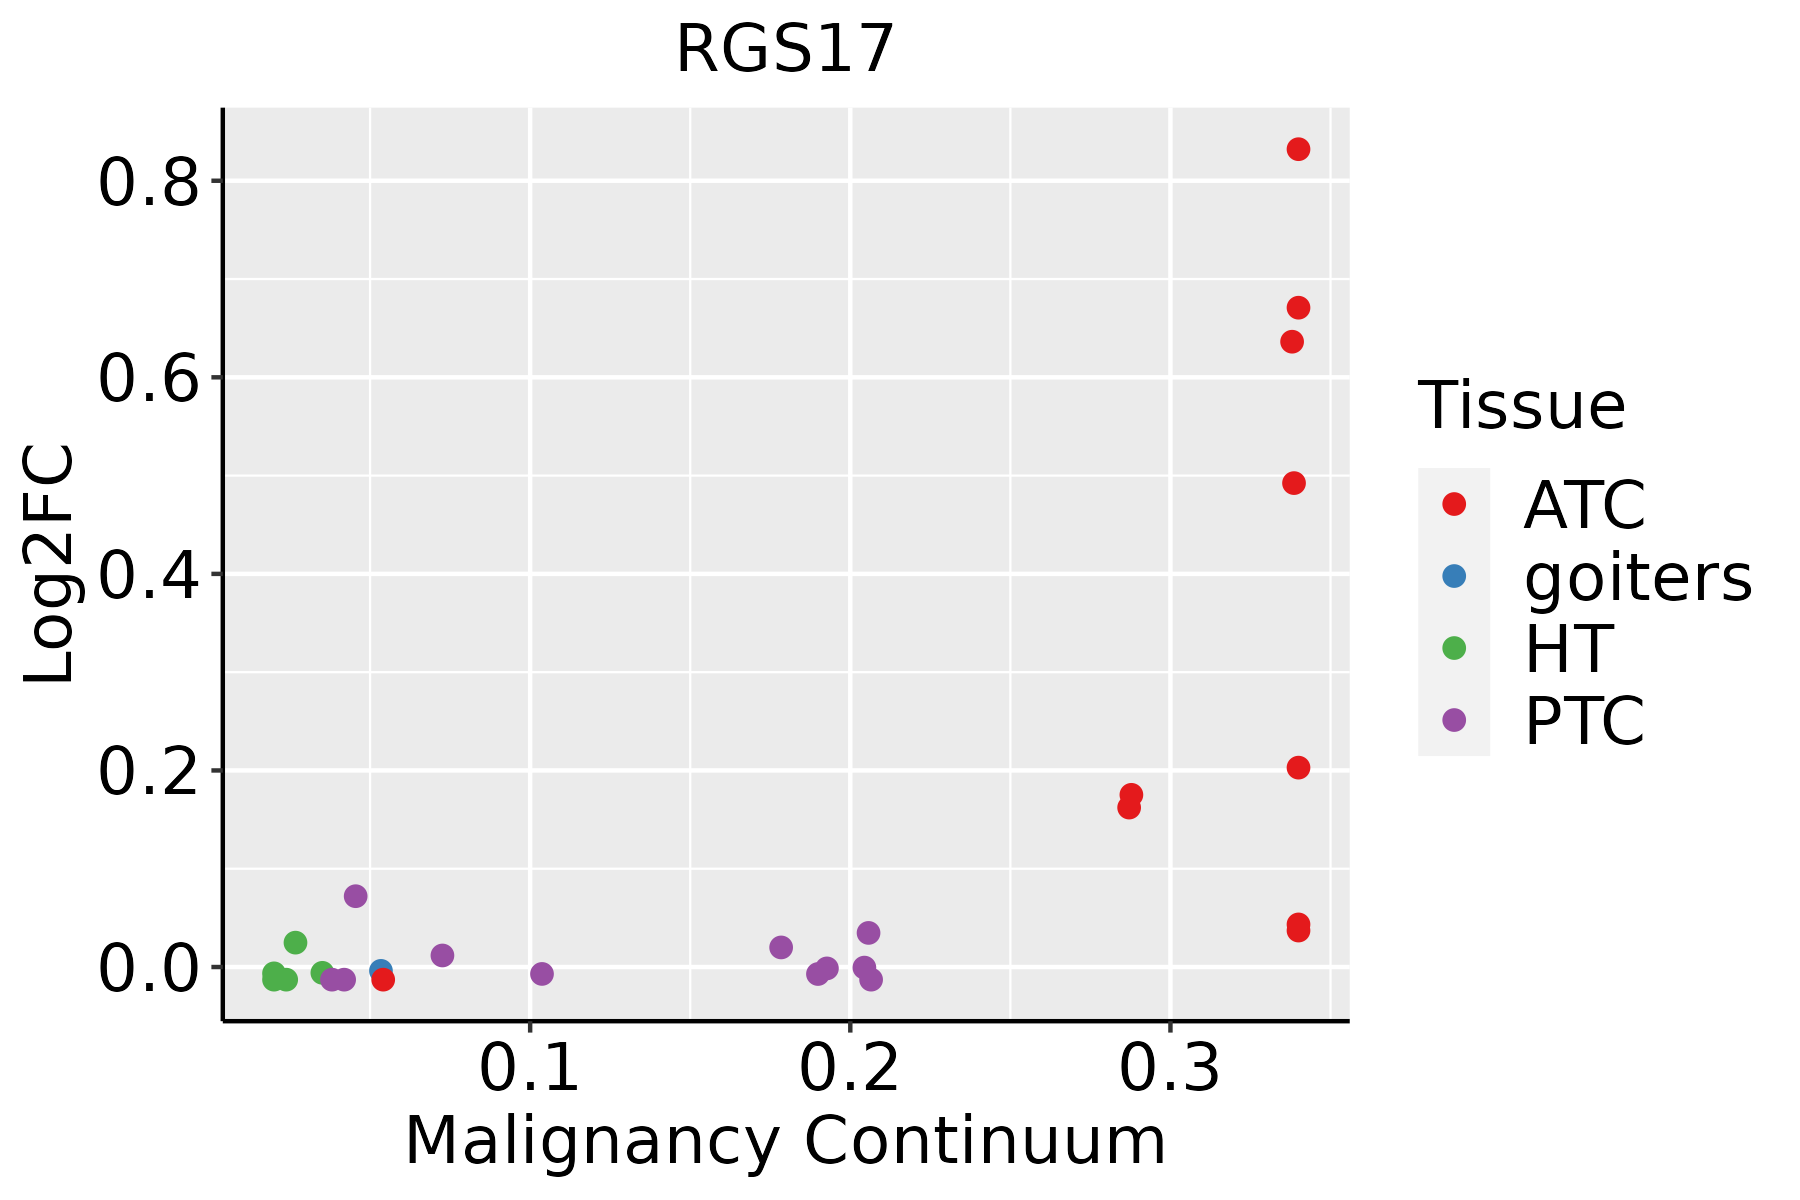 | ATC: Anaplastic thyroid cancer |
| HT: Hashimoto's thyroiditis | ||
| PTC: Papillary thyroid cancer |
| ∗log2FC in expression of this searched gene in stem-like cells from each diseased tissue sample relative to stem-like cells in normal samples in each tissue plotted against the malignancy continuum. Samples are colored based on if they are from different disease stage. |
Top |
Malignant transformation related pathway analysis |
| Find out the enriched GO biological processes and KEGG pathways involved in transition from healthy to precancer to cancer |
| Tissue | Disease Stage | Enriched GO biological Processes |
| Colorectum | AD |  |
| Colorectum | SER |  |
| Colorectum | MSS |  |
| Colorectum | MSI-H |  |
| Colorectum | FAP |  |
| ∗Top 15 enriched GO BP terms are showed in the bar plot of each disease state in each tissue. Each row represents a significant GO biological process which is colored according to the -log10(p.adjust). |
| Page: 1 2 3 4 5 6 7 8 9 |
| GO ID | Tissue | Disease Stage | Description | Gene Ratio | Bg Ratio | pvalue | p.adjust | Count |
| GO:00140757 | Thyroid | ATC | response to amine | 25/6293 | 49/18723 | 8.77e-03 | 3.33e-02 | 25 |
| Page: 1 |
| Pathway ID | Tissue | Disease Stage | Description | Gene Ratio | Bg Ratio | pvalue | p.adjust | qvalue | Count |
| Page: 1 |
Top |
Cell-cell communication analysis |
| Identification of potential cell-cell interactions between two cell types and their ligand-receptor pairs for different disease states |
| Ligand | Receptor | LRpair | Pathway | Tissue | Disease Stage |
| Page: 1 |
Top |
Single-cell gene regulatory network inference analysis |
| Find out the significant the regulons (TFs) and the target genes of each regulon across cell types for different disease states |
| TF | Cell Type | Tissue | Disease Stage | Target Gene | RSS | Regulon Activity |
| ∗The dot plots of a searched regulon are shown for all cell subpopulations in each disease state of each tissue based on the regulon specific score inferred using pySCENIC and by calculating the average expression. |
| Page: 1 |
Top |
Somatic mutation of malignant transformation related genes |
| Annotation of somatic variants for genes involved in malignant transformation |
| Hugo Symbol | Variant Class | Variant Classification | dbSNP RS | HGVSc | HGVSp | HGVSp Short | SWISSPROT | BIOTYPE | SIFT | PolyPhen | Tumor Sample Barcode | Tissue | Histology | Sex | Age | Stage | Therapy Types | Drugs | Outcome |
| RGS17 | SNV | Missense_Mutation | novel | c.401G>T | p.Arg134Met | p.R134M | Q9UGC6 | protein_coding | deleterious(0) | probably_damaging(0.97) | TCGA-AN-A046-01 | Breast | breast invasive carcinoma | Female | >=65 | I/II | Unknown | Unknown | SD |
| RGS17 | SNV | Missense_Mutation | novel | c.449N>C | p.Ser150Thr | p.S150T | Q9UGC6 | protein_coding | deleterious(0.02) | benign(0.205) | TCGA-BH-A18Q-01 | Breast | breast invasive carcinoma | Female | <65 | I/II | Unknown | Unknown | SD |
| RGS17 | SNV | Missense_Mutation | c.531G>C | p.Gln177His | p.Q177H | Q9UGC6 | protein_coding | deleterious(0.02) | possibly_damaging(0.584) | TCGA-DR-A0ZM-01 | Cervix | cervical & endocervical cancer | Female | <65 | III/IV | Unspecific | Cisplatin | SD | |
| RGS17 | SNV | Missense_Mutation | c.580N>G | p.Gln194Glu | p.Q194E | Q9UGC6 | protein_coding | tolerated(0.92) | benign(0.007) | TCGA-FU-A23L-01 | Cervix | cervical & endocervical cancer | Female | <65 | I/II | Chemotherapy | cisplatin | CR | |
| RGS17 | SNV | Missense_Mutation | c.536N>G | p.Tyr179Cys | p.Y179C | Q9UGC6 | protein_coding | deleterious(0) | probably_damaging(0.999) | TCGA-FU-A3HZ-01 | Cervix | cervical & endocervical cancer | Female | <65 | I/II | Chemotherapy | cisplatin | CR | |
| RGS17 | SNV | Missense_Mutation | c.566N>T | p.Arg189Met | p.R189M | Q9UGC6 | protein_coding | deleterious(0) | probably_damaging(1) | TCGA-AA-3663-01 | Colorectum | colon adenocarcinoma | Male | <65 | I/II | Unknown | Unknown | SD | |
| RGS17 | SNV | Missense_Mutation | c.493N>A | p.Asp165Asn | p.D165N | Q9UGC6 | protein_coding | deleterious(0.05) | benign(0.051) | TCGA-AD-6964-01 | Colorectum | colon adenocarcinoma | Male | <65 | III/IV | Chemotherapy | folfox | PD | |
| RGS17 | SNV | Missense_Mutation | novel | c.232N>A | p.Val78Ile | p.V78I | Q9UGC6 | protein_coding | tolerated(0.33) | benign(0.003) | TCGA-CA-6717-01 | Colorectum | colon adenocarcinoma | Male | <65 | I/II | Chemotherapy | oxaliplatin | CR |
| RGS17 | SNV | Missense_Mutation | c.372N>T | p.Gln124His | p.Q124H | Q9UGC6 | protein_coding | tolerated(0.09) | benign(0) | TCGA-DM-A1D0-01 | Colorectum | colon adenocarcinoma | Female | >=65 | I/II | Unknown | Unknown | SD | |
| RGS17 | SNV | Missense_Mutation | c.264N>T | p.Met88Ile | p.M88I | Q9UGC6 | protein_coding | deleterious(0.02) | benign(0.014) | TCGA-G4-6304-01 | Colorectum | colon adenocarcinoma | Female | >=65 | I/II | Chemotherapy | fluorouracil | PD |
| Page: 1 2 3 4 |
Top |
Related drugs of malignant transformation related genes |
| Identification of chemicals and drugs interact with genes involved in malignant transfromation |
| (DGIdb 4.0) |
| Entrez ID | Symbol | Category | Interaction Types | Drug Claim Name | Drug Name | PMIDs |
| 26575 | RGS17 | NA | antidepressants |
| Page: 1 |

Copyright 2023-Present -The University of Texas Health Science Center at Houston |