
|
|||||
|
 | |
| |
| |
| |
| |
| |
|
Gene: RGS16 |
Gene summary for RGS16 |
| Gene information | Species | Human | Gene symbol | RGS16 | Gene ID | 6004 |
| Gene name | regulator of G protein signaling 16 | |
| Gene Alias | A28-RGS14 | |
| Cytomap | 1q25.3 | |
| Gene Type | protein-coding | GO ID | GO:0003008 | UniProtAcc | O15492 |
Top |
Malignant transformation analysis |
| Identification of the aberrant gene expression in precancerous and cancerous lesions by comparing the gene expression of stem-like cells in diseased tissues with normal stem cells |
| Entrez ID | Symbol | Replicates | Species | Organ | Tissue | Adj P-value | Log2FC | Malignancy |
| 6004 | RGS16 | GSM4909287 | Human | Breast | IDC | 6.23e-09 | 5.22e-01 | 0.2057 |
| 6004 | RGS16 | GSM4909291 | Human | Breast | IDC | 1.43e-17 | 8.07e-01 | 0.1753 |
| 6004 | RGS16 | GSM4909297 | Human | Breast | IDC | 5.03e-03 | 2.54e-01 | 0.1517 |
| 6004 | RGS16 | GSM4909319 | Human | Breast | IDC | 5.20e-05 | -6.04e-02 | 0.1563 |
| 6004 | RGS16 | LZE4T | Human | Esophagus | ESCC | 9.93e-03 | 3.06e-01 | 0.0811 |
| 6004 | RGS16 | LZE7T | Human | Esophagus | ESCC | 8.22e-07 | 6.56e-01 | 0.0667 |
| 6004 | RGS16 | LZE21T | Human | Esophagus | ESCC | 1.17e-02 | 1.36e-01 | 0.0655 |
| 6004 | RGS16 | LZE6T | Human | Esophagus | ESCC | 1.41e-05 | 1.63e-01 | 0.0845 |
| 6004 | RGS16 | P1T-E | Human | Esophagus | ESCC | 2.53e-10 | 9.04e-01 | 0.0875 |
| 6004 | RGS16 | P2T-E | Human | Esophagus | ESCC | 5.07e-36 | 1.05e+00 | 0.1177 |
| 6004 | RGS16 | P4T-E | Human | Esophagus | ESCC | 3.01e-18 | 1.09e+00 | 0.1323 |
| 6004 | RGS16 | P5T-E | Human | Esophagus | ESCC | 2.98e-29 | 1.14e+00 | 0.1327 |
| 6004 | RGS16 | P8T-E | Human | Esophagus | ESCC | 3.59e-06 | 4.88e-01 | 0.0889 |
| 6004 | RGS16 | P9T-E | Human | Esophagus | ESCC | 1.90e-09 | 1.23e+00 | 0.1131 |
| 6004 | RGS16 | P11T-E | Human | Esophagus | ESCC | 6.56e-18 | 3.09e+00 | 0.1426 |
| 6004 | RGS16 | P15T-E | Human | Esophagus | ESCC | 1.81e-10 | 6.53e-01 | 0.1149 |
| 6004 | RGS16 | P16T-E | Human | Esophagus | ESCC | 1.06e-06 | 1.90e-01 | 0.1153 |
| 6004 | RGS16 | P19T-E | Human | Esophagus | ESCC | 3.08e-07 | 2.47e+00 | 0.1662 |
| 6004 | RGS16 | P20T-E | Human | Esophagus | ESCC | 1.15e-16 | 1.08e+00 | 0.1124 |
| 6004 | RGS16 | P22T-E | Human | Esophagus | ESCC | 2.18e-07 | 4.38e-01 | 0.1236 |
| Page: 1 2 3 4 5 6 |
| Tissue | Expression Dynamics | Abbreviation |
| Breast | 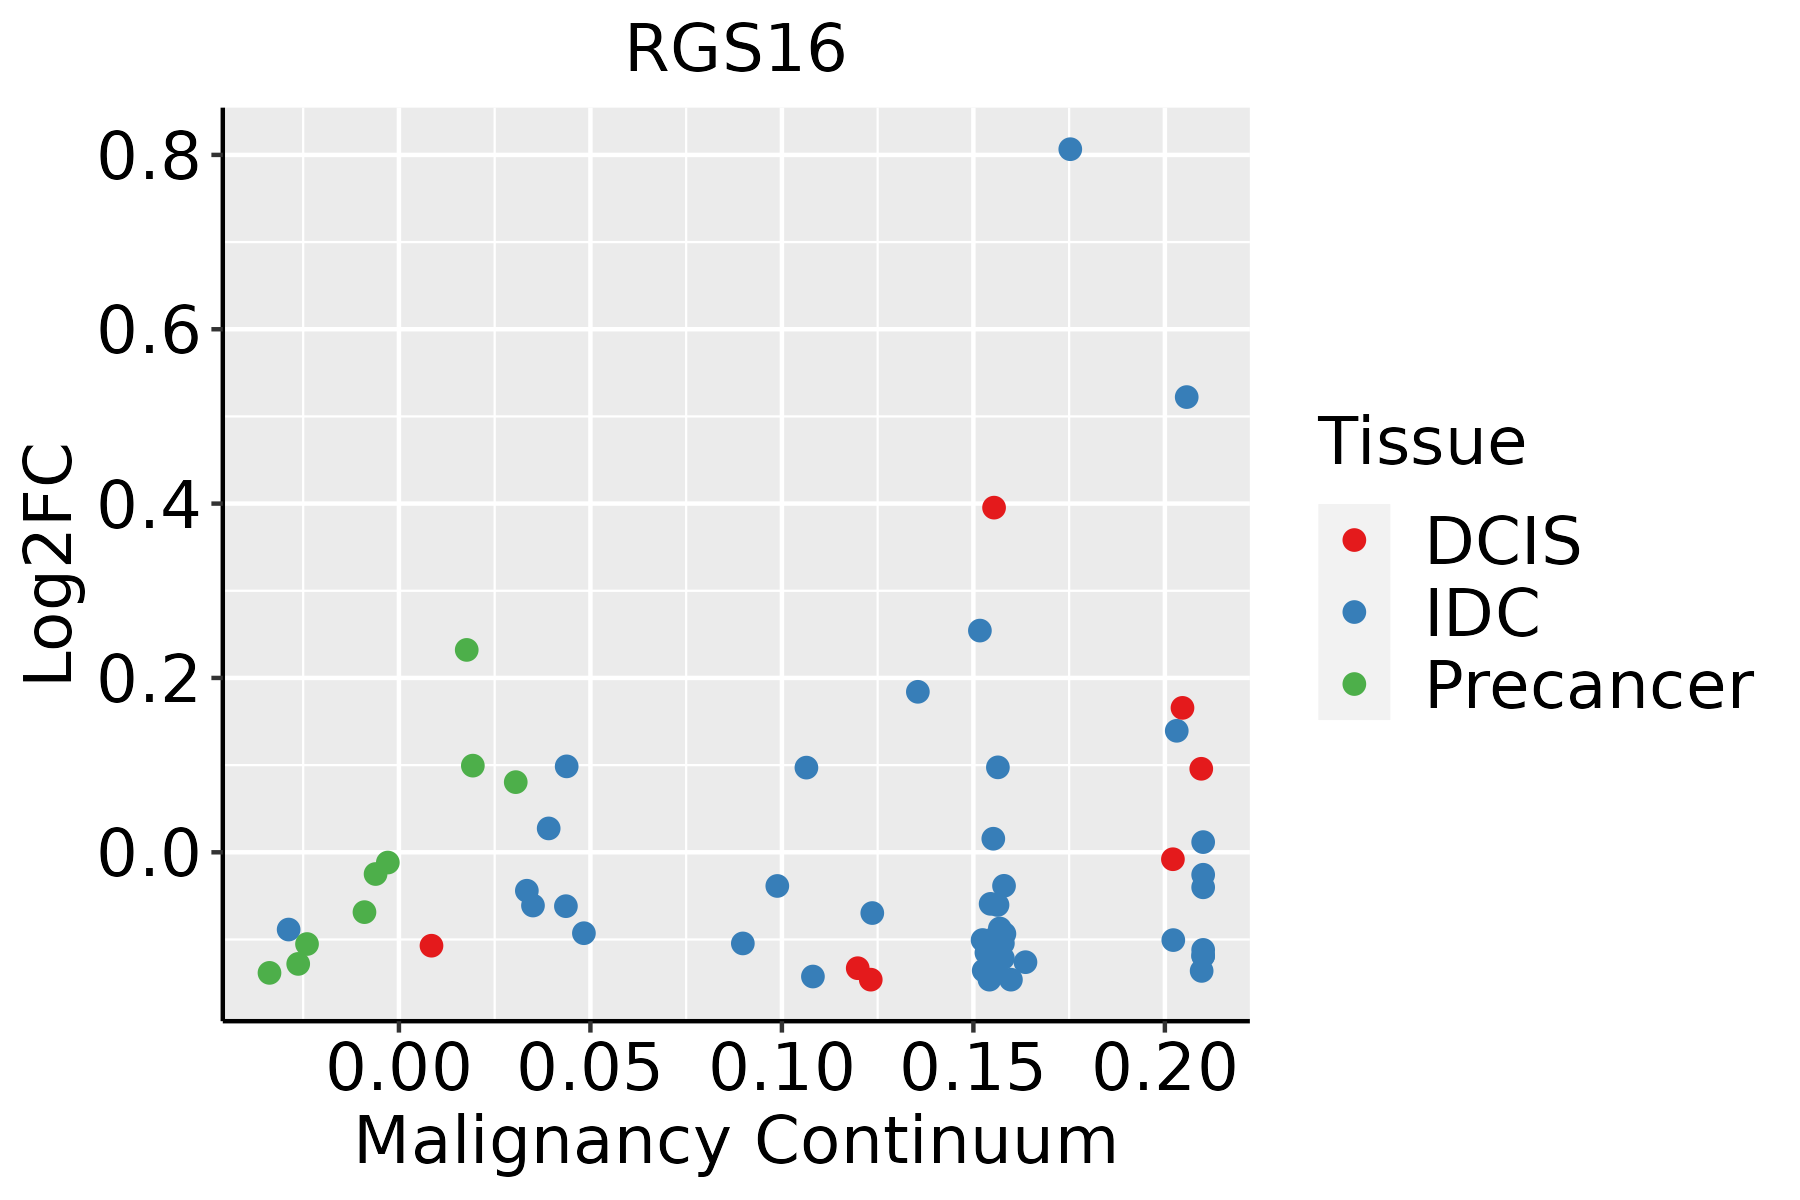 | IDC: Invasive ductal carcinoma |
| DCIS: Ductal carcinoma in situ | ||
| Precancer(BRCA1-mut): Precancerous lesion from BRCA1 mutation carriers | ||
| Esophagus |  | ESCC: Esophageal squamous cell carcinoma |
| HGIN: High-grade intraepithelial neoplasias | ||
| LGIN: Low-grade intraepithelial neoplasias | ||
| Liver | 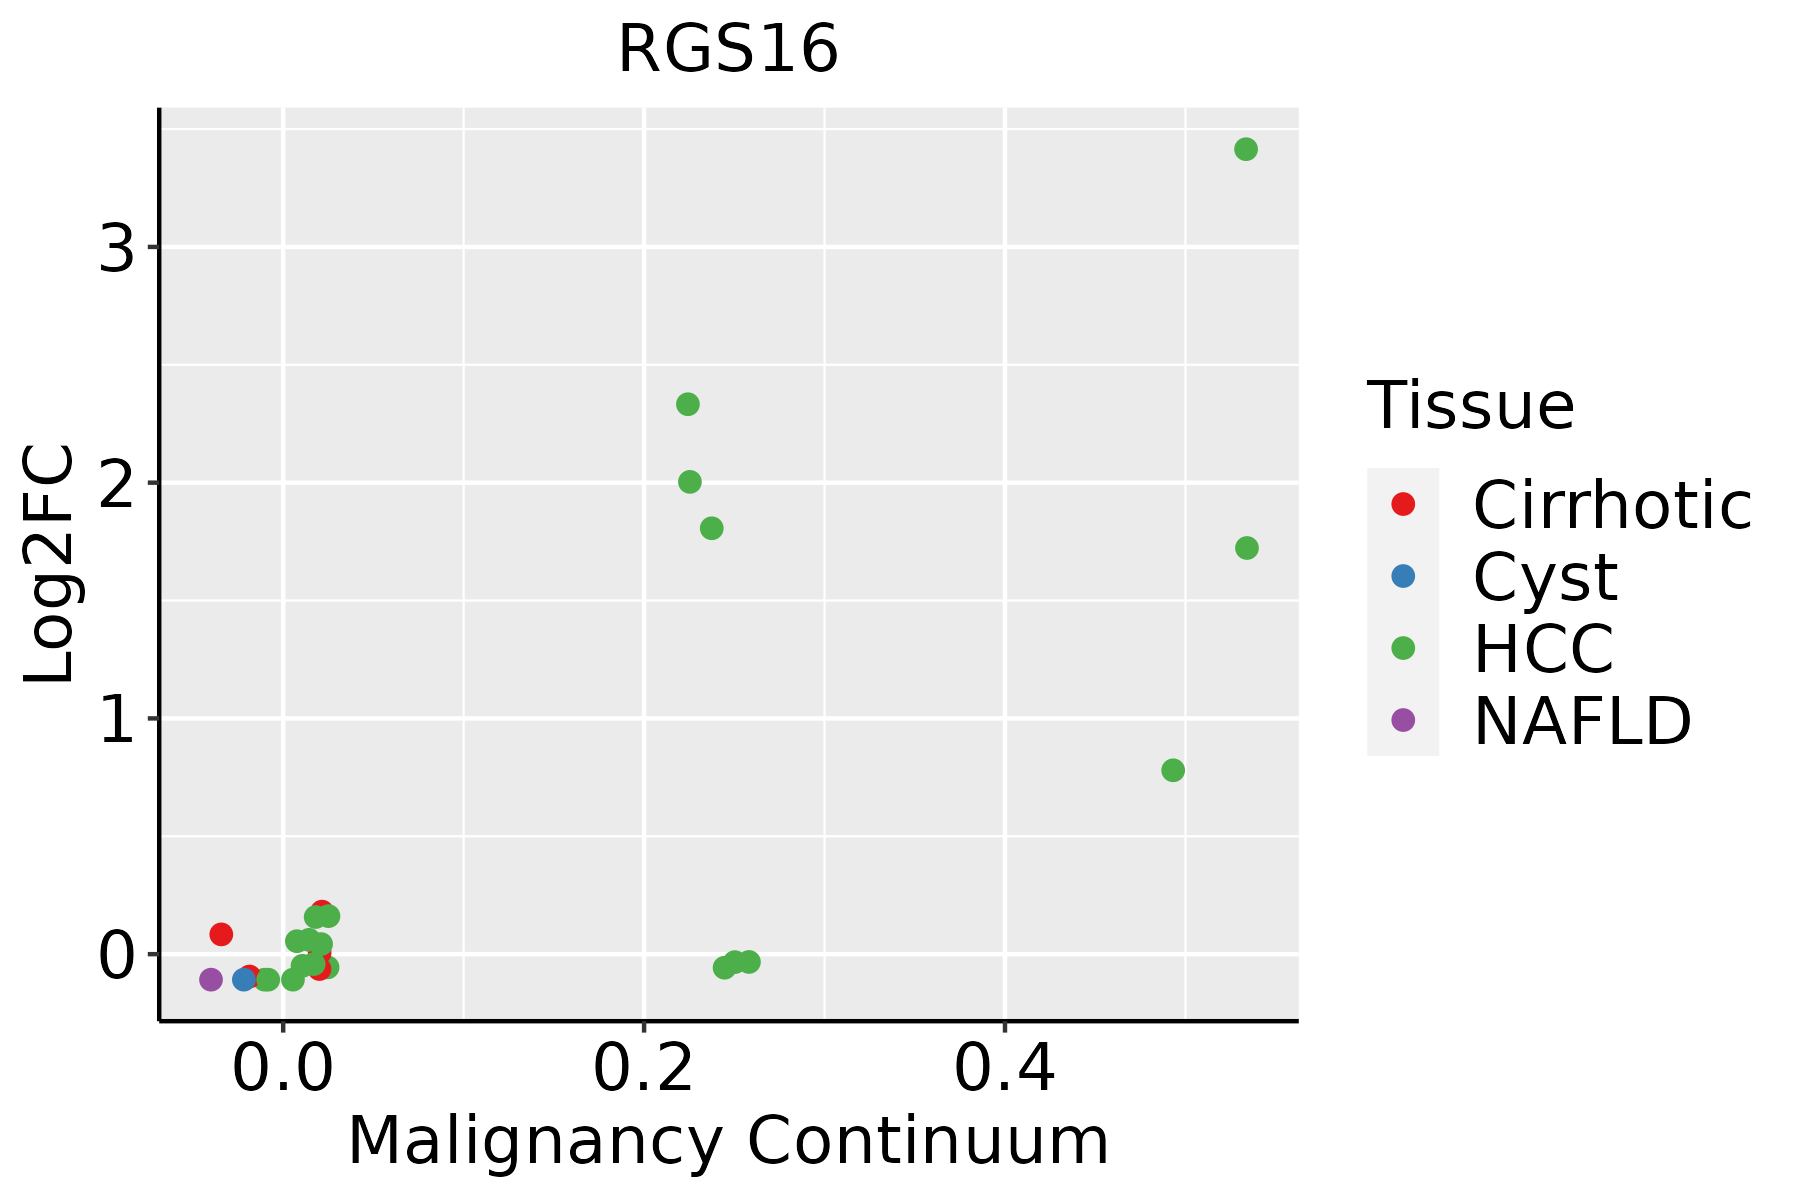 | HCC: Hepatocellular carcinoma |
| NAFLD: Non-alcoholic fatty liver disease | ||
| Oral Cavity | 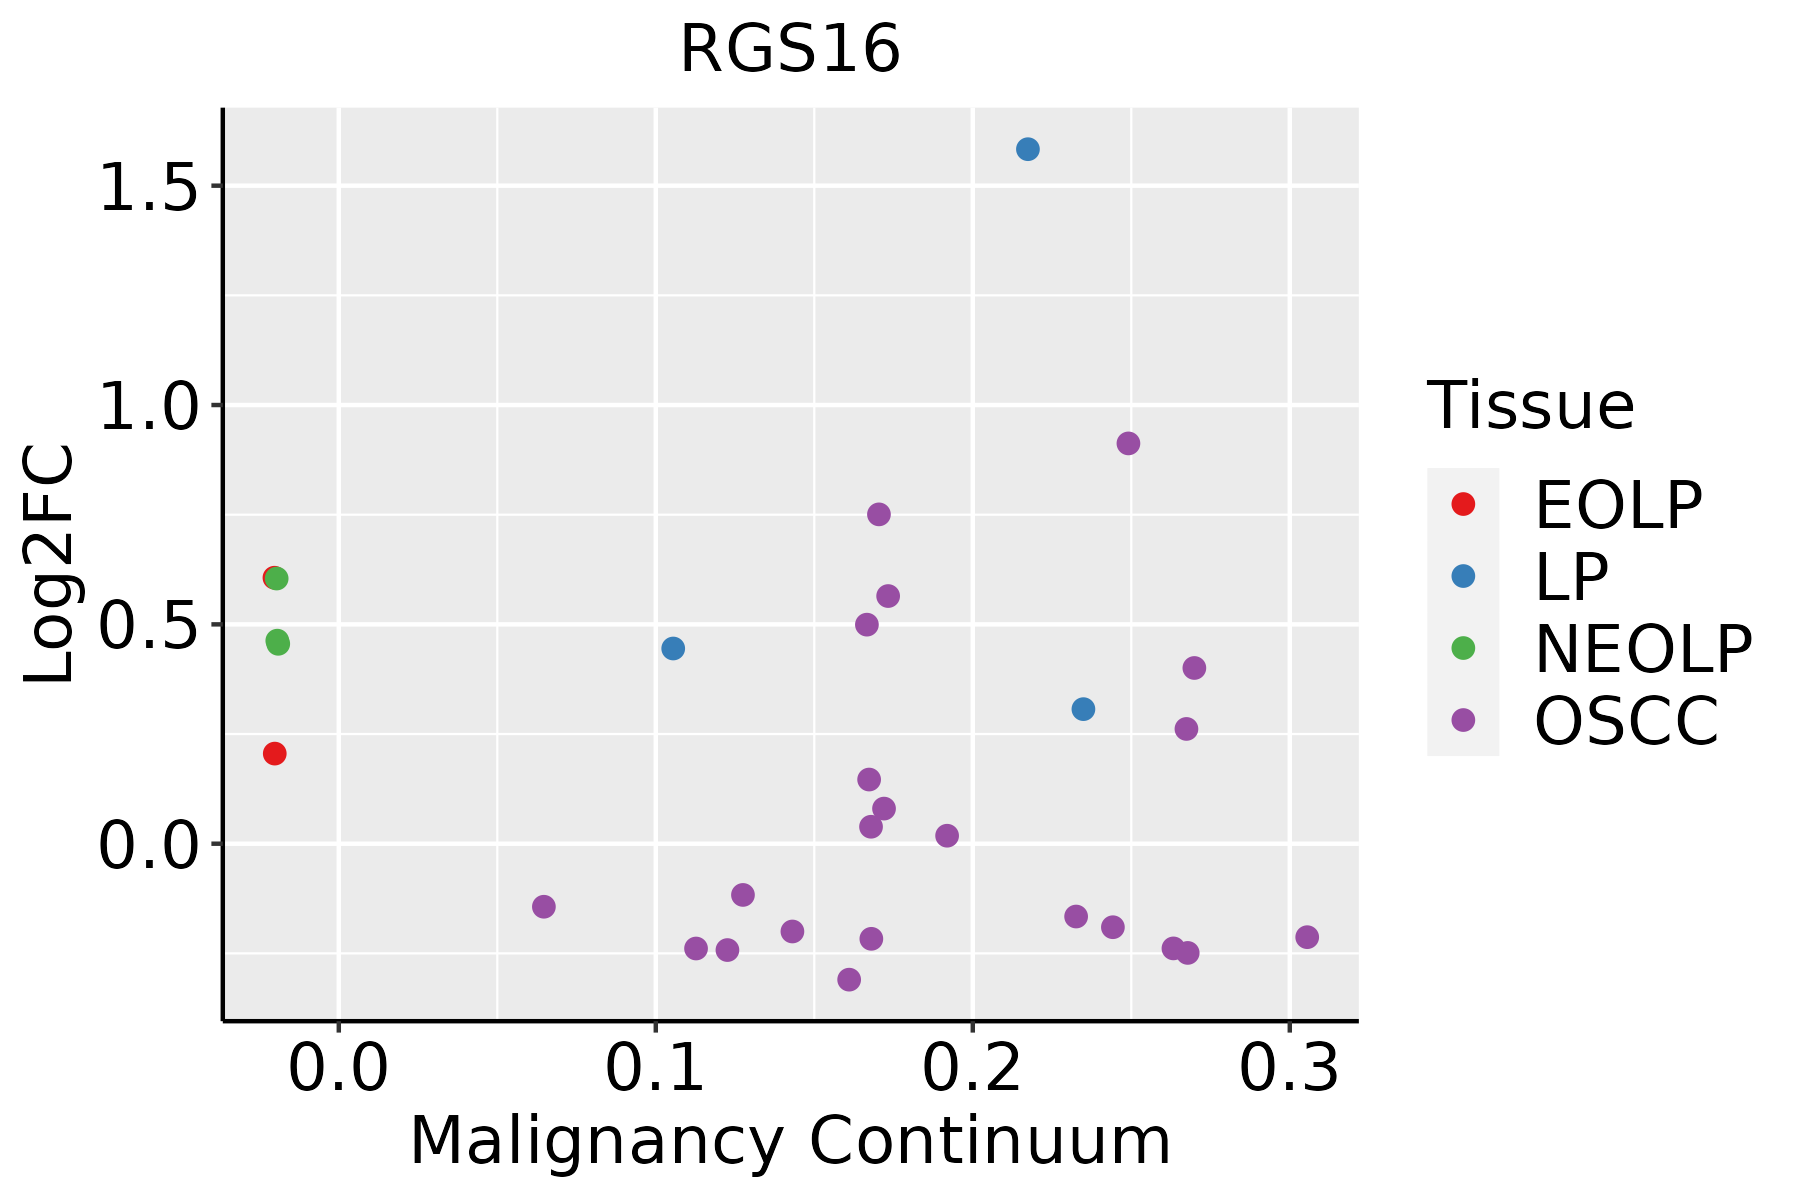 | EOLP: Erosive Oral lichen planus |
| LP: leukoplakia | ||
| NEOLP: Non-erosive oral lichen planus | ||
| OSCC: Oral squamous cell carcinoma | ||
| Skin |  | AK: Actinic keratosis |
| cSCC: Cutaneous squamous cell carcinoma | ||
| SCCIS:squamous cell carcinoma in situ | ||
| Thyroid | 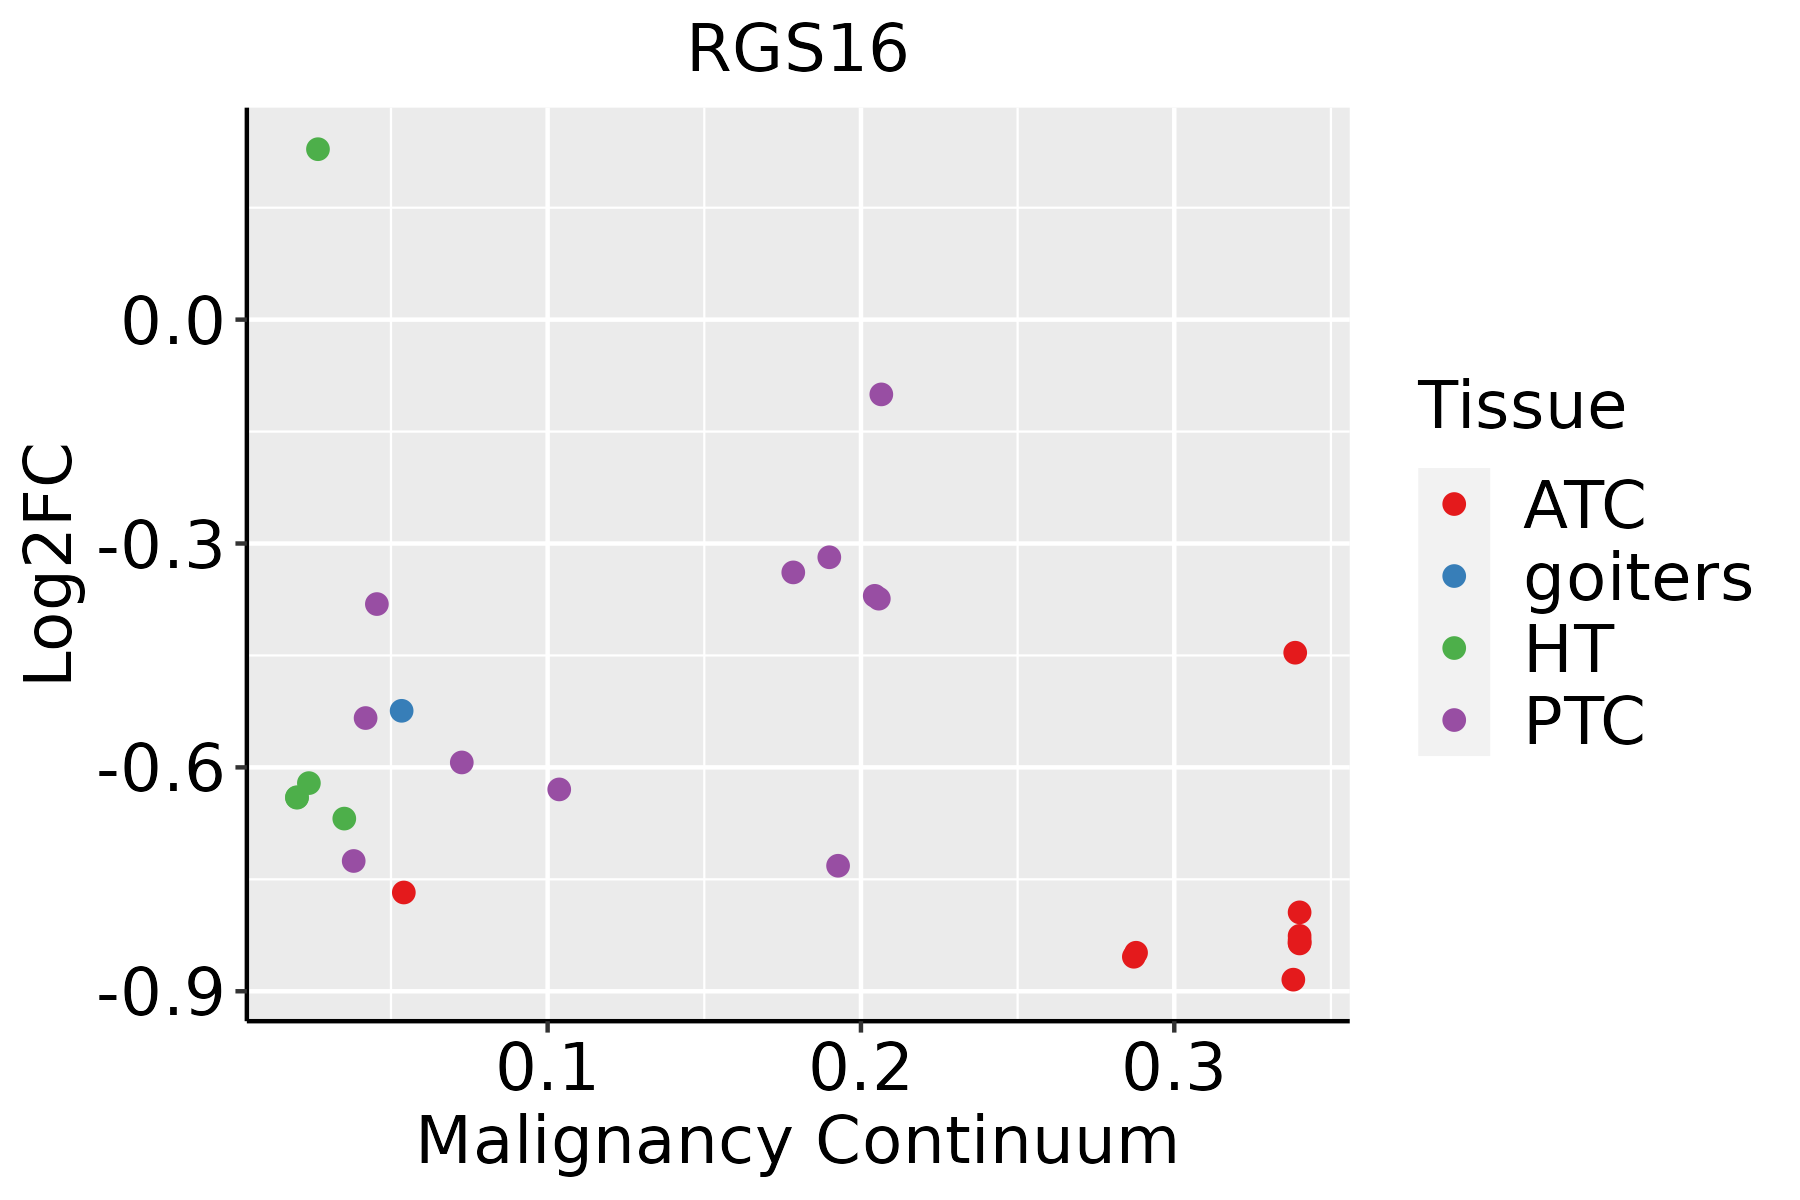 | ATC: Anaplastic thyroid cancer |
| HT: Hashimoto's thyroiditis | ||
| PTC: Papillary thyroid cancer |
| ∗log2FC in expression of this searched gene in stem-like cells from each diseased tissue sample relative to stem-like cells in normal samples in each tissue plotted against the malignancy continuum. Samples are colored based on if they are from different disease stage. |
Top |
Malignant transformation related pathway analysis |
| Find out the enriched GO biological processes and KEGG pathways involved in transition from healthy to precancer to cancer |
| Tissue | Disease Stage | Enriched GO biological Processes |
| Colorectum | AD |  |
| Colorectum | SER |  |
| Colorectum | MSS |  |
| Colorectum | MSI-H |  |
| Colorectum | FAP |  |
| ∗Top 15 enriched GO BP terms are showed in the bar plot of each disease state in each tissue. Each row represents a significant GO biological process which is colored according to the -log10(p.adjust). |
| Page: 1 2 3 4 5 6 7 8 9 |
| GO ID | Tissue | Disease Stage | Description | Gene Ratio | Bg Ratio | pvalue | p.adjust | Count |
| GO:004308715 | Esophagus | ESCC | regulation of GTPase activity | 183/8552 | 348/18723 | 5.34e-03 | 2.00e-02 | 183 |
| GO:004308710 | Oral cavity | OSCC | regulation of GTPase activity | 165/7305 | 348/18723 | 7.94e-04 | 4.27e-03 | 165 |
| GO:004308714 | Oral cavity | EOLP | regulation of GTPase activity | 66/2218 | 348/18723 | 6.92e-05 | 8.55e-04 | 66 |
| GO:00435479 | Oral cavity | EOLP | positive regulation of GTPase activity | 47/2218 | 255/18723 | 1.34e-03 | 9.33e-03 | 47 |
| GO:004308722 | Oral cavity | NEOLP | regulation of GTPase activity | 54/2005 | 348/18723 | 3.36e-03 | 2.00e-02 | 54 |
| GO:004308716 | Skin | AK | regulation of GTPase activity | 54/1910 | 348/18723 | 1.17e-03 | 8.98e-03 | 54 |
| GO:004308717 | Skin | SCCIS | regulation of GTPase activity | 39/919 | 348/18723 | 1.38e-06 | 8.71e-05 | 39 |
| GO:004354710 | Skin | SCCIS | positive regulation of GTPase activity | 27/919 | 255/18723 | 1.48e-04 | 3.00e-03 | 27 |
| GO:004308718 | Thyroid | PTC | regulation of GTPase activity | 148/5968 | 348/18723 | 1.63e-05 | 1.71e-04 | 148 |
| GO:004354714 | Thyroid | PTC | positive regulation of GTPase activity | 103/5968 | 255/18723 | 2.38e-03 | 1.25e-02 | 103 |
| GO:004308719 | Thyroid | ATC | regulation of GTPase activity | 153/6293 | 348/18723 | 3.24e-05 | 2.68e-04 | 153 |
| GO:004354715 | Thyroid | ATC | positive regulation of GTPase activity | 106/6293 | 255/18723 | 4.58e-03 | 1.89e-02 | 106 |
| Page: 1 |
| Pathway ID | Tissue | Disease Stage | Description | Gene Ratio | Bg Ratio | pvalue | p.adjust | qvalue | Count |
| Page: 1 |
Top |
Cell-cell communication analysis |
| Identification of potential cell-cell interactions between two cell types and their ligand-receptor pairs for different disease states |
| Ligand | Receptor | LRpair | Pathway | Tissue | Disease Stage |
| Page: 1 |
Top |
Single-cell gene regulatory network inference analysis |
| Find out the significant the regulons (TFs) and the target genes of each regulon across cell types for different disease states |
| TF | Cell Type | Tissue | Disease Stage | Target Gene | RSS | Regulon Activity |
| ∗The dot plots of a searched regulon are shown for all cell subpopulations in each disease state of each tissue based on the regulon specific score inferred using pySCENIC and by calculating the average expression. |
| Page: 1 |
Top |
Somatic mutation of malignant transformation related genes |
| Annotation of somatic variants for genes involved in malignant transformation |
| Hugo Symbol | Variant Class | Variant Classification | dbSNP RS | HGVSc | HGVSp | HGVSp Short | SWISSPROT | BIOTYPE | SIFT | PolyPhen | Tumor Sample Barcode | Tissue | Histology | Sex | Age | Stage | Therapy Types | Drugs | Outcome |
| RGS16 | SNV | Missense_Mutation | c.505C>T | p.Pro169Ser | p.P169S | O15492 | protein_coding | deleterious(0) | possibly_damaging(0.811) | TCGA-BH-A1FJ-01 | Breast | breast invasive carcinoma | Female | >=65 | III/IV | Unknown | Unknown | SD | |
| RGS16 | SNV | Missense_Mutation | rs149776657 | c.532N>T | p.Arg178Trp | p.R178W | O15492 | protein_coding | deleterious(0.03) | possibly_damaging(0.809) | TCGA-C8-A26W-01 | Breast | breast invasive carcinoma | Female | <65 | I/II | Chemotherapy | doxorubicin | CR |
| RGS16 | SNV | Missense_Mutation | c.57N>G | p.Phe19Leu | p.F19L | O15492 | protein_coding | tolerated(1) | benign(0.003) | TCGA-D8-A1Y1-01 | Breast | breast invasive carcinoma | Female | >=65 | III/IV | Hormone Therapy | tamoxiphen | PD | |
| RGS16 | deletion | Frame_Shift_Del | novel | c.72delG | p.Ile25SerfsTer46 | p.I25Sfs*46 | O15492 | protein_coding | TCGA-D8-A27V-01 | Breast | breast invasive carcinoma | Female | <65 | I/II | Hormone Therapy | tamoxiphen | SD | ||
| RGS16 | SNV | Missense_Mutation | c.443C>T | p.Thr148Ile | p.T148I | O15492 | protein_coding | deleterious(0.03) | possibly_damaging(0.756) | TCGA-CK-4951-01 | Colorectum | colon adenocarcinoma | Female | >=65 | I/II | Unknown | Unknown | PD | |
| RGS16 | SNV | Missense_Mutation | novel | c.157N>G | p.Arg53Gly | p.R53G | O15492 | protein_coding | deleterious(0.03) | benign(0) | TCGA-A5-A0GP-01 | Endometrium | uterine corpus endometrioid carcinoma | Female | <65 | I/II | Unknown | Unknown | SD |
| RGS16 | SNV | Missense_Mutation | novel | c.397N>C | p.Asp133His | p.D133H | O15492 | protein_coding | deleterious(0) | probably_damaging(1) | TCGA-A5-A1OH-01 | Endometrium | uterine corpus endometrioid carcinoma | Female | >=65 | III/IV | Chemotherapy | carboplatin | CR |
| RGS16 | SNV | Missense_Mutation | c.445G>T | p.Ala149Ser | p.A149S | O15492 | protein_coding | tolerated(0.87) | benign(0.02) | TCGA-AP-A051-01 | Endometrium | uterine corpus endometrioid carcinoma | Female | >=65 | I/II | Unknown | Unknown | SD | |
| RGS16 | SNV | Missense_Mutation | c.485N>C | p.Leu162Pro | p.L162P | O15492 | protein_coding | deleterious(0) | probably_damaging(1) | TCGA-AP-A1DK-01 | Endometrium | uterine corpus endometrioid carcinoma | Female | <65 | I/II | Unknown | Unknown | SD | |
| RGS16 | SNV | Missense_Mutation | c.464N>T | p.Ala155Val | p.A155V | O15492 | protein_coding | deleterious(0) | possibly_damaging(0.56) | TCGA-AX-A0J1-01 | Endometrium | uterine corpus endometrioid carcinoma | Female | >=65 | I/II | Unknown | Unknown | SD |
| Page: 1 2 3 |
Top |
Related drugs of malignant transformation related genes |
| Identification of chemicals and drugs interact with genes involved in malignant transfromation |
| (DGIdb 4.0) |
| Entrez ID | Symbol | Category | Interaction Types | Drug Claim Name | Drug Name | PMIDs |
| 6004 | RGS16 | NA | s2901 |
| Page: 1 |

Copyright 2023-Present -The University of Texas Health Science Center at Houston |