
|
|||||
|
 | |
| |
| |
| |
| |
| |
|
Gene: RGS14 |
Gene summary for RGS14 |
| Gene information | Species | Human | Gene symbol | RGS14 | Gene ID | 10636 |
| Gene name | regulator of G protein signaling 14 | |
| Gene Alias | RGS14 | |
| Cytomap | 5q35.3 | |
| Gene Type | protein-coding | GO ID | GO:0000165 | UniProtAcc | O43566 |
Top |
Malignant transformation analysis |
| Identification of the aberrant gene expression in precancerous and cancerous lesions by comparing the gene expression of stem-like cells in diseased tissues with normal stem cells |
| Entrez ID | Symbol | Replicates | Species | Organ | Tissue | Adj P-value | Log2FC | Malignancy |
| 10636 | RGS14 | LZE4T | Human | Esophagus | ESCC | 3.05e-06 | 2.51e-01 | 0.0811 |
| 10636 | RGS14 | LZE8T | Human | Esophagus | ESCC | 6.21e-03 | 1.96e-01 | 0.067 |
| 10636 | RGS14 | LZE20T | Human | Esophagus | ESCC | 1.99e-05 | 2.64e-01 | 0.0662 |
| 10636 | RGS14 | LZE24T | Human | Esophagus | ESCC | 3.84e-15 | 5.24e-01 | 0.0596 |
| 10636 | RGS14 | LZE6T | Human | Esophagus | ESCC | 1.39e-04 | 3.07e-01 | 0.0845 |
| 10636 | RGS14 | P1T-E | Human | Esophagus | ESCC | 7.77e-08 | 3.51e-01 | 0.0875 |
| 10636 | RGS14 | P2T-E | Human | Esophagus | ESCC | 1.21e-27 | 4.34e-01 | 0.1177 |
| 10636 | RGS14 | P4T-E | Human | Esophagus | ESCC | 1.04e-21 | 5.32e-01 | 0.1323 |
| 10636 | RGS14 | P5T-E | Human | Esophagus | ESCC | 2.49e-24 | 4.42e-01 | 0.1327 |
| 10636 | RGS14 | P8T-E | Human | Esophagus | ESCC | 6.14e-05 | 8.77e-02 | 0.0889 |
| 10636 | RGS14 | P9T-E | Human | Esophagus | ESCC | 4.13e-06 | 1.22e-01 | 0.1131 |
| 10636 | RGS14 | P10T-E | Human | Esophagus | ESCC | 1.12e-09 | 1.23e-01 | 0.116 |
| 10636 | RGS14 | P11T-E | Human | Esophagus | ESCC | 2.02e-06 | 4.06e-01 | 0.1426 |
| 10636 | RGS14 | P12T-E | Human | Esophagus | ESCC | 3.88e-25 | 4.45e-01 | 0.1122 |
| 10636 | RGS14 | P15T-E | Human | Esophagus | ESCC | 1.16e-15 | 4.10e-01 | 0.1149 |
| 10636 | RGS14 | P16T-E | Human | Esophagus | ESCC | 8.54e-14 | 1.08e-01 | 0.1153 |
| 10636 | RGS14 | P17T-E | Human | Esophagus | ESCC | 3.01e-03 | 2.52e-01 | 0.1278 |
| 10636 | RGS14 | P20T-E | Human | Esophagus | ESCC | 5.22e-18 | 4.31e-01 | 0.1124 |
| 10636 | RGS14 | P21T-E | Human | Esophagus | ESCC | 7.70e-24 | 4.06e-01 | 0.1617 |
| 10636 | RGS14 | P22T-E | Human | Esophagus | ESCC | 5.44e-26 | 4.07e-01 | 0.1236 |
| Page: 1 2 3 4 5 |
| Tissue | Expression Dynamics | Abbreviation |
| Esophagus | 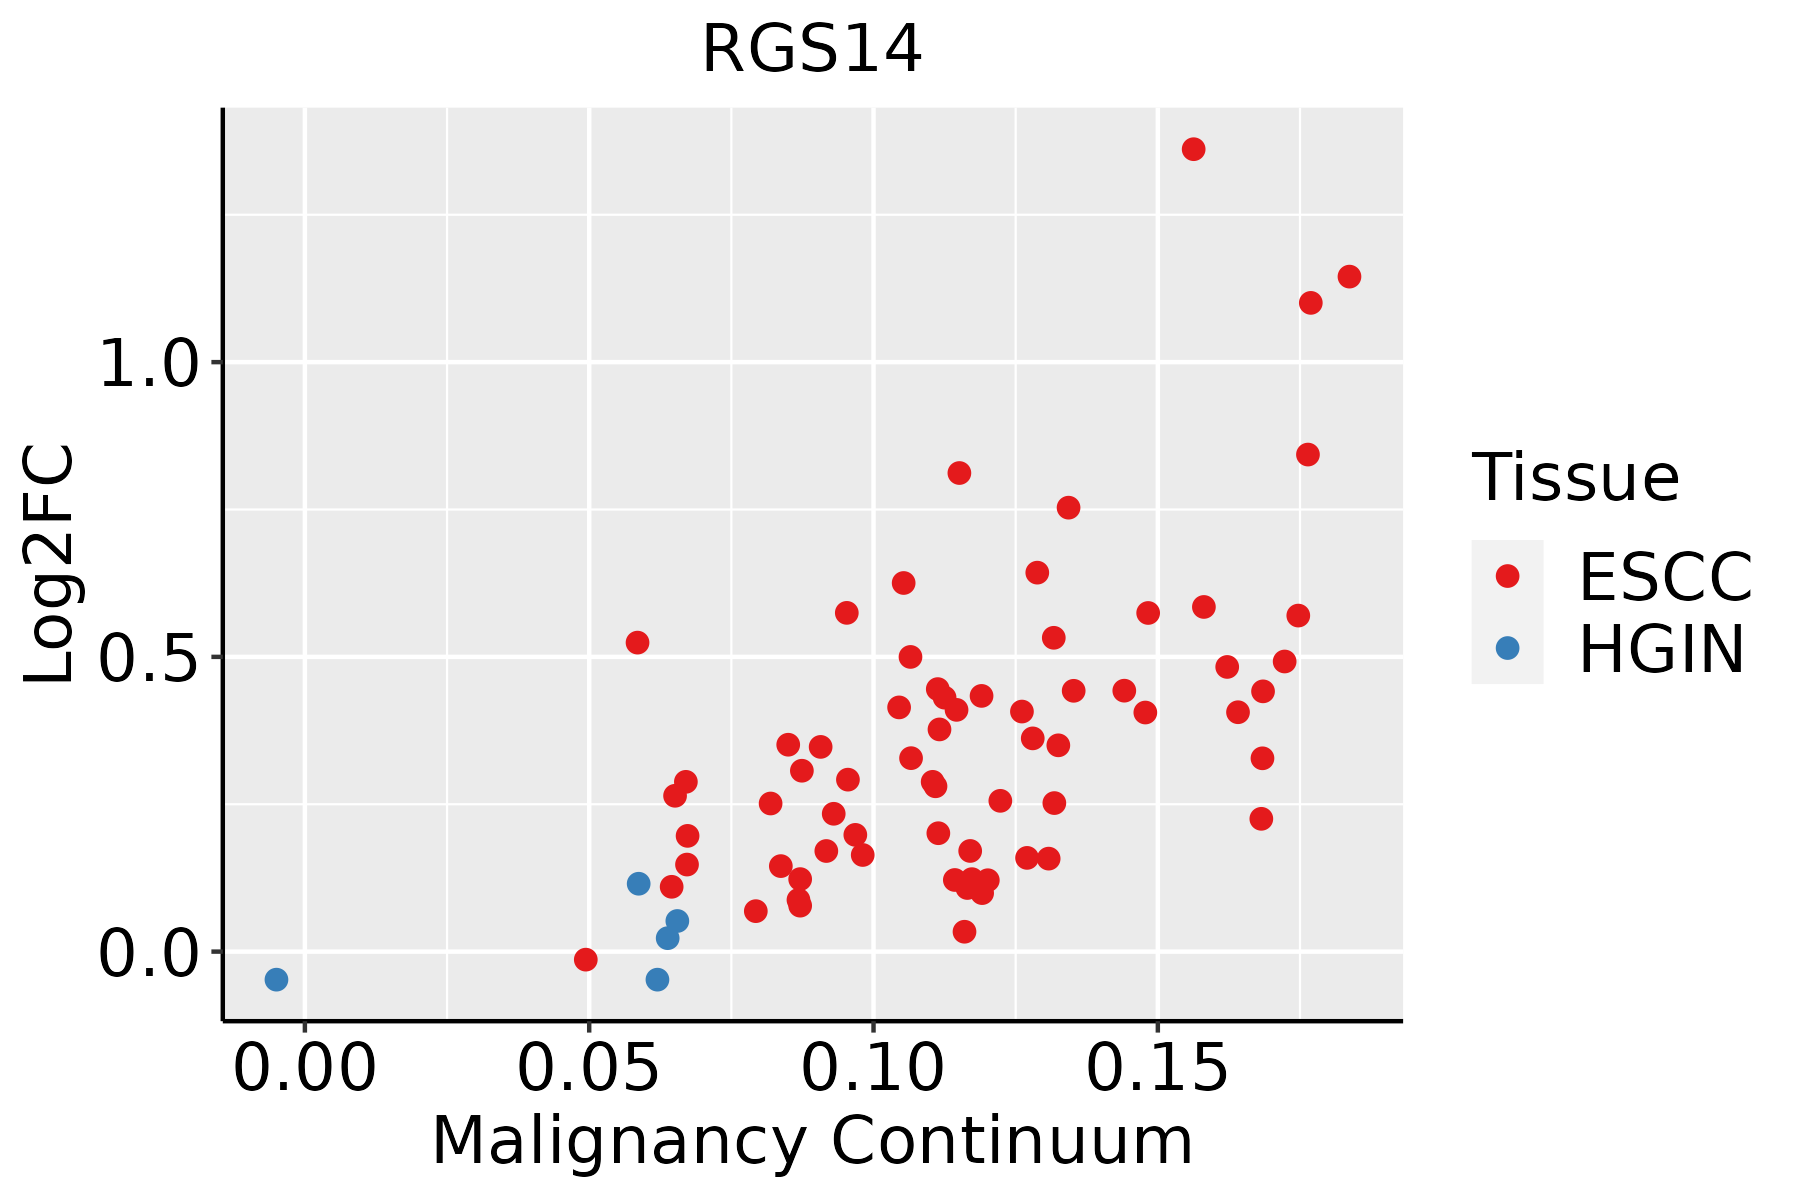 | ESCC: Esophageal squamous cell carcinoma |
| HGIN: High-grade intraepithelial neoplasias | ||
| LGIN: Low-grade intraepithelial neoplasias | ||
| Liver | 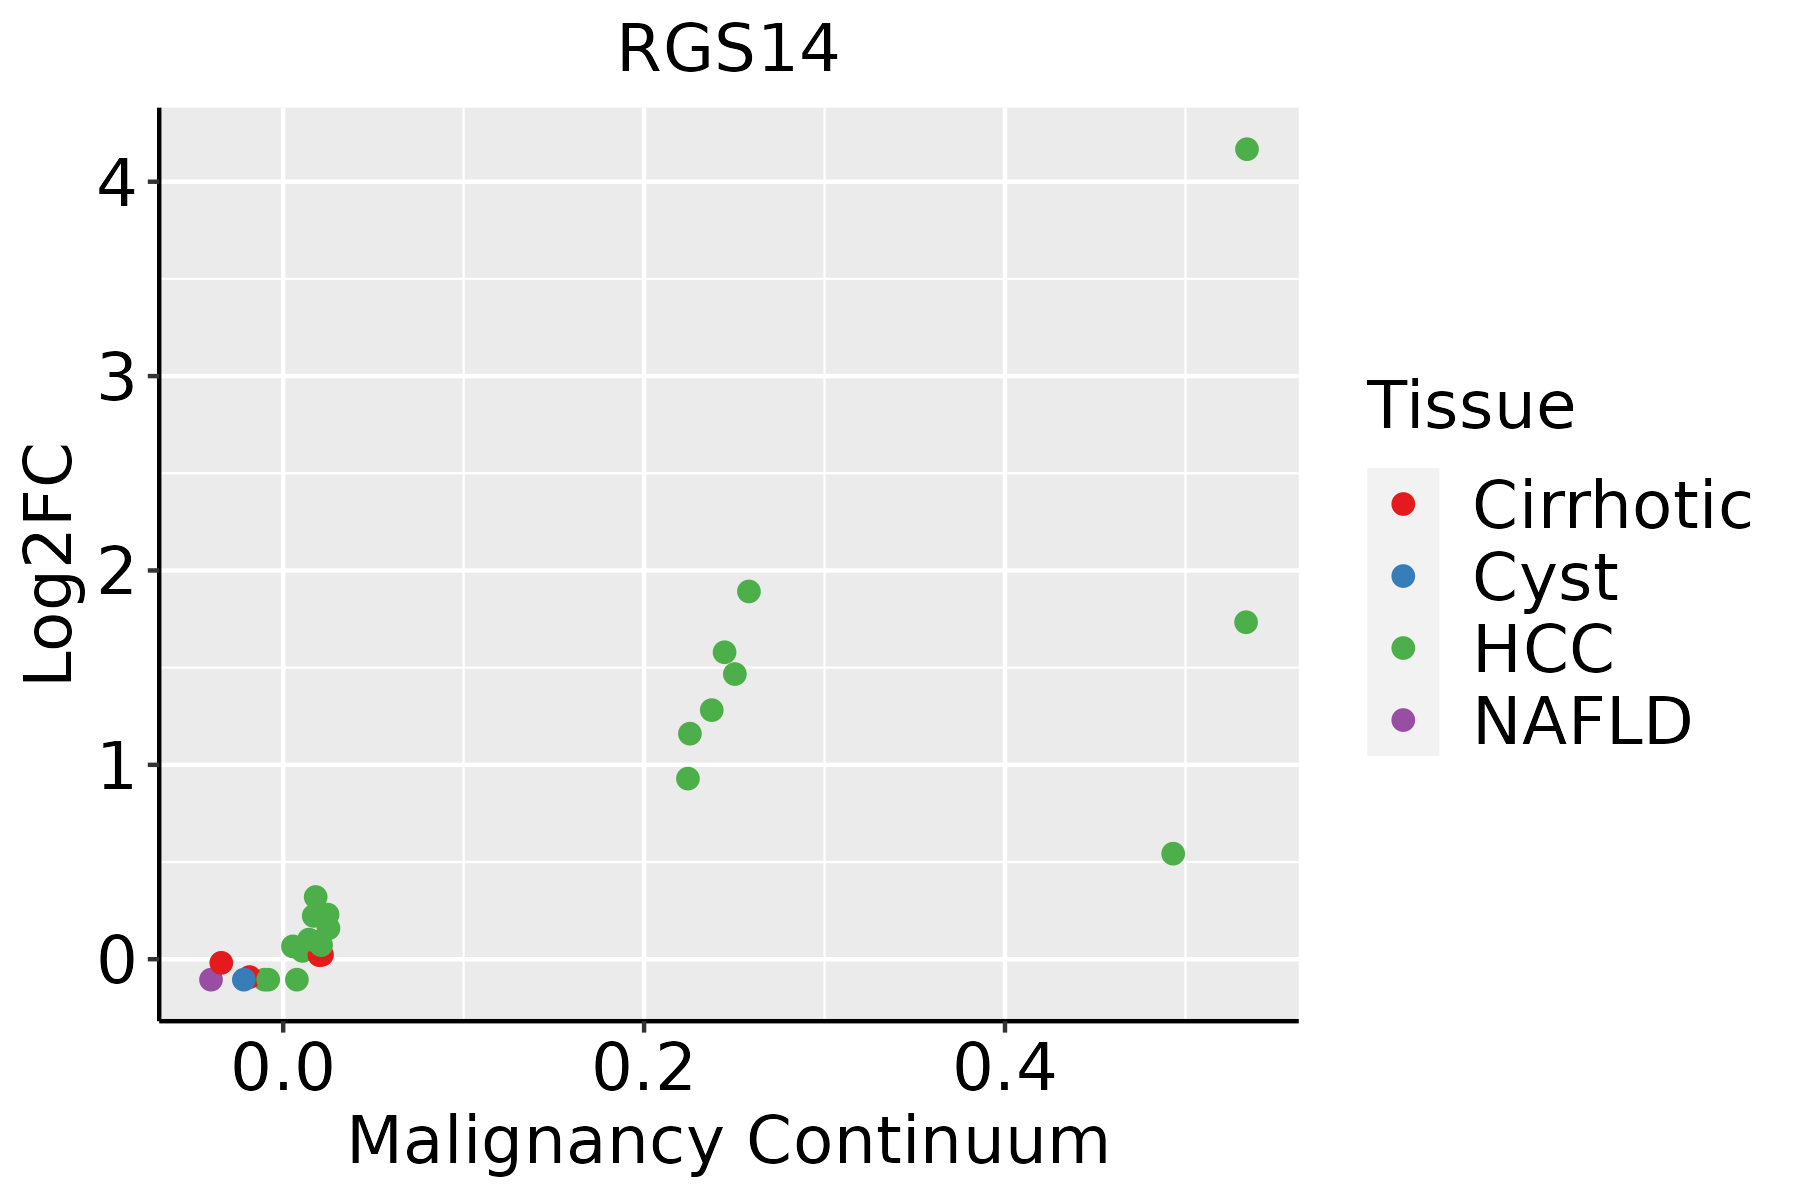 | HCC: Hepatocellular carcinoma |
| NAFLD: Non-alcoholic fatty liver disease | ||
| Oral Cavity | 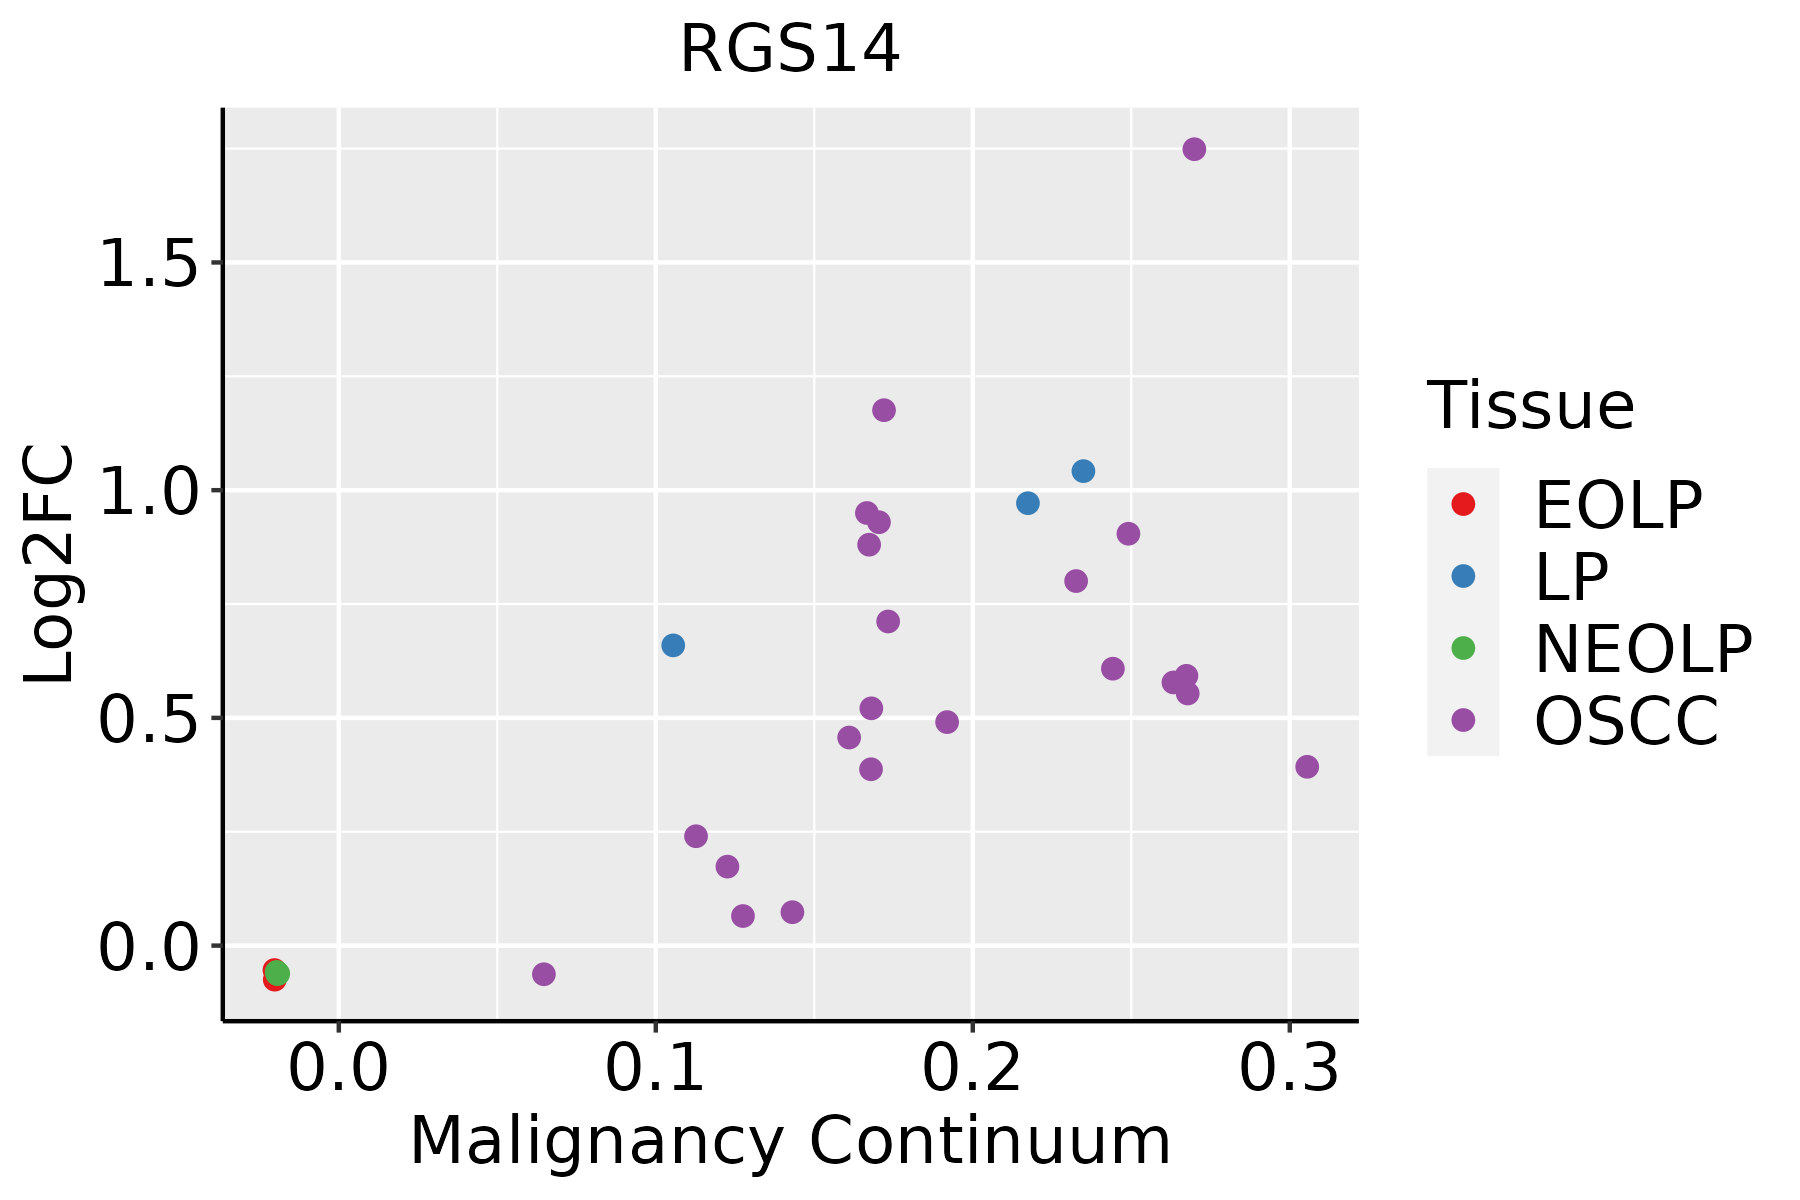 | EOLP: Erosive Oral lichen planus |
| LP: leukoplakia | ||
| NEOLP: Non-erosive oral lichen planus | ||
| OSCC: Oral squamous cell carcinoma | ||
| Skin |  | AK: Actinic keratosis |
| cSCC: Cutaneous squamous cell carcinoma | ||
| SCCIS:squamous cell carcinoma in situ |
| ∗log2FC in expression of this searched gene in stem-like cells from each diseased tissue sample relative to stem-like cells in normal samples in each tissue plotted against the malignancy continuum. Samples are colored based on if they are from different disease stage. |
Top |
Malignant transformation related pathway analysis |
| Find out the enriched GO biological processes and KEGG pathways involved in transition from healthy to precancer to cancer |
| Tissue | Disease Stage | Enriched GO biological Processes |
| Colorectum | AD |  |
| Colorectum | SER |  |
| Colorectum | MSS |  |
| Colorectum | MSI-H |  |
| Colorectum | FAP |  |
| ∗Top 15 enriched GO BP terms are showed in the bar plot of each disease state in each tissue. Each row represents a significant GO biological process which is colored according to the -log10(p.adjust). |
| Page: 1 2 3 4 5 6 7 8 9 |
| GO ID | Tissue | Disease Stage | Description | Gene Ratio | Bg Ratio | pvalue | p.adjust | Count |
| GO:0006913110 | Esophagus | ESCC | nucleocytoplasmic transport | 230/8552 | 301/18723 | 6.04e-28 | 2.02e-25 | 230 |
| GO:0051169110 | Esophagus | ESCC | nuclear transport | 230/8552 | 301/18723 | 6.04e-28 | 2.02e-25 | 230 |
| GO:0006979111 | Esophagus | ESCC | response to oxidative stress | 303/8552 | 446/18723 | 7.15e-22 | 1.30e-19 | 303 |
| GO:000705911 | Esophagus | ESCC | chromosome segregation | 238/8552 | 346/18723 | 1.72e-18 | 1.82e-16 | 238 |
| GO:000705114 | Esophagus | ESCC | spindle organization | 134/8552 | 184/18723 | 5.70e-14 | 2.87e-12 | 134 |
| GO:0010563111 | Esophagus | ESCC | negative regulation of phosphorus metabolic process | 274/8552 | 442/18723 | 2.32e-12 | 9.41e-11 | 274 |
| GO:0045936111 | Esophagus | ESCC | negative regulation of phosphate metabolic process | 273/8552 | 441/18723 | 3.18e-12 | 1.25e-10 | 273 |
| GO:0051348111 | Esophagus | ESCC | negative regulation of transferase activity | 177/8552 | 268/18723 | 1.08e-11 | 4.00e-10 | 177 |
| GO:007190016 | Esophagus | ESCC | regulation of protein serine/threonine kinase activity | 227/8552 | 359/18723 | 1.12e-11 | 4.10e-10 | 227 |
| GO:000931419 | Esophagus | ESCC | response to radiation | 277/8552 | 456/18723 | 4.42e-11 | 1.43e-09 | 277 |
| GO:0042326111 | Esophagus | ESCC | negative regulation of phosphorylation | 237/8552 | 385/18723 | 1.86e-10 | 5.33e-09 | 237 |
| GO:0001933111 | Esophagus | ESCC | negative regulation of protein phosphorylation | 213/8552 | 342/18723 | 3.54e-10 | 9.76e-09 | 213 |
| GO:0043620111 | Esophagus | ESCC | regulation of DNA-templated transcription in response to stress | 46/8552 | 53/18723 | 5.17e-10 | 1.33e-08 | 46 |
| GO:003367319 | Esophagus | ESCC | negative regulation of kinase activity | 154/8552 | 237/18723 | 1.38e-09 | 3.27e-08 | 154 |
| GO:000646920 | Esophagus | ESCC | negative regulation of protein kinase activity | 140/8552 | 212/18723 | 1.53e-09 | 3.56e-08 | 140 |
| GO:00480087 | Esophagus | ESCC | platelet-derived growth factor receptor signaling pathway | 42/8552 | 56/18723 | 7.62e-06 | 7.54e-05 | 42 |
| GO:001072010 | Esophagus | ESCC | positive regulation of cell development | 172/8552 | 298/18723 | 1.74e-05 | 1.55e-04 | 172 |
| GO:000941611 | Esophagus | ESCC | response to light stimulus | 183/8552 | 320/18723 | 2.03e-05 | 1.76e-04 | 183 |
| GO:005076710 | Esophagus | ESCC | regulation of neurogenesis | 203/8552 | 364/18723 | 6.10e-05 | 4.68e-04 | 203 |
| GO:00507697 | Esophagus | ESCC | positive regulation of neurogenesis | 131/8552 | 225/18723 | 9.71e-05 | 6.90e-04 | 131 |
| Page: 1 2 3 4 5 6 |
| Pathway ID | Tissue | Disease Stage | Description | Gene Ratio | Bg Ratio | pvalue | p.adjust | qvalue | Count |
| hsa0401518 | Oral cavity | OSCC | Rap1 signaling pathway | 107/3704 | 210/8465 | 2.01e-02 | 4.34e-02 | 2.21e-02 | 107 |
| hsa0401519 | Oral cavity | OSCC | Rap1 signaling pathway | 107/3704 | 210/8465 | 2.01e-02 | 4.34e-02 | 2.21e-02 | 107 |
| Page: 1 |
Top |
Cell-cell communication analysis |
| Identification of potential cell-cell interactions between two cell types and their ligand-receptor pairs for different disease states |
| Ligand | Receptor | LRpair | Pathway | Tissue | Disease Stage |
| Page: 1 |
Top |
Single-cell gene regulatory network inference analysis |
| Find out the significant the regulons (TFs) and the target genes of each regulon across cell types for different disease states |
| TF | Cell Type | Tissue | Disease Stage | Target Gene | RSS | Regulon Activity |
| ∗The dot plots of a searched regulon are shown for all cell subpopulations in each disease state of each tissue based on the regulon specific score inferred using pySCENIC and by calculating the average expression. |
| Page: 1 |
Top |
Somatic mutation of malignant transformation related genes |
| Annotation of somatic variants for genes involved in malignant transformation |
| Hugo Symbol | Variant Class | Variant Classification | dbSNP RS | HGVSc | HGVSp | HGVSp Short | SWISSPROT | BIOTYPE | SIFT | PolyPhen | Tumor Sample Barcode | Tissue | Histology | Sex | Age | Stage | Therapy Types | Drugs | Outcome |
| RGS14 | SNV | Missense_Mutation | c.1393N>T | p.Pro465Ser | p.P465S | O43566 | protein_coding | tolerated(0.24) | benign(0.065) | TCGA-A8-A09Z-01 | Breast | breast invasive carcinoma | Female | >=65 | I/II | Unknown | Unknown | SD | |
| RGS14 | SNV | Missense_Mutation | novel | c.121N>A | p.Leu41Ile | p.L41I | O43566 | protein_coding | tolerated(0.34) | benign(0.025) | TCGA-AN-A046-01 | Breast | breast invasive carcinoma | Female | >=65 | I/II | Unknown | Unknown | SD |
| RGS14 | SNV | Missense_Mutation | rs752794573 | c.1674G>C | p.Leu558Phe | p.L558F | O43566 | protein_coding | tolerated_low_confidence(0.73) | benign(0.07) | TCGA-AR-A0TX-01 | Breast | breast invasive carcinoma | Female | <65 | I/II | Unknown | Unknown | SD |
| RGS14 | SNV | Missense_Mutation | rs778150762 | c.103N>A | p.Glu35Lys | p.E35K | O43566 | protein_coding | tolerated(0.38) | benign(0.003) | TCGA-GM-A2D9-01 | Breast | breast invasive carcinoma | Female | >=65 | I/II | Hormone Therapy | arimidex | SD |
| RGS14 | SNV | Missense_Mutation | novel | c.1364A>C | p.Lys455Thr | p.K455T | O43566 | protein_coding | tolerated(0.6) | benign(0) | TCGA-2W-A8YY-01 | Cervix | cervical & endocervical cancer | Female | <65 | I/II | Chemotherapy | cisplatin | CR |
| RGS14 | SNV | Missense_Mutation | c.1125C>G | p.Phe375Leu | p.F375L | O43566 | protein_coding | deleterious(0.04) | benign(0.162) | TCGA-EK-A2H0-01 | Cervix | cervical & endocervical cancer | Female | <65 | I/II | Chemotherapy | cisplatin | CR | |
| RGS14 | SNV | Missense_Mutation | c.1567N>C | p.Glu523Gln | p.E523Q | O43566 | protein_coding | deleterious(0) | probably_damaging(0.994) | TCGA-Q1-A5R2-01 | Cervix | cervical & endocervical cancer | Female | <65 | I/II | Chemotherapy | cisplatin | PR | |
| RGS14 | SNV | Missense_Mutation | c.565G>C | p.Glu189Gln | p.E189Q | O43566 | protein_coding | tolerated(0.26) | benign(0.14) | TCGA-VS-A8EJ-01 | Cervix | cervical & endocervical cancer | Female | <65 | I/II | Chemotherapy | cisplatin | PD | |
| RGS14 | SNV | Missense_Mutation | c.1125N>G | p.Phe375Leu | p.F375L | O43566 | protein_coding | deleterious(0.04) | benign(0.162) | TCGA-ZJ-A8QQ-01 | Cervix | cervical & endocervical cancer | Female | <65 | I/II | Chemotherapy | cisplatin | SD | |
| RGS14 | SNV | Missense_Mutation | novel | c.581G>A | p.Arg194Gln | p.R194Q | O43566 | protein_coding | tolerated(0.14) | benign(0.18) | TCGA-5M-AAT6-01 | Colorectum | colon adenocarcinoma | Female | <65 | III/IV | Unknown | Unknown | PD |
| Page: 1 2 3 4 |
Top |
Related drugs of malignant transformation related genes |
| Identification of chemicals and drugs interact with genes involved in malignant transfromation |
| (DGIdb 4.0) |
| Entrez ID | Symbol | Category | Interaction Types | Drug Claim Name | Drug Name | PMIDs |
| Page: 1 |

Copyright 2023-Present -The University of Texas Health Science Center at Houston |