| Tissue | Expression Dynamics | Abbreviation |
| Breast | 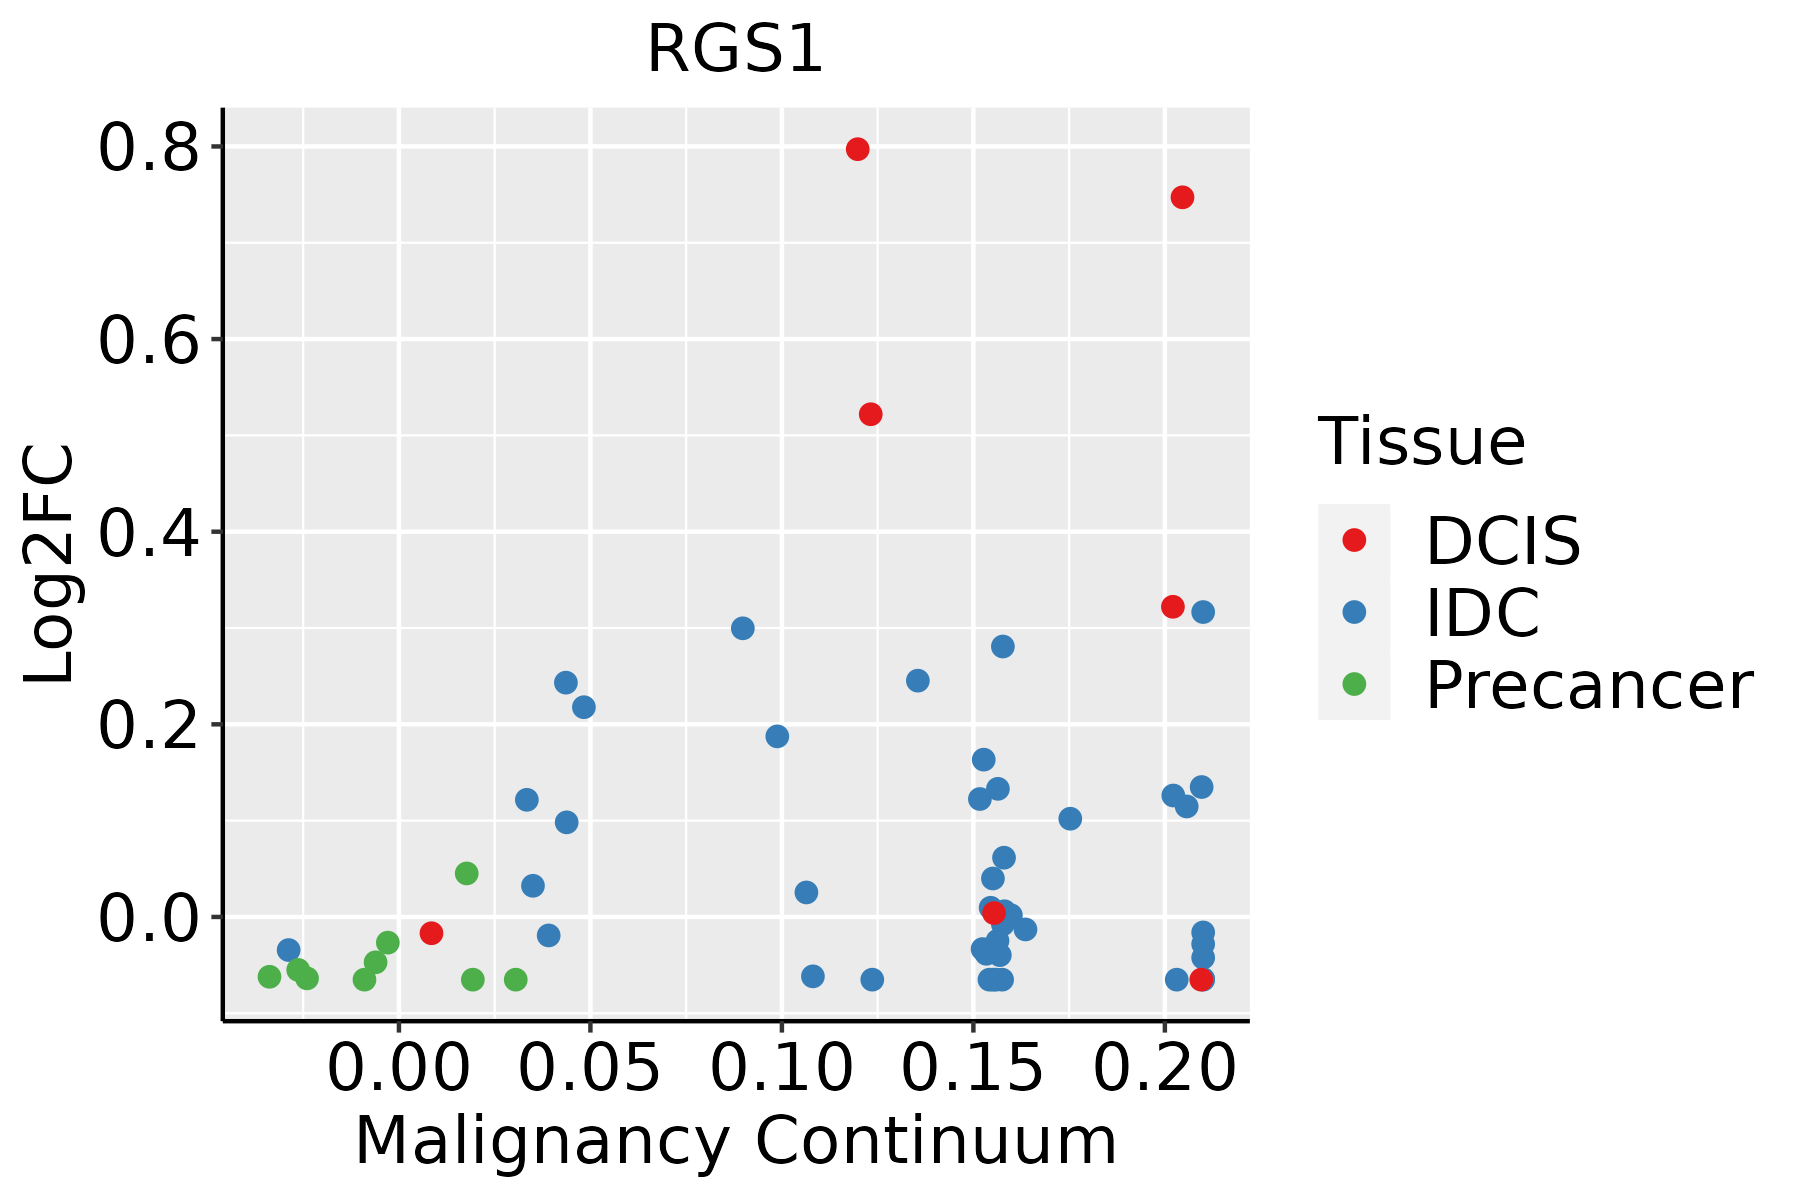 | IDC: Invasive ductal carcinoma |
| DCIS: Ductal carcinoma in situ |
| Precancer(BRCA1-mut): Precancerous lesion from BRCA1 mutation carriers |
| Cervix | 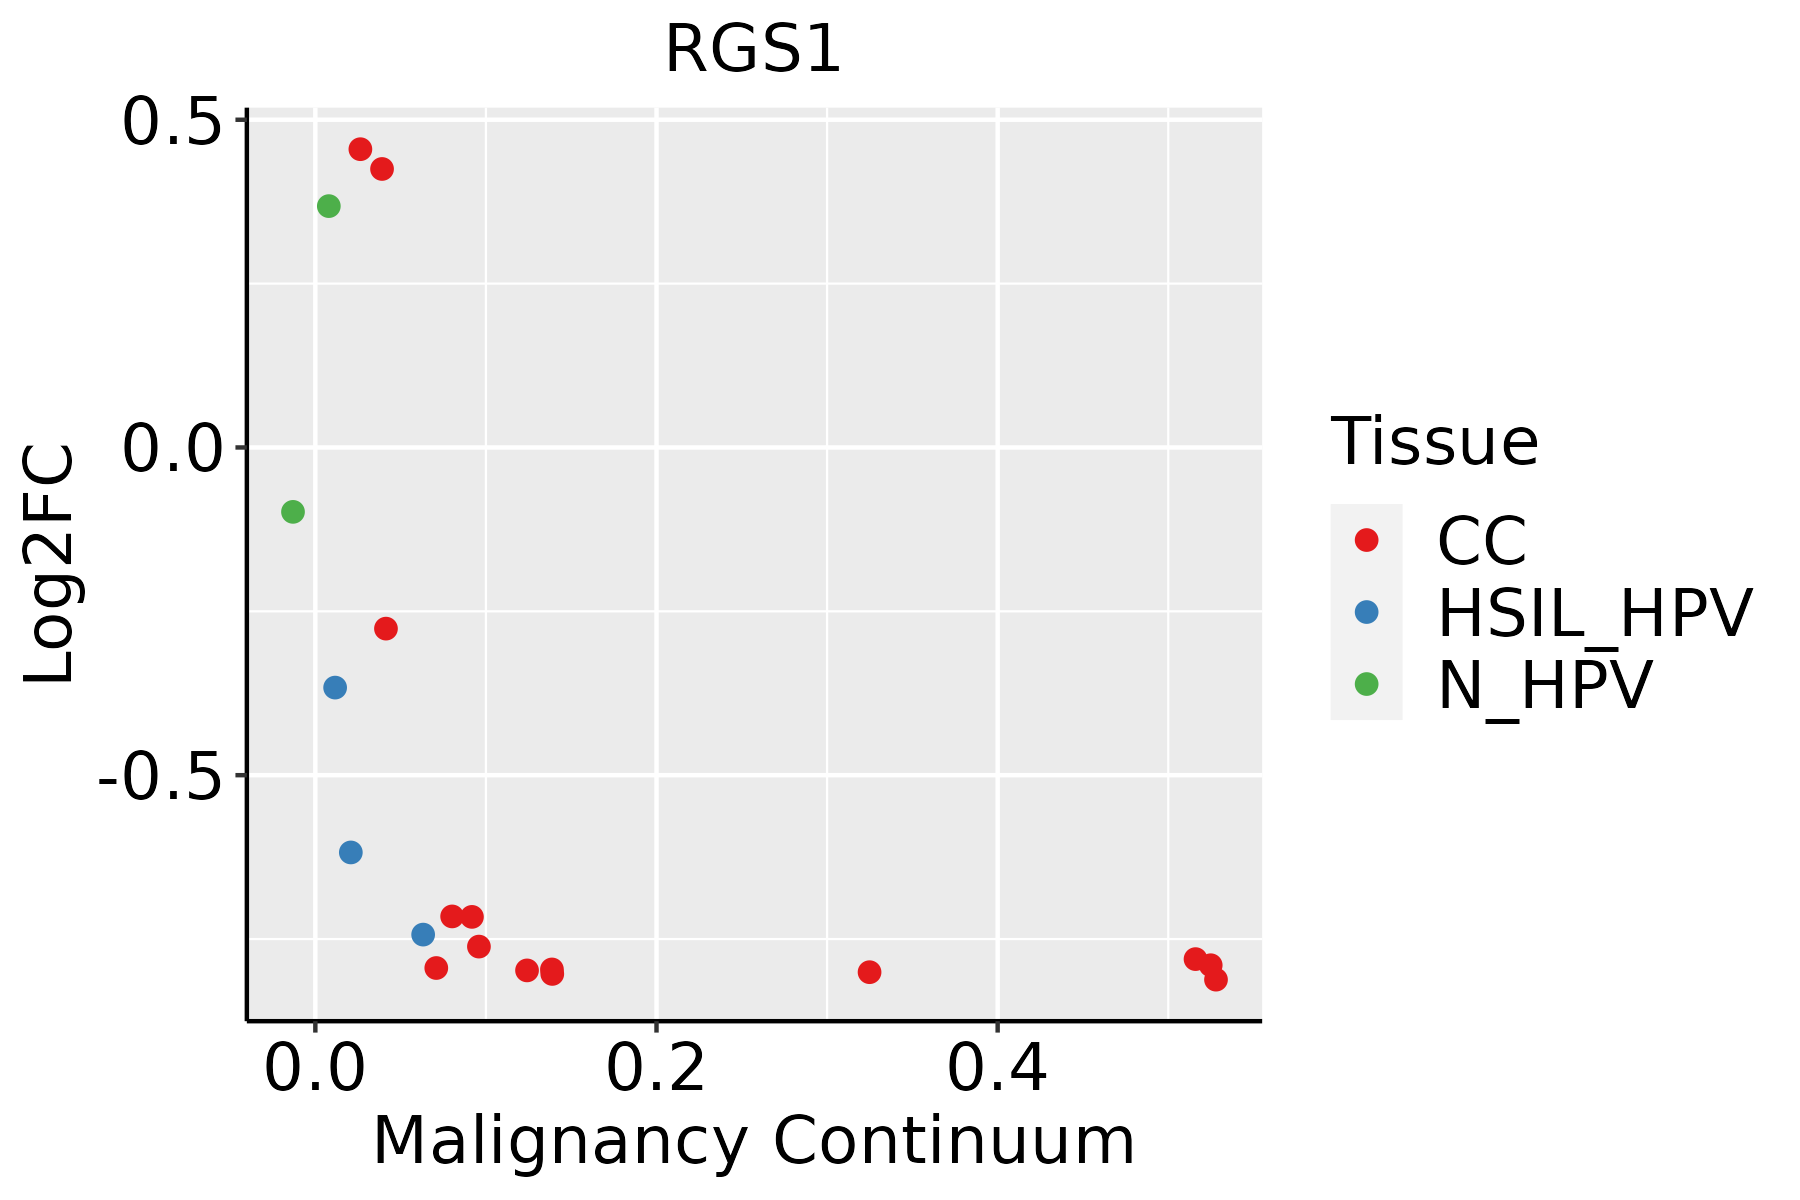 | CC: Cervix cancer |
| HSIL_HPV: HPV-infected high-grade squamous intraepithelial lesions |
| N_HPV: HPV-infected normal cervix |
| Esophagus |  | ESCC: Esophageal squamous cell carcinoma |
| HGIN: High-grade intraepithelial neoplasias |
| LGIN: Low-grade intraepithelial neoplasias |
| Oral Cavity |  | EOLP: Erosive Oral lichen planus |
| LP: leukoplakia |
| NEOLP: Non-erosive oral lichen planus |
| OSCC: Oral squamous cell carcinoma |
| Prostate | 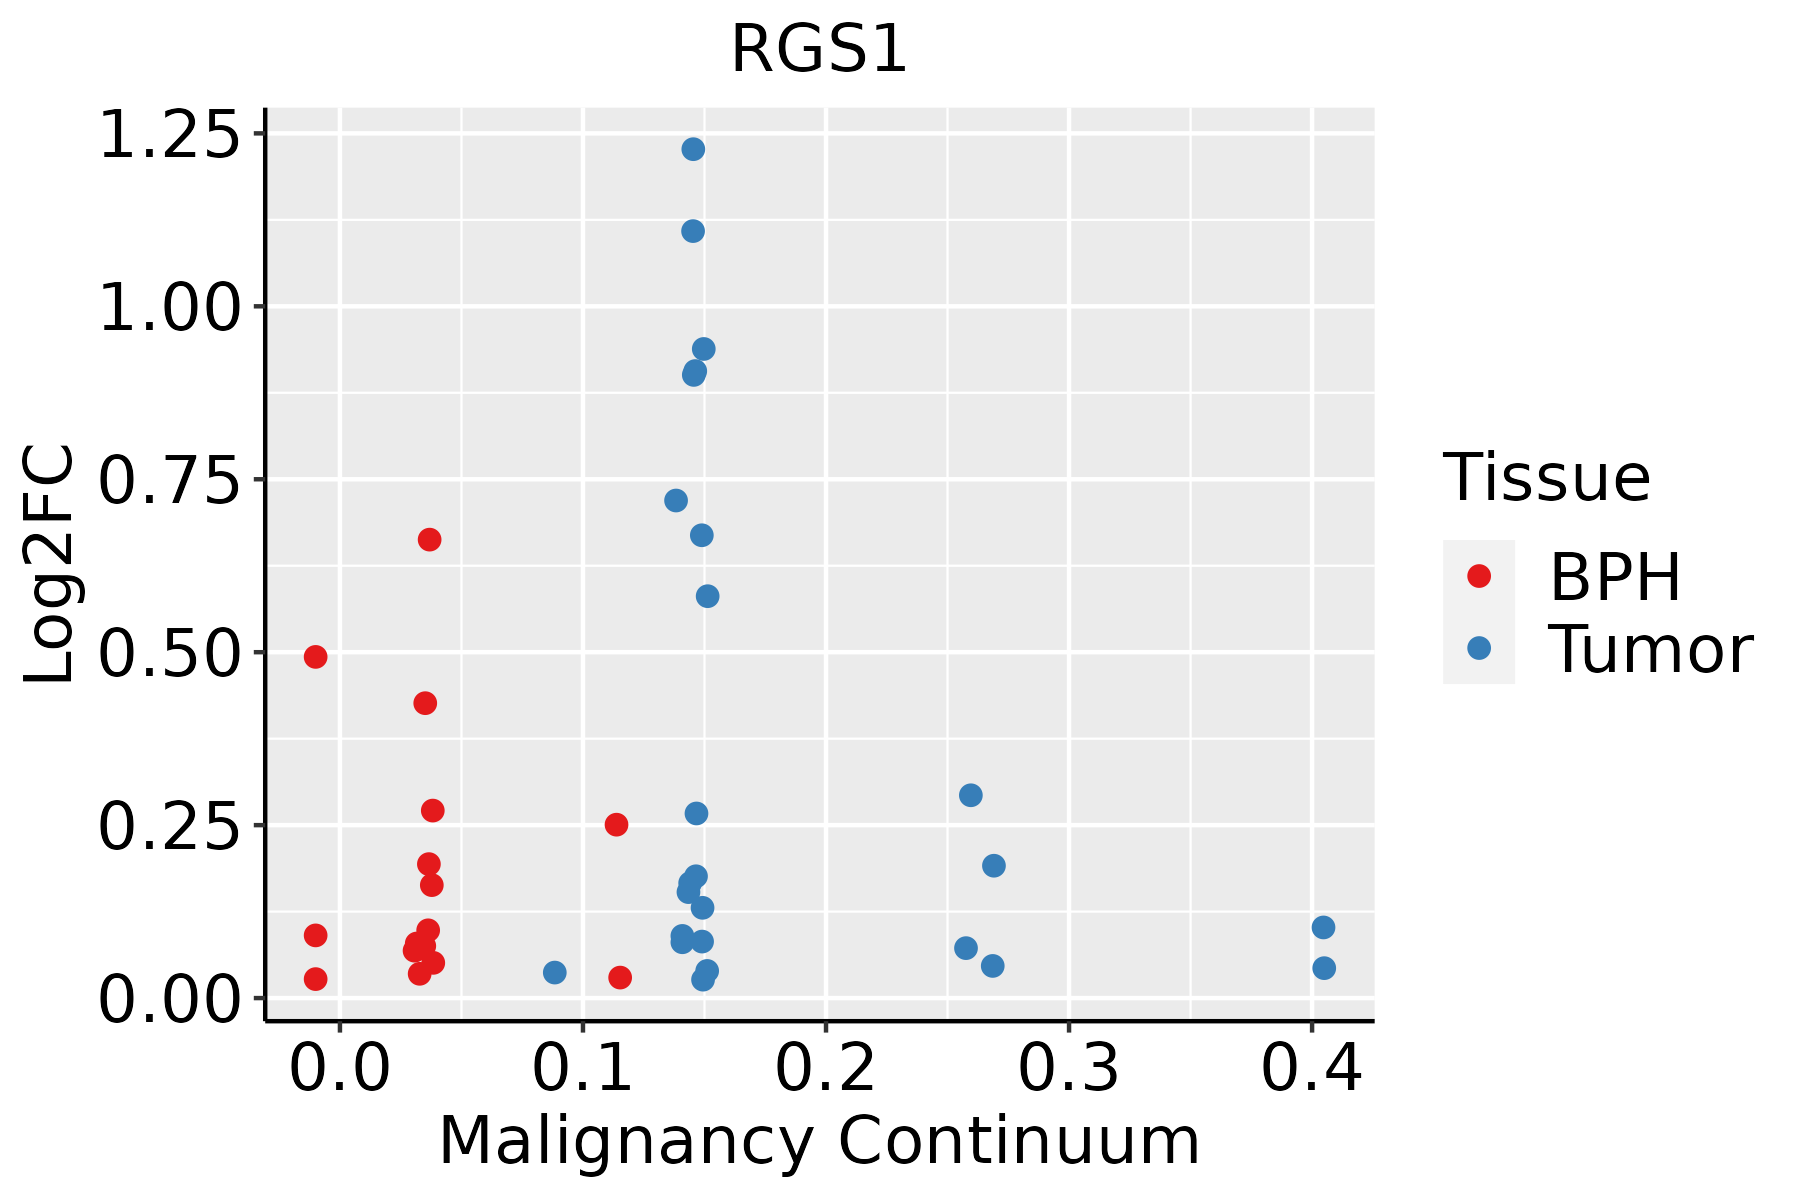 | BPH: Benign Prostatic Hyperplasia |
| Skin |  | AK: Actinic keratosis |
| cSCC: Cutaneous squamous cell carcinoma |
| SCCIS:squamous cell carcinoma in situ |
| Thyroid | 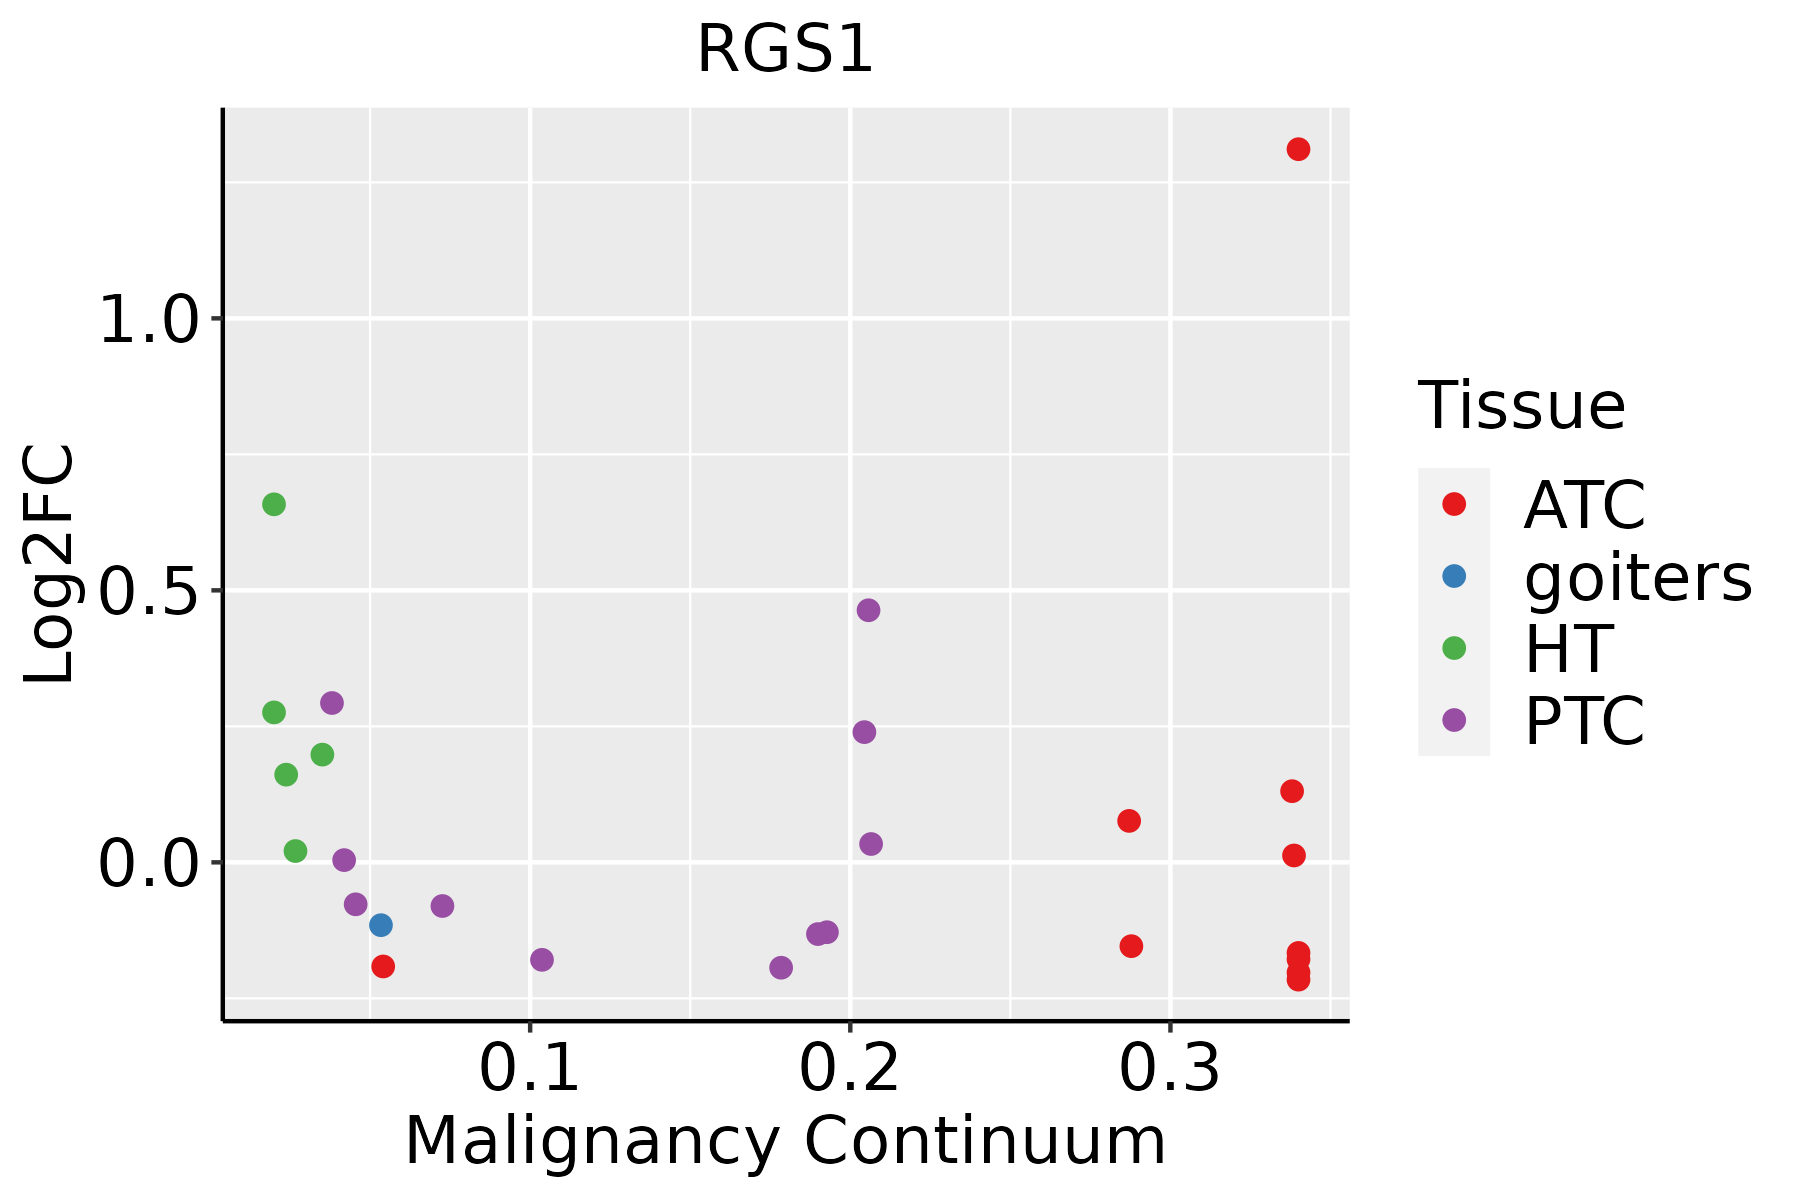 | ATC: Anaplastic thyroid cancer |
| HT: Hashimoto's thyroiditis |
| PTC: Papillary thyroid cancer |
| GO ID | Tissue | Disease Stage | Description | Gene Ratio | Bg Ratio | pvalue | p.adjust | Count |
| GO:00430877 | Cervix | CC | regulation of GTPase activity | 79/2311 | 348/18723 | 4.21e-08 | 2.60e-06 | 79 |
| GO:00435476 | Cervix | CC | positive regulation of GTPase activity | 53/2311 | 255/18723 | 8.72e-05 | 1.16e-03 | 53 |
| GO:00019752 | Cervix | CC | response to amphetamine | 10/2311 | 33/18723 | 5.07e-03 | 3.00e-02 | 10 |
| GO:00140754 | Cervix | CC | response to amine | 13/2311 | 49/18723 | 5.34e-03 | 3.10e-02 | 13 |
| GO:1905144 | Cervix | CC | response to acetylcholine | 9/2311 | 31/18723 | 1.04e-02 | 4.97e-02 | 9 |
| GO:1905145 | Cervix | CC | cellular response to acetylcholine | 9/2311 | 31/18723 | 1.04e-02 | 4.97e-02 | 9 |
| GO:001407511 | Cervix | HSIL_HPV | response to amine | 8/737 | 49/18723 | 5.99e-04 | 8.37e-03 | 8 |
| GO:00019751 | Cervix | HSIL_HPV | response to amphetamine | 6/737 | 33/18723 | 1.63e-03 | 1.77e-02 | 6 |
| GO:00430878 | Endometrium | AEH | regulation of GTPase activity | 66/2100 | 348/18723 | 1.26e-05 | 2.77e-04 | 66 |
| GO:00435477 | Endometrium | AEH | positive regulation of GTPase activity | 48/2100 | 255/18723 | 2.18e-04 | 2.67e-03 | 48 |
| GO:004308712 | Endometrium | EEC | regulation of GTPase activity | 67/2168 | 348/18723 | 1.84e-05 | 3.43e-04 | 67 |
| GO:004354712 | Endometrium | EEC | positive regulation of GTPase activity | 50/2168 | 255/18723 | 1.26e-04 | 1.66e-03 | 50 |
| GO:0006913110 | Esophagus | ESCC | nucleocytoplasmic transport | 230/8552 | 301/18723 | 6.04e-28 | 2.02e-25 | 230 |
| GO:0051169110 | Esophagus | ESCC | nuclear transport | 230/8552 | 301/18723 | 6.04e-28 | 2.02e-25 | 230 |
| GO:0006979111 | Esophagus | ESCC | response to oxidative stress | 303/8552 | 446/18723 | 7.15e-22 | 1.30e-19 | 303 |
| GO:000705911 | Esophagus | ESCC | chromosome segregation | 238/8552 | 346/18723 | 1.72e-18 | 1.82e-16 | 238 |
| GO:000705114 | Esophagus | ESCC | spindle organization | 134/8552 | 184/18723 | 5.70e-14 | 2.87e-12 | 134 |
| GO:0010563111 | Esophagus | ESCC | negative regulation of phosphorus metabolic process | 274/8552 | 442/18723 | 2.32e-12 | 9.41e-11 | 274 |
| GO:0045936111 | Esophagus | ESCC | negative regulation of phosphate metabolic process | 273/8552 | 441/18723 | 3.18e-12 | 1.25e-10 | 273 |
| GO:0051348111 | Esophagus | ESCC | negative regulation of transferase activity | 177/8552 | 268/18723 | 1.08e-11 | 4.00e-10 | 177 |
| Hugo Symbol | Variant Class | Variant Classification | dbSNP RS | HGVSc | HGVSp | HGVSp Short | SWISSPROT | BIOTYPE | SIFT | PolyPhen | Tumor Sample Barcode | Tissue | Histology | Sex | Age | Stage | Therapy Types | Drugs | Outcome |
| RGS1 | SNV | Missense_Mutation | novel | c.111A>C | p.Lys37Asn | p.K37N | Q08116 | protein_coding | tolerated(0.19) | benign(0.402) | TCGA-AN-A046-01 | Breast | breast invasive carcinoma | Female | >=65 | I/II | Unknown | Unknown | SD |
| RGS1 | SNV | Missense_Mutation | | c.513N>G | p.Phe171Leu | p.F171L | Q08116 | protein_coding | deleterious(0.04) | probably_damaging(0.993) | TCGA-AN-A0AL-01 | Breast | breast invasive carcinoma | Female | <65 | III/IV | Unknown | Unknown | SD |
| RGS1 | SNV | Missense_Mutation | novel | c.592N>C | p.Asn198His | p.N198H | Q08116 | protein_coding | deleterious(0.03) | benign(0.053) | TCGA-CA-6717-01 | Colorectum | colon adenocarcinoma | Male | <65 | I/II | Chemotherapy | oxaliplatin | CR |
| RGS1 | insertion | Frame_Shift_Ins | novel | c.121dupA | p.Arg41LysfsTer38 | p.R41Kfs*38 | Q08116 | protein_coding | | | TCGA-CM-6162-01 | Colorectum | colon adenocarcinoma | Female | <65 | III/IV | Chemotherapy | oxaliplatin | SD |
| RGS1 | SNV | Missense_Mutation | novel | c.145N>T | p.Asp49Tyr | p.D49Y | Q08116 | protein_coding | deleterious(0) | probably_damaging(0.921) | TCGA-A5-A0G2-01 | Endometrium | uterine corpus endometrioid carcinoma | Female | <65 | III/IV | Unknown | Unknown | SD |
| RGS1 | SNV | Missense_Mutation | rs758026916 | c.200N>A | p.Ser67Tyr | p.S67Y | Q08116 | protein_coding | tolerated(0.37) | benign(0.007) | TCGA-AJ-A5DW-01 | Endometrium | uterine corpus endometrioid carcinoma | Female | <65 | I/II | Unknown | Unknown | SD |
| RGS1 | SNV | Missense_Mutation | | c.598C>A | p.Leu200Ile | p.L200I | Q08116 | protein_coding | tolerated(0.43) | benign(0.003) | TCGA-AP-A056-01 | Endometrium | uterine corpus endometrioid carcinoma | Female | <65 | I/II | Unknown | Unknown | SD |
| RGS1 | SNV | Missense_Mutation | | c.16A>G | p.Ile6Val | p.I6V | Q08116 | protein_coding | tolerated_low_confidence(0.06) | benign(0) | TCGA-B5-A11E-01 | Endometrium | uterine corpus endometrioid carcinoma | Female | <65 | I/II | Unknown | Unknown | SD |
| RGS1 | SNV | Missense_Mutation | | c.265N>T | p.Leu89Phe | p.L89F | Q08116 | protein_coding | deleterious(0) | probably_damaging(0.999) | TCGA-BS-A0UF-01 | Endometrium | uterine corpus endometrioid carcinoma | Female | >=65 | I/II | Unknown | Unknown | SD |
| RGS1 | SNV | Missense_Mutation | novel | c.520N>T | p.Ala174Ser | p.A174S | Q08116 | protein_coding | deleterious(0.03) | probably_damaging(0.999) | TCGA-EO-A22U-01 | Endometrium | uterine corpus endometrioid carcinoma | Female | >=65 | I/II | Unknown | Unknown | SD |


