
|
|||||
|
 | |
| |
| |
| |
| |
| |
|
Gene: RGP1 |
Gene summary for RGP1 |
| Gene information | Species | Human | Gene symbol | RGP1 | Gene ID | 9827 |
| Gene name | RGP1 homolog, RAB6A GEF complex partner 1 | |
| Gene Alias | KIAA0258 | |
| Cytomap | 9p13.3 | |
| Gene Type | protein-coding | GO ID | GO:0006807 | UniProtAcc | A8K0K1 |
Top |
Malignant transformation analysis |
| Identification of the aberrant gene expression in precancerous and cancerous lesions by comparing the gene expression of stem-like cells in diseased tissues with normal stem cells |
| Entrez ID | Symbol | Replicates | Species | Organ | Tissue | Adj P-value | Log2FC | Malignancy |
| 9827 | RGP1 | C04 | Human | Oral cavity | OSCC | 6.10e-12 | 3.82e-01 | 0.2633 |
| 9827 | RGP1 | C21 | Human | Oral cavity | OSCC | 1.05e-17 | 4.53e-01 | 0.2678 |
| 9827 | RGP1 | C30 | Human | Oral cavity | OSCC | 1.95e-25 | 8.57e-01 | 0.3055 |
| 9827 | RGP1 | C38 | Human | Oral cavity | OSCC | 3.52e-03 | 2.84e-01 | 0.172 |
| 9827 | RGP1 | C43 | Human | Oral cavity | OSCC | 1.98e-06 | 9.41e-02 | 0.1704 |
| 9827 | RGP1 | C46 | Human | Oral cavity | OSCC | 4.38e-02 | 9.74e-02 | 0.1673 |
| 9827 | RGP1 | C51 | Human | Oral cavity | OSCC | 2.08e-14 | 4.17e-01 | 0.2674 |
| 9827 | RGP1 | C06 | Human | Oral cavity | OSCC | 2.47e-07 | 8.34e-01 | 0.2699 |
| 9827 | RGP1 | C08 | Human | Oral cavity | OSCC | 3.50e-02 | 6.22e-02 | 0.1919 |
| 9827 | RGP1 | SYSMH1 | Human | Oral cavity | OSCC | 5.26e-03 | 8.42e-02 | 0.1127 |
| 9827 | RGP1 | SYSMH2 | Human | Oral cavity | OSCC | 1.77e-03 | 1.02e-01 | 0.2326 |
| 9827 | RGP1 | SYSMH3 | Human | Oral cavity | OSCC | 1.96e-06 | 1.88e-01 | 0.2442 |
| 9827 | RGP1 | SYSMH5 | Human | Oral cavity | OSCC | 9.26e-07 | 8.48e-02 | 0.0647 |
| 9827 | RGP1 | SYSMH6 | Human | Oral cavity | OSCC | 8.35e-04 | 1.42e-01 | 0.1275 |
| Page: 1 |
| Tissue | Expression Dynamics | Abbreviation |
| Oral Cavity | 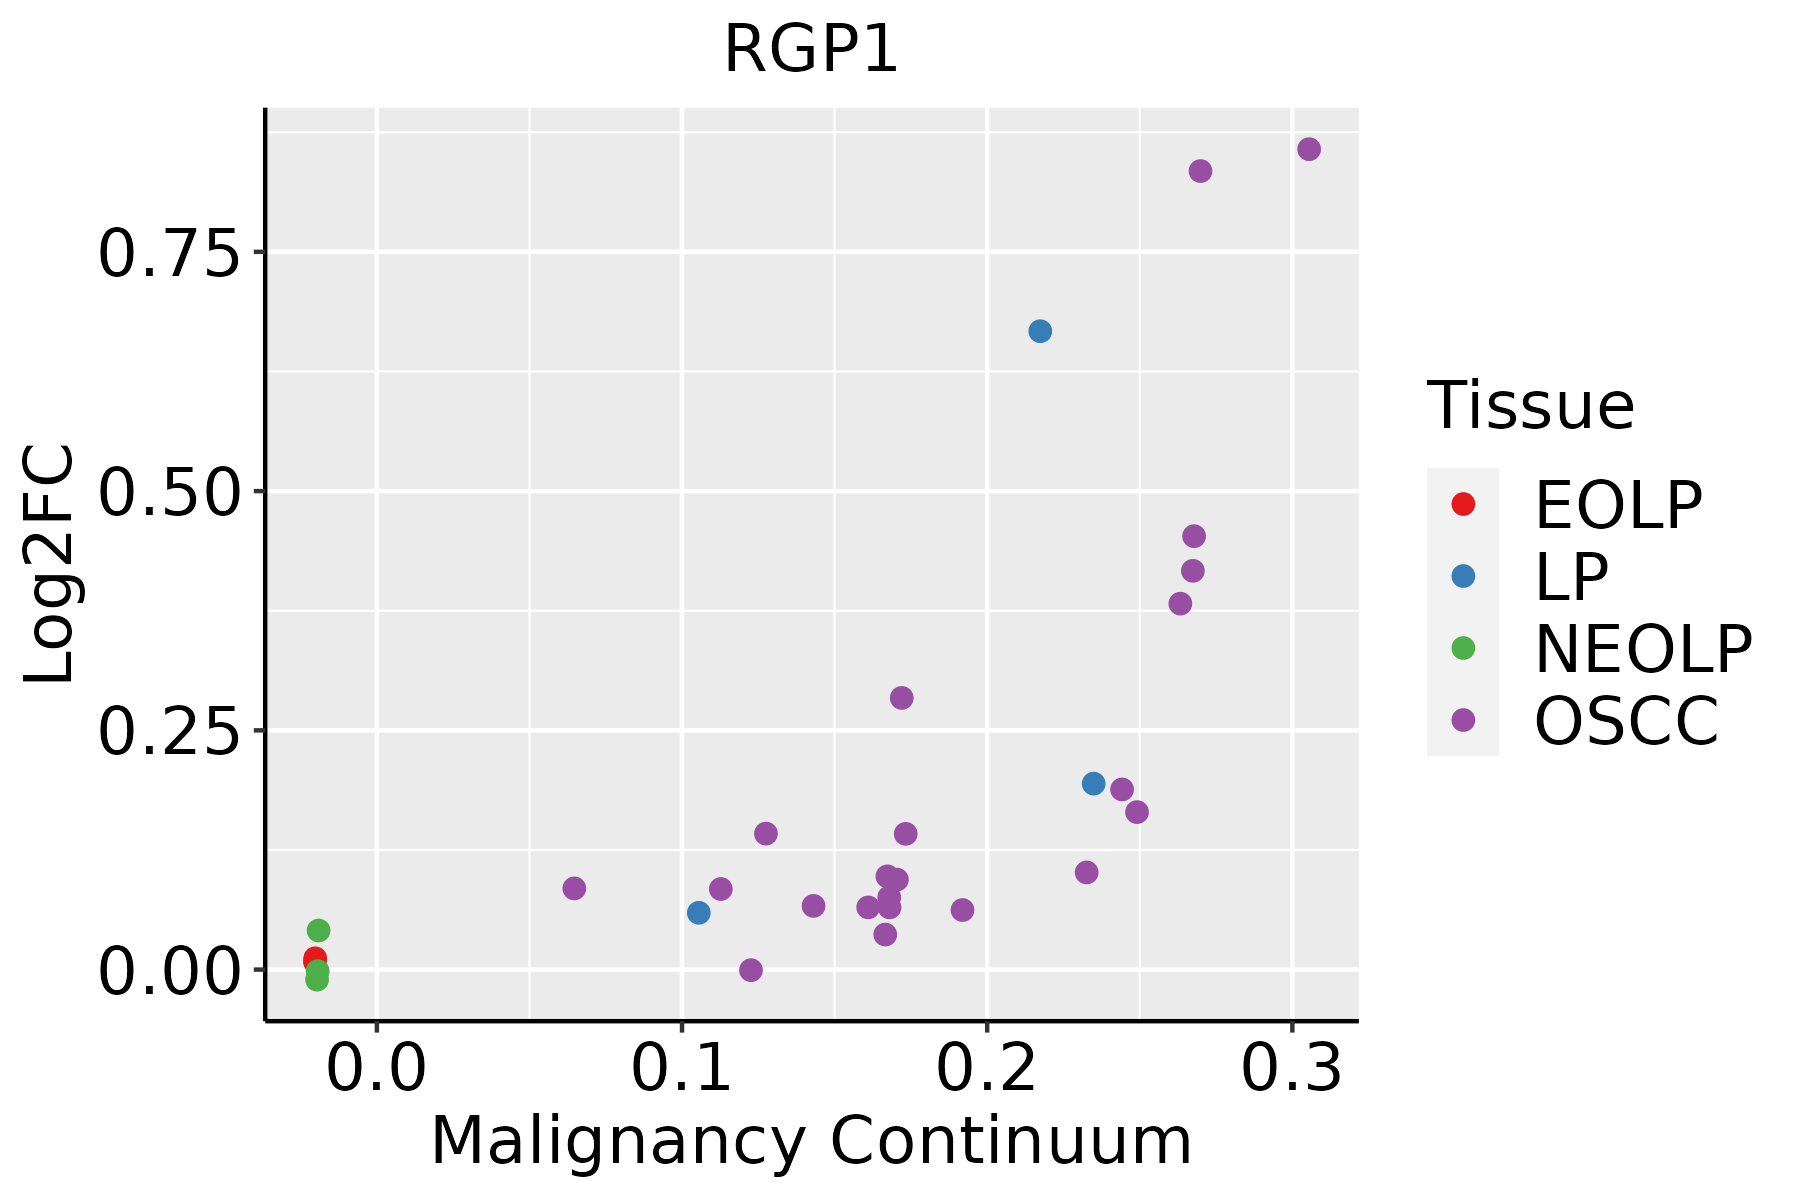 | EOLP: Erosive Oral lichen planus |
| LP: leukoplakia | ||
| NEOLP: Non-erosive oral lichen planus | ||
| OSCC: Oral squamous cell carcinoma |
| ∗log2FC in expression of this searched gene in stem-like cells from each diseased tissue sample relative to stem-like cells in normal samples in each tissue plotted against the malignancy continuum. Samples are colored based on if they are from different disease stage. |
Top |
Malignant transformation related pathway analysis |
| Find out the enriched GO biological processes and KEGG pathways involved in transition from healthy to precancer to cancer |
| Tissue | Disease Stage | Enriched GO biological Processes |
| Colorectum | AD |  |
| Colorectum | SER |  |
| Colorectum | MSS |  |
| Colorectum | MSI-H |  |
| Colorectum | FAP |  |
| ∗Top 15 enriched GO BP terms are showed in the bar plot of each disease state in each tissue. Each row represents a significant GO biological process which is colored according to the -log10(p.adjust). |
| Page: 1 2 3 4 5 6 7 8 9 |
| GO ID | Tissue | Disease Stage | Description | Gene Ratio | Bg Ratio | pvalue | p.adjust | Count |
| GO:004217620 | Oral cavity | OSCC | regulation of protein catabolic process | 254/7305 | 391/18723 | 1.07e-25 | 3.22e-23 | 254 |
| GO:190336220 | Oral cavity | OSCC | regulation of cellular protein catabolic process | 174/7305 | 255/18723 | 2.04e-21 | 3.70e-19 | 174 |
| GO:00161979 | Oral cavity | OSCC | endosomal transport | 141/7305 | 230/18723 | 5.40e-12 | 2.06e-10 | 141 |
| GO:00164829 | Oral cavity | OSCC | cytosolic transport | 106/7305 | 168/18723 | 2.08e-10 | 5.90e-09 | 106 |
| GO:000989519 | Oral cavity | OSCC | negative regulation of catabolic process | 180/7305 | 320/18723 | 2.44e-10 | 6.86e-09 | 180 |
| GO:003133020 | Oral cavity | OSCC | negative regulation of cellular catabolic process | 152/7305 | 262/18723 | 3.04e-10 | 8.28e-09 | 152 |
| GO:004217719 | Oral cavity | OSCC | negative regulation of protein catabolic process | 77/7305 | 121/18723 | 3.49e-08 | 6.64e-07 | 77 |
| GO:190336317 | Oral cavity | OSCC | negative regulation of cellular protein catabolic process | 49/7305 | 75/18723 | 3.49e-06 | 4.15e-05 | 49 |
| GO:00421476 | Oral cavity | OSCC | retrograde transport, endosome to Golgi | 55/7305 | 91/18723 | 2.79e-05 | 2.59e-04 | 55 |
| GO:004308710 | Oral cavity | OSCC | regulation of GTPase activity | 165/7305 | 348/18723 | 7.94e-04 | 4.27e-03 | 165 |
| Page: 1 |
| Pathway ID | Tissue | Disease Stage | Description | Gene Ratio | Bg Ratio | pvalue | p.adjust | qvalue | Count |
| Page: 1 |
Top |
Cell-cell communication analysis |
| Identification of potential cell-cell interactions between two cell types and their ligand-receptor pairs for different disease states |
| Ligand | Receptor | LRpair | Pathway | Tissue | Disease Stage |
| Page: 1 |
Top |
Single-cell gene regulatory network inference analysis |
| Find out the significant the regulons (TFs) and the target genes of each regulon across cell types for different disease states |
| TF | Cell Type | Tissue | Disease Stage | Target Gene | RSS | Regulon Activity |
| ∗The dot plots of a searched regulon are shown for all cell subpopulations in each disease state of each tissue based on the regulon specific score inferred using pySCENIC and by calculating the average expression. |
| Page: 1 |
Top |
Somatic mutation of malignant transformation related genes |
| Annotation of somatic variants for genes involved in malignant transformation |
| Hugo Symbol | Variant Class | Variant Classification | dbSNP RS | HGVSc | HGVSp | HGVSp Short | SWISSPROT | BIOTYPE | SIFT | PolyPhen | Tumor Sample Barcode | Tissue | Histology | Sex | Age | Stage | Therapy Types | Drugs | Outcome |
| RGP1 | SNV | Missense_Mutation | rs531150656 | c.893G>A | p.Arg298Lys | p.R298K | Q92546 | protein_coding | tolerated(0.65) | benign(0.017) | TCGA-A8-A08H-01 | Breast | breast invasive carcinoma | Female | >=65 | I/II | Unknown | Unknown | SD |
| RGP1 | SNV | Missense_Mutation | novel | c.1162A>C | p.Thr388Pro | p.T388P | Q92546 | protein_coding | deleterious(0.02) | benign(0.017) | TCGA-A8-A08H-01 | Breast | breast invasive carcinoma | Female | >=65 | I/II | Unknown | Unknown | SD |
| RGP1 | SNV | Missense_Mutation | novel | c.257N>T | p.Glu86Val | p.E86V | Q92546 | protein_coding | deleterious(0) | possibly_damaging(0.872) | TCGA-A8-A0A1-01 | Breast | breast invasive carcinoma | Female | >=65 | I/II | Hormone Therapy | tamoxiphen | SD |
| RGP1 | SNV | Missense_Mutation | c.1075N>C | p.Asp359His | p.D359H | Q92546 | protein_coding | deleterious(0) | possibly_damaging(0.898) | TCGA-AC-A23H-01 | Breast | breast invasive carcinoma | Female | >=65 | I/II | Unknown | Unknown | PD | |
| RGP1 | insertion | Frame_Shift_Ins | novel | c.604_605insCTGGGCTTGG | p.Leu202ProfsTer20 | p.L202Pfs*20 | Q92546 | protein_coding | TCGA-BH-A0HK-01 | Breast | breast invasive carcinoma | Female | >=65 | I/II | Hormone Therapy | arimidex | SD | ||
| RGP1 | insertion | Frame_Shift_Ins | novel | c.606_607insCAGCCCTATATCCAAGAGGCAAATG | p.Met203GlnfsTer24 | p.M203Qfs*24 | Q92546 | protein_coding | TCGA-BH-A0HK-01 | Breast | breast invasive carcinoma | Female | >=65 | I/II | Hormone Therapy | arimidex | SD | ||
| RGP1 | insertion | Frame_Shift_Ins | novel | c.341_342insTCACCTAGGGCCTCCTGGGTCTCCTCTGGGCACGGGGAGCTGGGTG | p.Tyr115HisfsTer18 | p.Y115Hfs*18 | Q92546 | protein_coding | TCGA-C8-A12P-01 | Breast | breast invasive carcinoma | Female | <65 | I/II | Unknown | Unknown | SD | ||
| RGP1 | SNV | Missense_Mutation | novel | c.1118N>A | p.Ser373Asn | p.S373N | Q92546 | protein_coding | tolerated(1) | benign(0) | TCGA-2W-A8YY-01 | Cervix | cervical & endocervical cancer | Female | <65 | I/II | Chemotherapy | cisplatin | CR |
| RGP1 | SNV | Missense_Mutation | novel | c.296T>G | p.Leu99Arg | p.L99R | Q92546 | protein_coding | deleterious(0) | probably_damaging(0.997) | TCGA-A6-3808-01 | Colorectum | colon adenocarcinoma | Male | >=65 | I/II | Unknown | Unknown | SD |
| RGP1 | SNV | Missense_Mutation | rs374070771 | c.399N>T | p.Lys133Asn | p.K133N | Q92546 | protein_coding | deleterious(0) | probably_damaging(0.983) | TCGA-AA-3492-01 | Colorectum | colon adenocarcinoma | Female | >=65 | I/II | Unknown | Unknown | SD |
| Page: 1 2 3 4 5 |
Top |
Related drugs of malignant transformation related genes |
| Identification of chemicals and drugs interact with genes involved in malignant transfromation |
| (DGIdb 4.0) |
| Entrez ID | Symbol | Category | Interaction Types | Drug Claim Name | Drug Name | PMIDs |
| Page: 1 |

Copyright 2023-Present -The University of Texas Health Science Center at Houston |