
|
|||||
|
 | |
| |
| |
| |
| |
| |
|
Gene: RGMB |
Gene summary for RGMB |
| Gene information | Species | Human | Gene symbol | RGMB | Gene ID | 285704 |
| Gene name | repulsive guidance molecule BMP co-receptor b | |
| Gene Alias | DRAGON | |
| Cytomap | 5q15 | |
| Gene Type | protein-coding | GO ID | GO:0006139 | UniProtAcc | J3KNF6 |
Top |
Malignant transformation analysis |
| Identification of the aberrant gene expression in precancerous and cancerous lesions by comparing the gene expression of stem-like cells in diseased tissues with normal stem cells |
| Entrez ID | Symbol | Replicates | Species | Organ | Tissue | Adj P-value | Log2FC | Malignancy |
| 285704 | RGMB | HTA11_3410_2000001011 | Human | Colorectum | AD | 1.90e-10 | -2.83e-01 | 0.0155 |
| 285704 | RGMB | HTA11_2487_2000001011 | Human | Colorectum | SER | 6.37e-09 | -5.50e-01 | -0.1808 |
| 285704 | RGMB | HTA11_1938_2000001011 | Human | Colorectum | AD | 1.61e-07 | -4.62e-01 | -0.0811 |
| 285704 | RGMB | HTA11_78_2000001011 | Human | Colorectum | AD | 4.30e-11 | -5.41e-01 | -0.1088 |
| 285704 | RGMB | HTA11_347_2000001011 | Human | Colorectum | AD | 6.27e-03 | -3.26e-01 | -0.1954 |
| 285704 | RGMB | HTA11_3361_2000001011 | Human | Colorectum | AD | 8.28e-05 | -5.37e-01 | -0.1207 |
| 285704 | RGMB | HTA11_83_2000001011 | Human | Colorectum | SER | 1.28e-03 | -5.31e-01 | -0.1526 |
| 285704 | RGMB | HTA11_866_2000001011 | Human | Colorectum | AD | 1.02e-11 | -4.74e-01 | -0.1001 |
| 285704 | RGMB | HTA11_1391_2000001011 | Human | Colorectum | AD | 6.84e-04 | -4.09e-01 | -0.059 |
| 285704 | RGMB | HTA11_866_3004761011 | Human | Colorectum | AD | 3.62e-09 | -3.44e-01 | 0.096 |
| 285704 | RGMB | HTA11_10711_2000001011 | Human | Colorectum | AD | 1.45e-08 | -1.06e-01 | 0.0338 |
| 285704 | RGMB | HTA11_11156_2000001011 | Human | Colorectum | AD | 3.25e-05 | 1.48e-01 | 0.0397 |
| 285704 | RGMB | HTA11_6818_2000001021 | Human | Colorectum | AD | 2.14e-06 | -5.24e-01 | 0.0588 |
| 285704 | RGMB | HTA11_99999970781_79442 | Human | Colorectum | MSS | 1.90e-11 | -4.15e-01 | 0.294 |
| 285704 | RGMB | HTA11_99999965104_69814 | Human | Colorectum | MSS | 1.11e-04 | -3.55e-01 | 0.281 |
| 285704 | RGMB | HTA11_99999971662_82457 | Human | Colorectum | MSS | 1.20e-20 | -5.97e-01 | 0.3859 |
| 285704 | RGMB | HTA11_99999973899_84307 | Human | Colorectum | MSS | 6.38e-05 | -5.69e-01 | 0.2585 |
| 285704 | RGMB | HTA11_99999974143_84620 | Human | Colorectum | MSS | 3.27e-25 | -6.54e-01 | 0.3005 |
| 285704 | RGMB | A015-C-203 | Human | Colorectum | FAP | 3.48e-07 | 1.50e-02 | -0.1294 |
| 285704 | RGMB | A002-C-201 | Human | Colorectum | FAP | 3.99e-03 | -1.25e-01 | 0.0324 |
| Page: 1 2 3 4 5 6 |
| Tissue | Expression Dynamics | Abbreviation |
| Colorectum (GSE201348) |  | FAP: Familial adenomatous polyposis |
| CRC: Colorectal cancer | ||
| Colorectum (HTA11) | 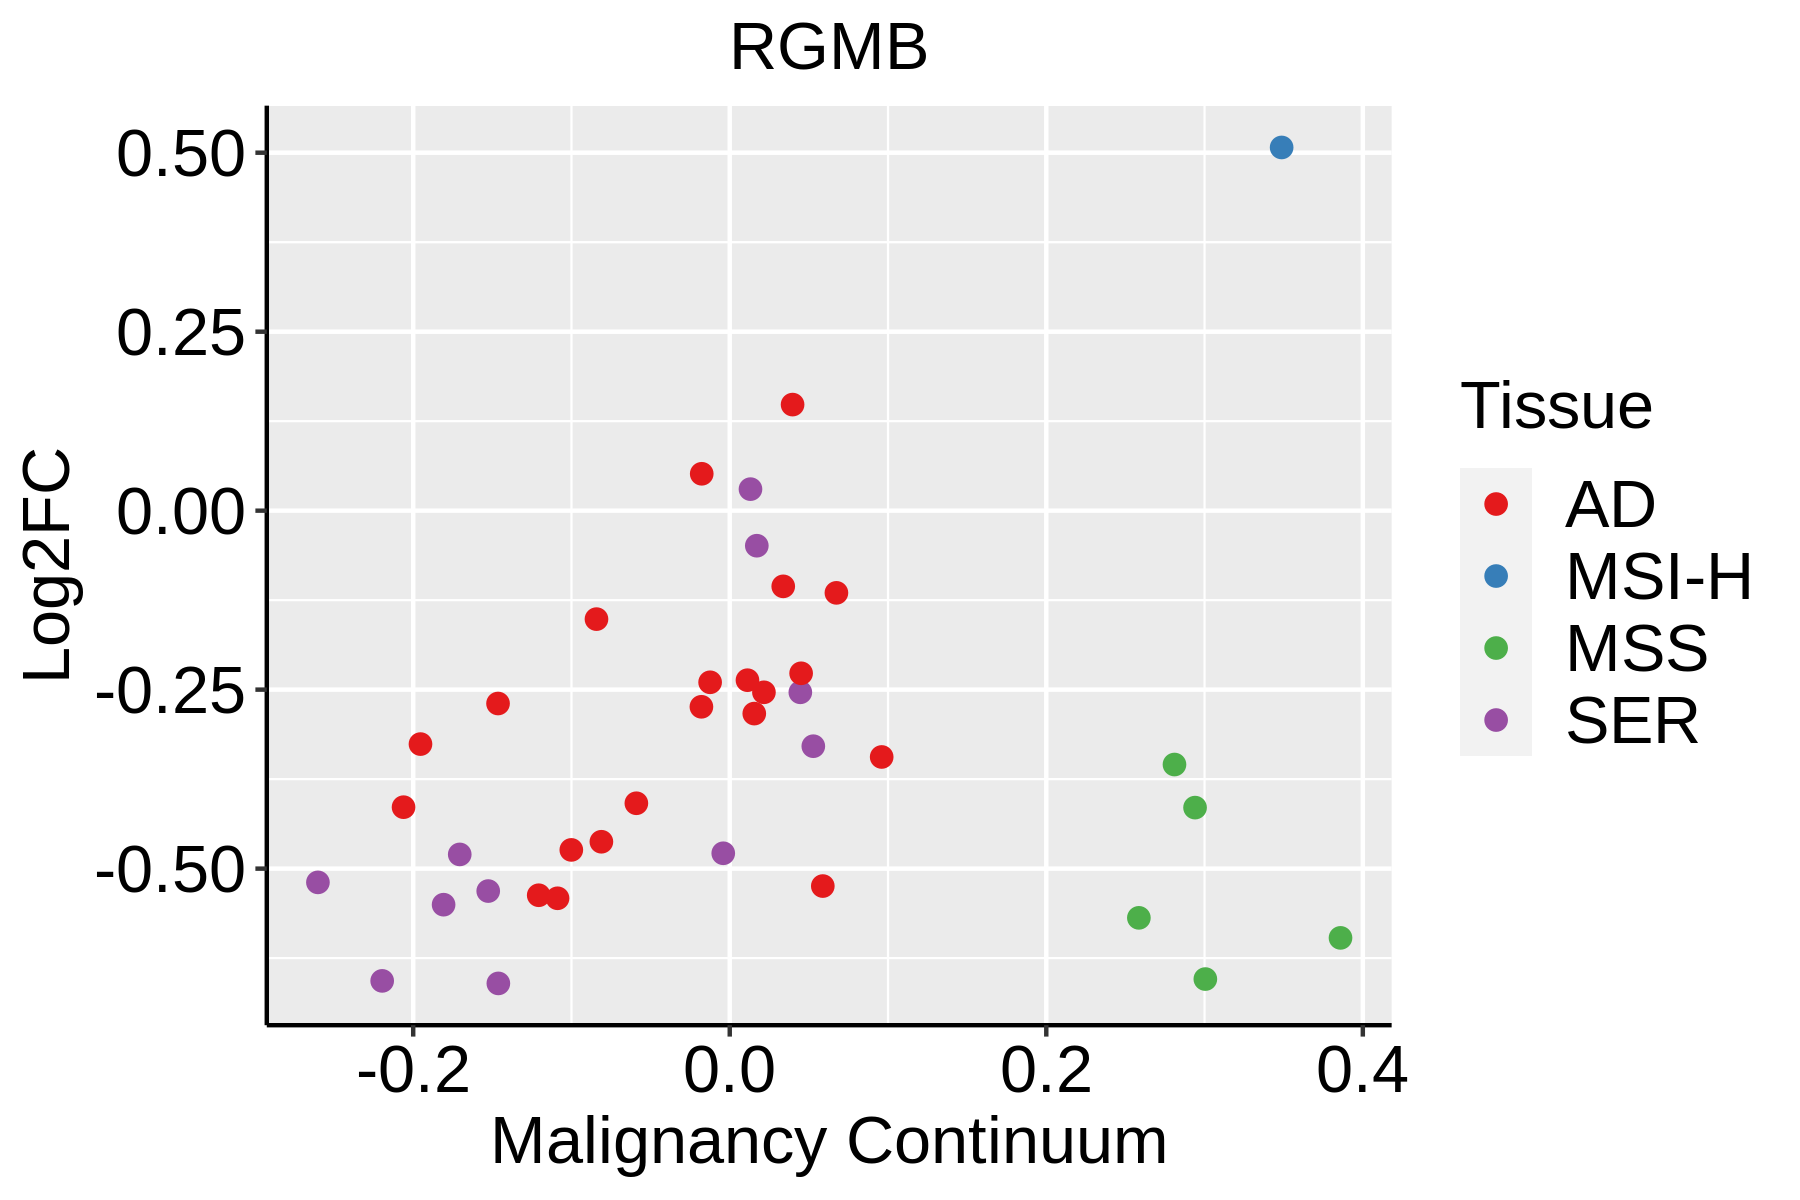 | AD: Adenomas |
| SER: Sessile serrated lesions | ||
| MSI-H: Microsatellite-high colorectal cancer | ||
| MSS: Microsatellite stable colorectal cancer | ||
| Esophagus | 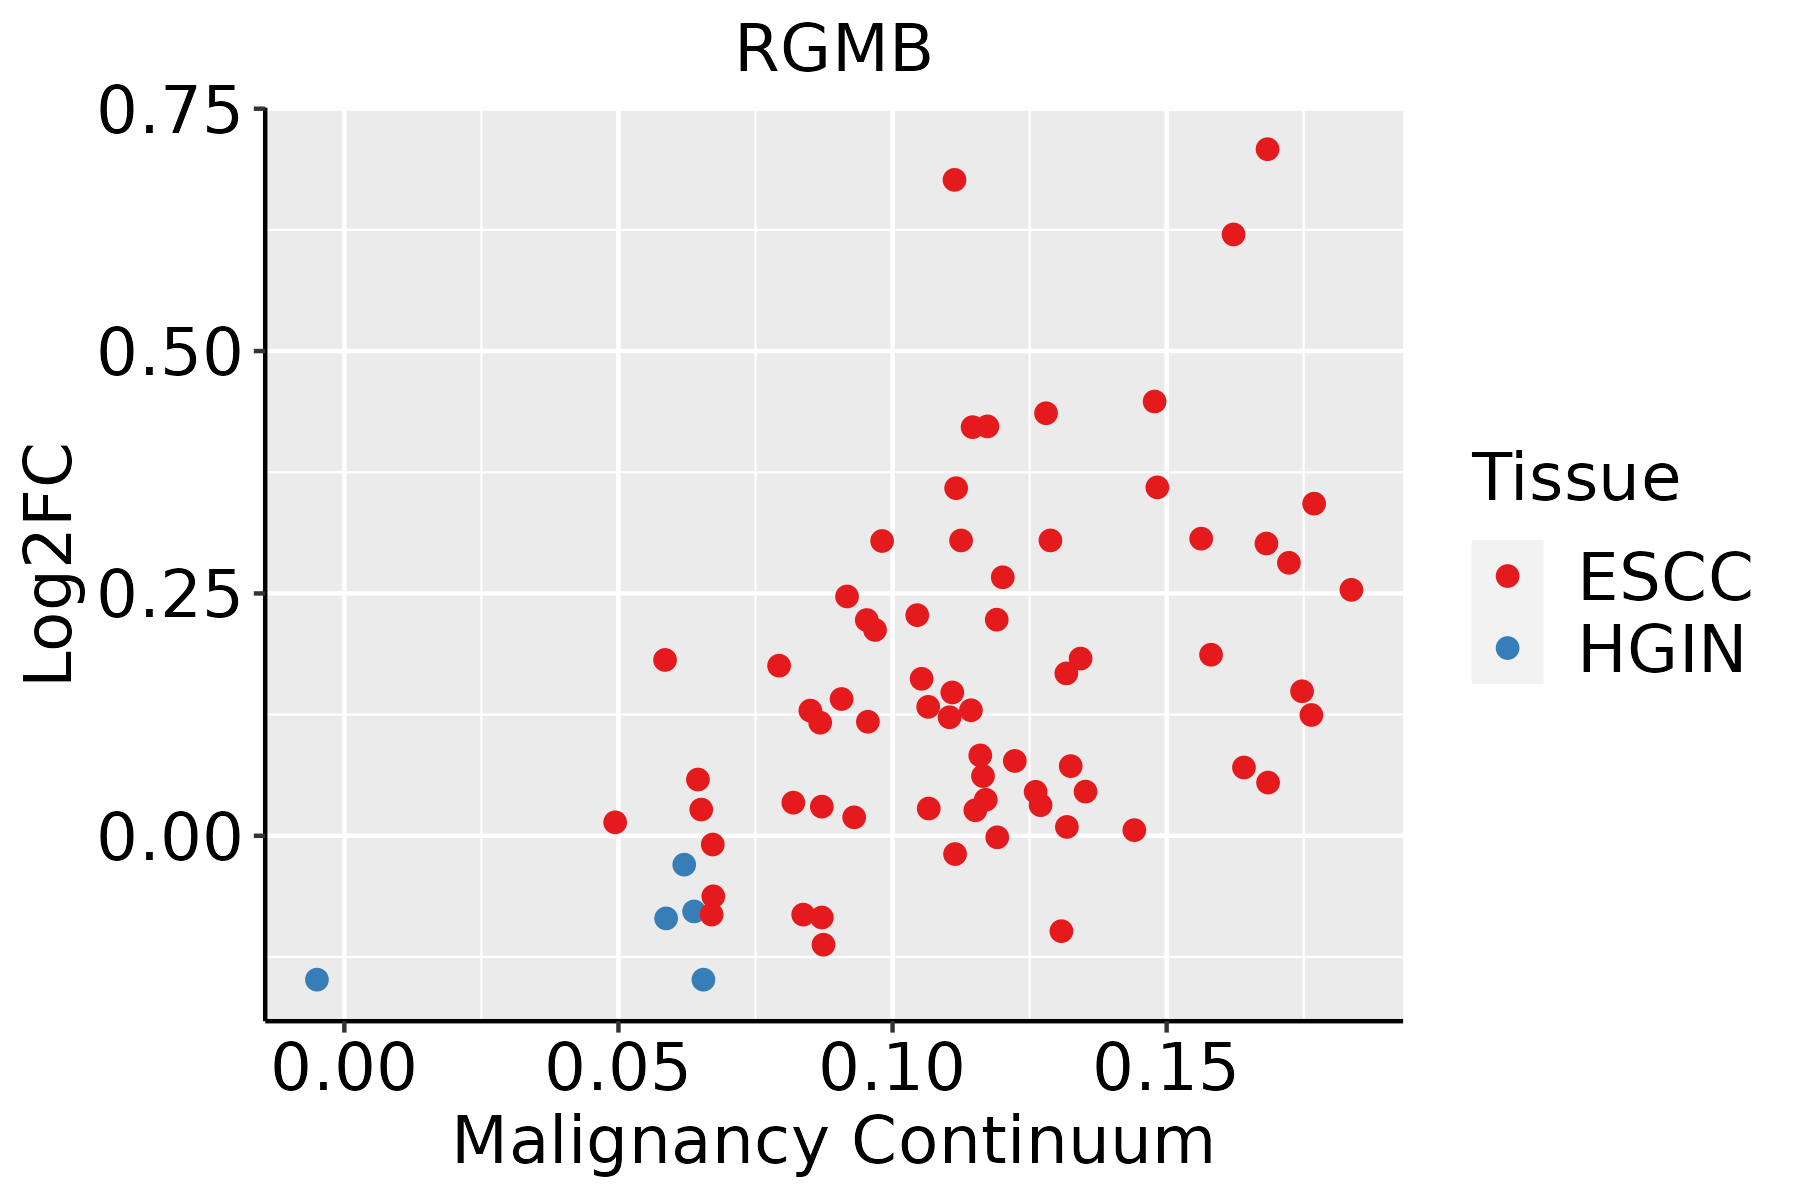 | ESCC: Esophageal squamous cell carcinoma |
| HGIN: High-grade intraepithelial neoplasias | ||
| LGIN: Low-grade intraepithelial neoplasias | ||
| Thyroid | 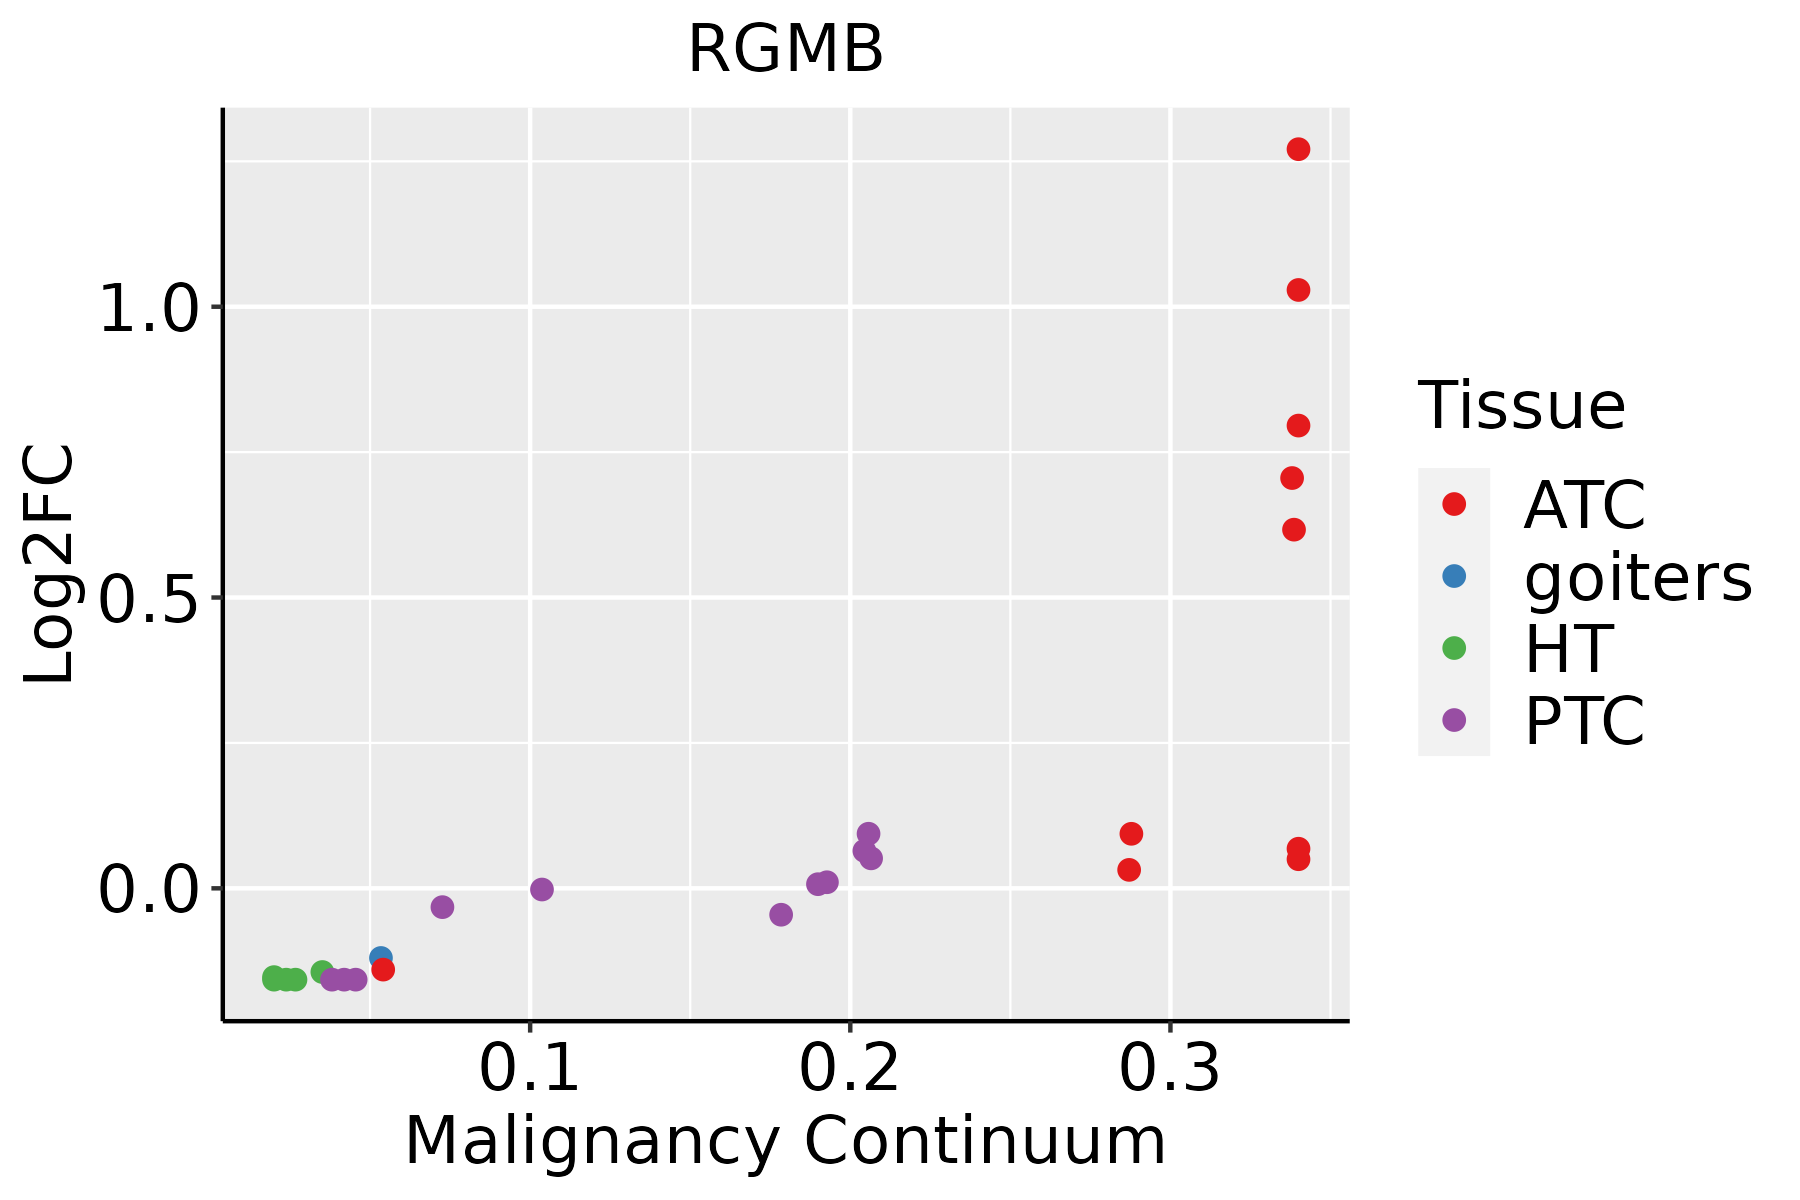 | ATC: Anaplastic thyroid cancer |
| HT: Hashimoto's thyroiditis | ||
| PTC: Papillary thyroid cancer |
| ∗log2FC in expression of this searched gene in stem-like cells from each diseased tissue sample relative to stem-like cells in normal samples in each tissue plotted against the malignancy continuum. Samples are colored based on if they are from different disease stage. |
Top |
Malignant transformation related pathway analysis |
| Find out the enriched GO biological processes and KEGG pathways involved in transition from healthy to precancer to cancer |
| Tissue | Disease Stage | Enriched GO biological Processes |
| Colorectum | AD |  |
| Colorectum | SER |  |
| Colorectum | MSS |  |
| Colorectum | MSI-H |  |
| Colorectum | FAP |  |
| ∗Top 15 enriched GO BP terms are showed in the bar plot of each disease state in each tissue. Each row represents a significant GO biological process which is colored according to the -log10(p.adjust). |
| Page: 1 2 3 4 5 6 7 8 9 |
| GO ID | Tissue | Disease Stage | Description | Gene Ratio | Bg Ratio | pvalue | p.adjust | Count |
| GO:0007178 | Colorectum | AD | transmembrane receptor protein serine/threonine kinase signaling pathway | 99/3918 | 355/18723 | 9.92e-04 | 9.28e-03 | 99 |
| GO:00071781 | Colorectum | MSS | transmembrane receptor protein serine/threonine kinase signaling pathway | 86/3467 | 355/18723 | 4.04e-03 | 2.95e-02 | 86 |
| GO:00071782 | Colorectum | FAP | transmembrane receptor protein serine/threonine kinase signaling pathway | 81/2622 | 355/18723 | 4.28e-06 | 1.46e-04 | 81 |
| GO:0071772 | Colorectum | FAP | response to BMP | 37/2622 | 165/18723 | 2.20e-03 | 1.80e-02 | 37 |
| GO:0071773 | Colorectum | FAP | cellular response to BMP stimulus | 37/2622 | 165/18723 | 2.20e-03 | 1.80e-02 | 37 |
| GO:0030509 | Colorectum | FAP | BMP signaling pathway | 34/2622 | 152/18723 | 3.38e-03 | 2.47e-02 | 34 |
| GO:00071783 | Colorectum | CRC | transmembrane receptor protein serine/threonine kinase signaling pathway | 66/2078 | 355/18723 | 1.74e-05 | 5.28e-04 | 66 |
| GO:00305091 | Colorectum | CRC | BMP signaling pathway | 31/2078 | 152/18723 | 5.73e-04 | 7.89e-03 | 31 |
| GO:00717721 | Colorectum | CRC | response to BMP | 32/2078 | 165/18723 | 1.16e-03 | 1.33e-02 | 32 |
| GO:00717731 | Colorectum | CRC | cellular response to BMP stimulus | 32/2078 | 165/18723 | 1.16e-03 | 1.33e-02 | 32 |
| GO:000717810 | Esophagus | ESCC | transmembrane receptor protein serine/threonine kinase signaling pathway | 195/8552 | 355/18723 | 2.58e-04 | 1.58e-03 | 195 |
| GO:000717818 | Thyroid | HT | transmembrane receptor protein serine/threonine kinase signaling pathway | 42/1272 | 355/18723 | 3.21e-04 | 4.20e-03 | 42 |
| GO:000717819 | Thyroid | PTC | transmembrane receptor protein serine/threonine kinase signaling pathway | 156/5968 | 355/18723 | 1.02e-06 | 1.51e-05 | 156 |
| GO:000717823 | Thyroid | ATC | transmembrane receptor protein serine/threonine kinase signaling pathway | 170/6293 | 355/18723 | 1.40e-08 | 2.87e-07 | 170 |
| GO:00717726 | Thyroid | ATC | response to BMP | 72/6293 | 165/18723 | 4.50e-03 | 1.86e-02 | 72 |
| GO:00717736 | Thyroid | ATC | cellular response to BMP stimulus | 72/6293 | 165/18723 | 4.50e-03 | 1.86e-02 | 72 |
| GO:00305095 | Thyroid | ATC | BMP signaling pathway | 66/6293 | 152/18723 | 7.23e-03 | 2.85e-02 | 66 |
| Page: 1 |
| Pathway ID | Tissue | Disease Stage | Description | Gene Ratio | Bg Ratio | pvalue | p.adjust | qvalue | Count |
| hsa04350 | Colorectum | SER | TGF-beta signaling pathway | 31/1580 | 108/8465 | 7.00e-03 | 3.77e-02 | 2.74e-02 | 31 |
| hsa043501 | Colorectum | SER | TGF-beta signaling pathway | 31/1580 | 108/8465 | 7.00e-03 | 3.77e-02 | 2.74e-02 | 31 |
| hsa043507 | Esophagus | ESCC | TGF-beta signaling pathway | 69/4205 | 108/8465 | 1.92e-03 | 5.54e-03 | 2.84e-03 | 69 |
| hsa0435014 | Esophagus | ESCC | TGF-beta signaling pathway | 69/4205 | 108/8465 | 1.92e-03 | 5.54e-03 | 2.84e-03 | 69 |
| Page: 1 |
Top |
Cell-cell communication analysis |
| Identification of potential cell-cell interactions between two cell types and their ligand-receptor pairs for different disease states |
| Ligand | Receptor | LRpair | Pathway | Tissue | Disease Stage |
| Page: 1 |
Top |
Single-cell gene regulatory network inference analysis |
| Find out the significant the regulons (TFs) and the target genes of each regulon across cell types for different disease states |
| TF | Cell Type | Tissue | Disease Stage | Target Gene | RSS | Regulon Activity |
| ∗The dot plots of a searched regulon are shown for all cell subpopulations in each disease state of each tissue based on the regulon specific score inferred using pySCENIC and by calculating the average expression. |
| Page: 1 |
Top |
Somatic mutation of malignant transformation related genes |
| Annotation of somatic variants for genes involved in malignant transformation |
| Hugo Symbol | Variant Class | Variant Classification | dbSNP RS | HGVSc | HGVSp | HGVSp Short | SWISSPROT | BIOTYPE | SIFT | PolyPhen | Tumor Sample Barcode | Tissue | Histology | Sex | Age | Stage | Therapy Types | Drugs | Outcome |
| RGMB | SNV | Missense_Mutation | rs554337453 | c.1373G>A | p.Arg458His | p.R458H | protein_coding | tolerated(0.14) | benign(0) | TCGA-5L-AAT0-01 | Breast | breast invasive carcinoma | Female | <65 | I/II | Hormone Therapy | tamoxiphen | SD | |
| RGMB | SNV | Missense_Mutation | novel | c.645N>A | p.Phe215Leu | p.F215L | protein_coding | deleterious(0) | probably_damaging(0.994) | TCGA-AC-A3TM-01 | Breast | breast invasive carcinoma | Female | <65 | III/IV | Chemotherapy | cytoxan | CR | |
| RGMB | SNV | Missense_Mutation | c.904G>T | p.Val302Leu | p.V302L | protein_coding | tolerated(0.54) | benign(0.003) | TCGA-AA-3715-01 | Colorectum | colon adenocarcinoma | Male | >=65 | I/II | Unknown | Unknown | PD | ||
| RGMB | SNV | Missense_Mutation | novel | c.863N>T | p.Thr288Ile | p.T288I | protein_coding | deleterious(0) | possibly_damaging(0.51) | TCGA-AA-3811-01 | Colorectum | colon adenocarcinoma | Female | >=65 | III/IV | Unknown | Unknown | PD | |
| RGMB | SNV | Missense_Mutation | c.1313N>T | p.Ala438Val | p.A438V | protein_coding | tolerated(0.21) | benign(0.031) | TCGA-AA-3811-01 | Colorectum | colon adenocarcinoma | Female | >=65 | III/IV | Unknown | Unknown | PD | ||
| RGMB | SNV | Missense_Mutation | novel | c.863N>T | p.Thr288Ile | p.T288I | protein_coding | deleterious(0) | possibly_damaging(0.51) | TCGA-AA-3877-01 | Colorectum | colon adenocarcinoma | Female | >=65 | I/II | Unknown | Unknown | SD | |
| RGMB | SNV | Missense_Mutation | rs527774662 | c.1139N>A | p.Arg380His | p.R380H | protein_coding | tolerated(0.22) | benign(0.001) | TCGA-AD-6964-01 | Colorectum | colon adenocarcinoma | Male | <65 | III/IV | Chemotherapy | folfox | PD | |
| RGMB | SNV | Missense_Mutation | rs550569565 | c.1282N>A | p.Ala428Thr | p.A428T | protein_coding | deleterious(0) | benign(0.209) | TCGA-F5-6814-01 | Colorectum | rectum adenocarcinoma | Male | <65 | I/II | Unknown | Unknown | SD | |
| RGMB | insertion | Frame_Shift_Ins | novel | c.775_776insT | p.Ile260TyrfsTer7 | p.I260Yfs*7 | protein_coding | TCGA-A6-6140-01 | Colorectum | colon adenocarcinoma | Male | <65 | I/II | Chemotherapy | oxaliplatin | SD | |||
| RGMB | insertion | Frame_Shift_Ins | novel | c.1298_1299insG | p.Glu434GlyfsTer29 | p.E434Gfs*29 | protein_coding | TCGA-AA-A01C-01 | Colorectum | colon adenocarcinoma | Male | >=65 | III/IV | Unknown | Unknown | SD |
| Page: 1 2 3 4 |
Top |
Related drugs of malignant transformation related genes |
| Identification of chemicals and drugs interact with genes involved in malignant transfromation |
| (DGIdb 4.0) |
| Entrez ID | Symbol | Category | Interaction Types | Drug Claim Name | Drug Name | PMIDs |
| Page: 1 |

Copyright 2023-Present -The University of Texas Health Science Center at Houston |