
|
|||||
|
 | |
| |
| |
| |
| |
| |
|
Gene: RGMA |
Gene summary for RGMA |
| Gene information | Species | Human | Gene symbol | RGMA | Gene ID | 56963 |
| Gene name | repulsive guidance molecule BMP co-receptor a | |
| Gene Alias | RGM | |
| Cytomap | 15q26.1 | |
| Gene Type | protein-coding | GO ID | GO:0000902 | UniProtAcc | A0A0A0MTQ4 |
Top |
Malignant transformation analysis |
| Identification of the aberrant gene expression in precancerous and cancerous lesions by comparing the gene expression of stem-like cells in diseased tissues with normal stem cells |
| Entrez ID | Symbol | Replicates | Species | Organ | Tissue | Adj P-value | Log2FC | Malignancy |
| 56963 | RGMA | LZE4T | Human | Esophagus | ESCC | 6.68e-04 | 1.17e-01 | 0.0811 |
| 56963 | RGMA | LZE8T | Human | Esophagus | ESCC | 9.47e-06 | 8.97e-02 | 0.067 |
| 56963 | RGMA | LZE22T | Human | Esophagus | ESCC | 3.94e-08 | 5.64e-01 | 0.068 |
| 56963 | RGMA | LZE24T | Human | Esophagus | ESCC | 3.67e-08 | 2.13e-01 | 0.0596 |
| 56963 | RGMA | LZE21T | Human | Esophagus | ESCC | 3.36e-06 | 2.78e-01 | 0.0655 |
| 56963 | RGMA | P1T-E | Human | Esophagus | ESCC | 4.43e-14 | 6.17e-01 | 0.0875 |
| 56963 | RGMA | P2T-E | Human | Esophagus | ESCC | 2.61e-14 | 2.04e-01 | 0.1177 |
| 56963 | RGMA | P4T-E | Human | Esophagus | ESCC | 2.14e-23 | 6.44e-01 | 0.1323 |
| 56963 | RGMA | P8T-E | Human | Esophagus | ESCC | 6.95e-12 | 2.33e-01 | 0.0889 |
| 56963 | RGMA | P9T-E | Human | Esophagus | ESCC | 1.95e-15 | 4.13e-01 | 0.1131 |
| 56963 | RGMA | P10T-E | Human | Esophagus | ESCC | 1.63e-81 | 1.34e+00 | 0.116 |
| 56963 | RGMA | P12T-E | Human | Esophagus | ESCC | 1.08e-54 | 1.13e+00 | 0.1122 |
| 56963 | RGMA | P15T-E | Human | Esophagus | ESCC | 1.59e-28 | 7.86e-01 | 0.1149 |
| 56963 | RGMA | P16T-E | Human | Esophagus | ESCC | 2.43e-20 | 3.52e-01 | 0.1153 |
| 56963 | RGMA | P20T-E | Human | Esophagus | ESCC | 1.21e-19 | 5.14e-01 | 0.1124 |
| 56963 | RGMA | P21T-E | Human | Esophagus | ESCC | 3.30e-03 | 2.45e-02 | 0.1617 |
| 56963 | RGMA | P22T-E | Human | Esophagus | ESCC | 2.36e-22 | 4.15e-01 | 0.1236 |
| 56963 | RGMA | P23T-E | Human | Esophagus | ESCC | 1.32e-35 | 9.75e-01 | 0.108 |
| 56963 | RGMA | P24T-E | Human | Esophagus | ESCC | 6.37e-05 | 2.27e-02 | 0.1287 |
| 56963 | RGMA | P26T-E | Human | Esophagus | ESCC | 1.37e-30 | 5.61e-01 | 0.1276 |
| Page: 1 2 3 |
| Tissue | Expression Dynamics | Abbreviation |
| Esophagus | 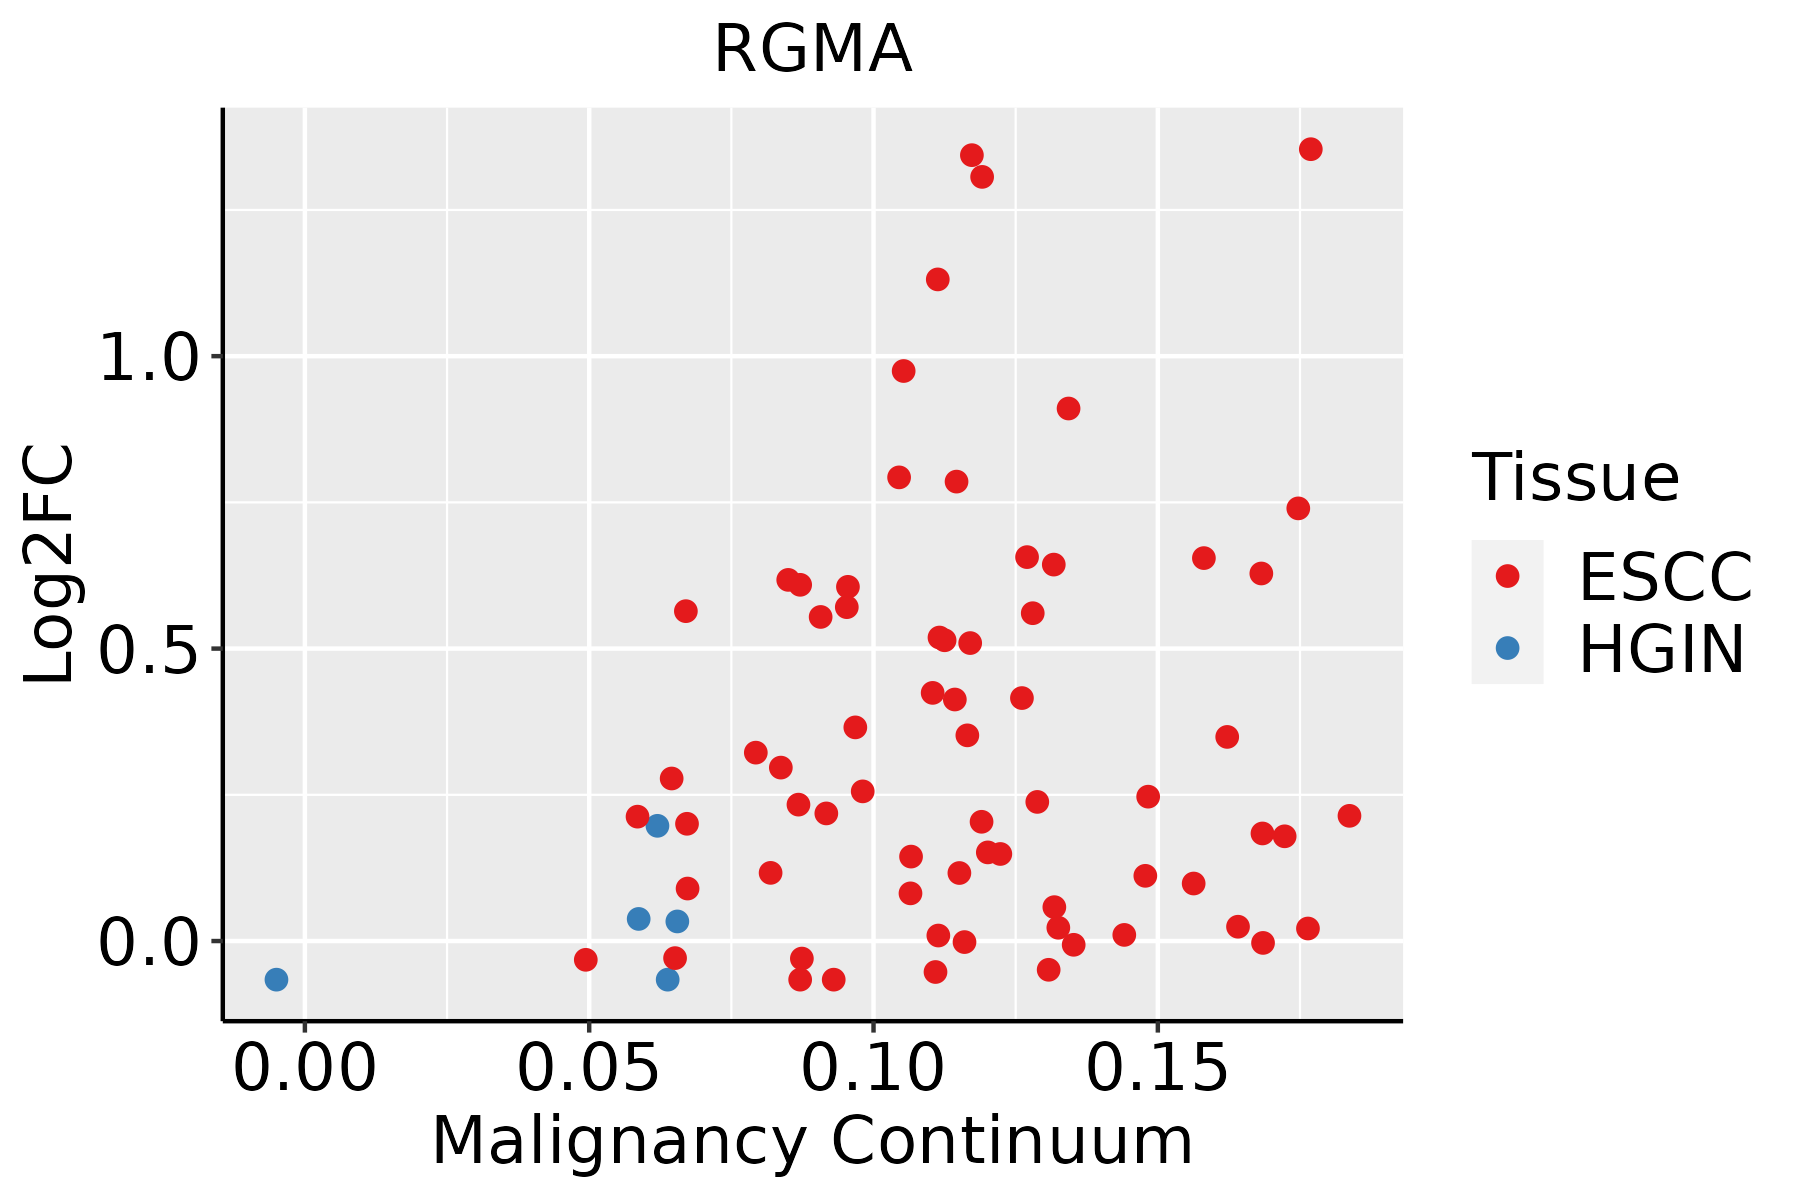 | ESCC: Esophageal squamous cell carcinoma |
| HGIN: High-grade intraepithelial neoplasias | ||
| LGIN: Low-grade intraepithelial neoplasias | ||
| Oral Cavity |  | EOLP: Erosive Oral lichen planus |
| LP: leukoplakia | ||
| NEOLP: Non-erosive oral lichen planus | ||
| OSCC: Oral squamous cell carcinoma |
| ∗log2FC in expression of this searched gene in stem-like cells from each diseased tissue sample relative to stem-like cells in normal samples in each tissue plotted against the malignancy continuum. Samples are colored based on if they are from different disease stage. |
Top |
Malignant transformation related pathway analysis |
| Find out the enriched GO biological processes and KEGG pathways involved in transition from healthy to precancer to cancer |
| Tissue | Disease Stage | Enriched GO biological Processes |
| Colorectum | AD |  |
| Colorectum | SER |  |
| Colorectum | MSS |  |
| Colorectum | MSI-H |  |
| Colorectum | FAP |  |
| ∗Top 15 enriched GO BP terms are showed in the bar plot of each disease state in each tissue. Each row represents a significant GO biological process which is colored according to the -log10(p.adjust). |
| Page: 1 2 3 4 5 6 7 8 9 |
| GO ID | Tissue | Disease Stage | Description | Gene Ratio | Bg Ratio | pvalue | p.adjust | Count |
| GO:0042176111 | Esophagus | ESCC | regulation of protein catabolic process | 280/8552 | 391/18723 | 8.65e-26 | 2.39e-23 | 280 |
| GO:0009896111 | Esophagus | ESCC | positive regulation of catabolic process | 332/8552 | 492/18723 | 4.36e-23 | 9.22e-21 | 332 |
| GO:0031331111 | Esophagus | ESCC | positive regulation of cellular catabolic process | 292/8552 | 427/18723 | 8.67e-22 | 1.53e-19 | 292 |
| GO:0051098111 | Esophagus | ESCC | regulation of binding | 251/8552 | 363/18723 | 6.73e-20 | 8.46e-18 | 251 |
| GO:0045862111 | Esophagus | ESCC | positive regulation of proteolysis | 256/8552 | 372/18723 | 7.88e-20 | 9.43e-18 | 256 |
| GO:0045732111 | Esophagus | ESCC | positive regulation of protein catabolic process | 167/8552 | 231/18723 | 1.47e-16 | 1.14e-14 | 167 |
| GO:004339320 | Esophagus | ESCC | regulation of protein binding | 135/8552 | 196/18723 | 3.69e-11 | 1.22e-09 | 135 |
| GO:0016049110 | Esophagus | ESCC | cell growth | 289/8552 | 482/18723 | 1.29e-10 | 3.77e-09 | 289 |
| GO:000155819 | Esophagus | ESCC | regulation of cell growth | 248/8552 | 414/18723 | 2.97e-09 | 6.45e-08 | 248 |
| GO:000184115 | Esophagus | ESCC | neural tube formation | 75/8552 | 102/18723 | 9.68e-09 | 1.95e-07 | 75 |
| GO:000184314 | Esophagus | ESCC | neural tube closure | 66/8552 | 88/18723 | 1.98e-08 | 3.82e-07 | 66 |
| GO:0051100111 | Esophagus | ESCC | negative regulation of binding | 109/8552 | 162/18723 | 2.10e-08 | 4.03e-07 | 109 |
| GO:001402014 | Esophagus | ESCC | primary neural tube formation | 69/8552 | 94/18723 | 4.22e-08 | 7.76e-07 | 69 |
| GO:006060614 | Esophagus | ESCC | tube closure | 66/8552 | 89/18723 | 4.24e-08 | 7.76e-07 | 66 |
| GO:003253520 | Esophagus | ESCC | regulation of cellular component size | 227/8552 | 383/18723 | 4.77e-08 | 8.60e-07 | 227 |
| GO:00219159 | Esophagus | ESCC | neural tube development | 101/8552 | 152/18723 | 1.78e-07 | 2.79e-06 | 101 |
| GO:00163316 | Esophagus | ESCC | morphogenesis of embryonic epithelium | 98/8552 | 147/18723 | 2.12e-07 | 3.27e-06 | 98 |
| GO:000183814 | Esophagus | ESCC | embryonic epithelial tube formation | 83/8552 | 121/18723 | 2.78e-07 | 4.08e-06 | 83 |
| GO:003514815 | Esophagus | ESCC | tube formation | 96/8552 | 148/18723 | 1.86e-06 | 2.16e-05 | 96 |
| GO:003209116 | Esophagus | ESCC | negative regulation of protein binding | 65/8552 | 94/18723 | 3.46e-06 | 3.82e-05 | 65 |
| Page: 1 2 3 4 5 |
| Pathway ID | Tissue | Disease Stage | Description | Gene Ratio | Bg Ratio | pvalue | p.adjust | qvalue | Count |
| hsa043507 | Esophagus | ESCC | TGF-beta signaling pathway | 69/4205 | 108/8465 | 1.92e-03 | 5.54e-03 | 2.84e-03 | 69 |
| hsa0436016 | Esophagus | ESCC | Axon guidance | 108/4205 | 182/8465 | 5.13e-03 | 1.30e-02 | 6.67e-03 | 108 |
| hsa0435014 | Esophagus | ESCC | TGF-beta signaling pathway | 69/4205 | 108/8465 | 1.92e-03 | 5.54e-03 | 2.84e-03 | 69 |
| hsa0436017 | Esophagus | ESCC | Axon guidance | 108/4205 | 182/8465 | 5.13e-03 | 1.30e-02 | 6.67e-03 | 108 |
| hsa0436014 | Oral cavity | OSCC | Axon guidance | 97/3704 | 182/8465 | 5.59e-03 | 1.33e-02 | 6.76e-03 | 97 |
| hsa043506 | Oral cavity | OSCC | TGF-beta signaling pathway | 60/3704 | 108/8465 | 8.66e-03 | 1.97e-02 | 1.00e-02 | 60 |
| hsa0436015 | Oral cavity | OSCC | Axon guidance | 97/3704 | 182/8465 | 5.59e-03 | 1.33e-02 | 6.76e-03 | 97 |
| hsa0435013 | Oral cavity | OSCC | TGF-beta signaling pathway | 60/3704 | 108/8465 | 8.66e-03 | 1.97e-02 | 1.00e-02 | 60 |
| Page: 1 |
Top |
Cell-cell communication analysis |
| Identification of potential cell-cell interactions between two cell types and their ligand-receptor pairs for different disease states |
| Ligand | Receptor | LRpair | Pathway | Tissue | Disease Stage |
| Page: 1 |
Top |
Single-cell gene regulatory network inference analysis |
| Find out the significant the regulons (TFs) and the target genes of each regulon across cell types for different disease states |
| TF | Cell Type | Tissue | Disease Stage | Target Gene | RSS | Regulon Activity |
| ∗The dot plots of a searched regulon are shown for all cell subpopulations in each disease state of each tissue based on the regulon specific score inferred using pySCENIC and by calculating the average expression. |
| Page: 1 |
Top |
Somatic mutation of malignant transformation related genes |
| Annotation of somatic variants for genes involved in malignant transformation |
| Hugo Symbol | Variant Class | Variant Classification | dbSNP RS | HGVSc | HGVSp | HGVSp Short | SWISSPROT | BIOTYPE | SIFT | PolyPhen | Tumor Sample Barcode | Tissue | Histology | Sex | Age | Stage | Therapy Types | Drugs | Outcome |
| RGMA | SNV | Missense_Mutation | rs376438901 | c.1036N>A | p.Gly346Ser | p.G346S | protein_coding | tolerated(0.76) | benign(0.077) | TCGA-AR-A1AL-01 | Breast | breast invasive carcinoma | Female | <65 | III/IV | Hormone Therapy | anastrozole | SD | |
| RGMA | SNV | Missense_Mutation | rs763987490 | c.451N>A | p.Glu151Lys | p.E151K | protein_coding | deleterious(0.03) | probably_damaging(0.946) | TCGA-A6-5661-01 | Colorectum | colon adenocarcinoma | Female | >=65 | I/II | Unknown | Unknown | SD | |
| RGMA | SNV | Missense_Mutation | rs752421802 | c.1295C>T | p.Ala432Val | p.A432V | protein_coding | deleterious(0.04) | benign(0.135) | TCGA-AD-6899-01 | Colorectum | colon adenocarcinoma | Male | >=65 | III/IV | Unknown | Unknown | SD | |
| RGMA | SNV | Missense_Mutation | c.698A>C | p.Glu233Ala | p.E233A | protein_coding | deleterious(0.04) | probably_damaging(0.998) | TCGA-CK-4951-01 | Colorectum | colon adenocarcinoma | Female | >=65 | I/II | Unknown | Unknown | PD | ||
| RGMA | SNV | Missense_Mutation | c.1204N>A | p.Ala402Thr | p.A402T | protein_coding | deleterious(0) | probably_damaging(0.999) | TCGA-DM-A1D4-01 | Colorectum | colon adenocarcinoma | Male | >=65 | I/II | Unknown | Unknown | PD | ||
| RGMA | SNV | Missense_Mutation | c.811N>A | p.Glu271Lys | p.E271K | protein_coding | deleterious(0) | probably_damaging(0.998) | TCGA-DM-A28A-01 | Colorectum | colon adenocarcinoma | Male | >=65 | III/IV | Unknown | Unknown | SD | ||
| RGMA | SNV | Missense_Mutation | c.868G>A | p.Val290Met | p.V290M | protein_coding | deleterious(0.01) | probably_damaging(0.961) | TCGA-DM-A28H-01 | Colorectum | colon adenocarcinoma | Male | <65 | III/IV | Unknown | Unknown | PD | ||
| RGMA | SNV | Missense_Mutation | c.1373G>T | p.Cys458Phe | p.C458F | protein_coding | deleterious_low_confidence(0) | benign(0.006) | TCGA-G4-6628-01 | Colorectum | colon adenocarcinoma | Male | >=65 | I/II | Unknown | Unknown | SD | ||
| RGMA | SNV | Missense_Mutation | rs756255260 | c.523N>A | p.Gly175Arg | p.G175R | protein_coding | deleterious(0) | probably_damaging(1) | TCGA-WS-AB45-01 | Colorectum | colon adenocarcinoma | Female | <65 | I/II | Unknown | Unknown | SD | |
| RGMA | SNV | Missense_Mutation | rs763103195 | c.973C>T | p.Arg325Trp | p.R325W | protein_coding | deleterious(0.04) | probably_damaging(0.961) | TCGA-AF-2690-01 | Colorectum | rectum adenocarcinoma | Female | >=65 | III/IV | Unknown | Unknown | SD |
| Page: 1 2 3 4 |
Top |
Related drugs of malignant transformation related genes |
| Identification of chemicals and drugs interact with genes involved in malignant transfromation |
| (DGIdb 4.0) |
| Entrez ID | Symbol | Category | Interaction Types | Drug Claim Name | Drug Name | PMIDs |
| 56963 | RGMA | CELL SURFACE, KINASE | Elezanumab | ELEZANUMAB | ||
| 56963 | RGMA | CELL SURFACE, KINASE | antibody | 318164809 | ELEZANUMAB |
| Page: 1 |

Copyright 2023-Present -The University of Texas Health Science Center at Houston |