
|
|||||
|
 | |
| |
| |
| |
| |
| |
|
Gene: RGL3 |
Gene summary for RGL3 |
| Gene information | Species | Human | Gene symbol | RGL3 | Gene ID | 57139 |
| Gene name | ral guanine nucleotide dissociation stimulator like 3 | |
| Gene Alias | RGL3 | |
| Cytomap | 19p13.2 | |
| Gene Type | protein-coding | GO ID | GO:0007154 | UniProtAcc | A0A0A0MRX4 |
Top |
Malignant transformation analysis |
| Identification of the aberrant gene expression in precancerous and cancerous lesions by comparing the gene expression of stem-like cells in diseased tissues with normal stem cells |
| Entrez ID | Symbol | Replicates | Species | Organ | Tissue | Adj P-value | Log2FC | Malignancy |
| 57139 | RGL3 | HTA11_866_3004761011 | Human | Colorectum | AD | 4.66e-02 | 1.97e-01 | 0.096 |
| 57139 | RGL3 | HTA11_6818_2000001021 | Human | Colorectum | AD | 5.41e-10 | 4.85e-01 | 0.0588 |
| 57139 | RGL3 | HTA11_99999970781_79442 | Human | Colorectum | MSS | 3.25e-16 | 5.45e-01 | 0.294 |
| 57139 | RGL3 | RNA-P17T-P17T-6 | Human | Lung | IAC | 1.68e-02 | 3.67e-01 | 0.3385 |
| 57139 | RGL3 | RNA-P17T-P17T-8 | Human | Lung | IAC | 5.73e-06 | 5.67e-01 | 0.3329 |
| 57139 | RGL3 | RNA-P6T1-P6T1-4 | Human | Lung | MIAC | 2.25e-06 | 7.74e-01 | -0.0263 |
| 57139 | RGL3 | RNA-P6T2-P6T2-1 | Human | Lung | IAC | 6.98e-08 | 3.39e-01 | -0.0166 |
| 57139 | RGL3 | RNA-P6T2-P6T2-2 | Human | Lung | IAC | 3.73e-10 | 3.62e-01 | -0.0132 |
| 57139 | RGL3 | RNA-P6T2-P6T2-3 | Human | Lung | IAC | 1.28e-12 | 4.23e-01 | -0.013 |
| 57139 | RGL3 | RNA-P6T2-P6T2-4 | Human | Lung | IAC | 2.61e-10 | 3.95e-01 | -0.0121 |
| 57139 | RGL3 | HTA12-15-2 | Human | Pancreas | PDAC | 4.06e-02 | 1.92e-01 | 0.2315 |
| 57139 | RGL3 | HTA12-25-1 | Human | Pancreas | PDAC | 3.52e-06 | 4.43e-01 | 0.313 |
| 57139 | RGL3 | HTA12-26-1 | Human | Pancreas | PDAC | 9.18e-12 | 5.24e-01 | 0.3728 |
| 57139 | RGL3 | HTA12-29-1 | Human | Pancreas | PDAC | 1.40e-31 | 6.35e-01 | 0.3722 |
| 57139 | RGL3 | male-WTA | Human | Thyroid | PTC | 6.99e-54 | 5.77e-01 | 0.1037 |
| 57139 | RGL3 | female-WTA | Human | Thyroid | PTC | 3.19e-02 | 2.86e-01 | 0.0726 |
| 57139 | RGL3 | PTC01 | Human | Thyroid | PTC | 9.08e-31 | 6.78e-01 | 0.1899 |
| 57139 | RGL3 | PTC03 | Human | Thyroid | PTC | 2.76e-21 | 7.07e-01 | 0.1784 |
| 57139 | RGL3 | PTC04 | Human | Thyroid | PTC | 2.13e-53 | 8.48e-01 | 0.1927 |
| 57139 | RGL3 | PTC05 | Human | Thyroid | PTC | 1.64e-41 | 1.18e+00 | 0.2065 |
| Page: 1 2 |
| Tissue | Expression Dynamics | Abbreviation |
| Colorectum (GSE201348) |  | FAP: Familial adenomatous polyposis |
| CRC: Colorectal cancer | ||
| Colorectum (HTA11) |  | AD: Adenomas |
| SER: Sessile serrated lesions | ||
| MSI-H: Microsatellite-high colorectal cancer | ||
| MSS: Microsatellite stable colorectal cancer | ||
| Lung | 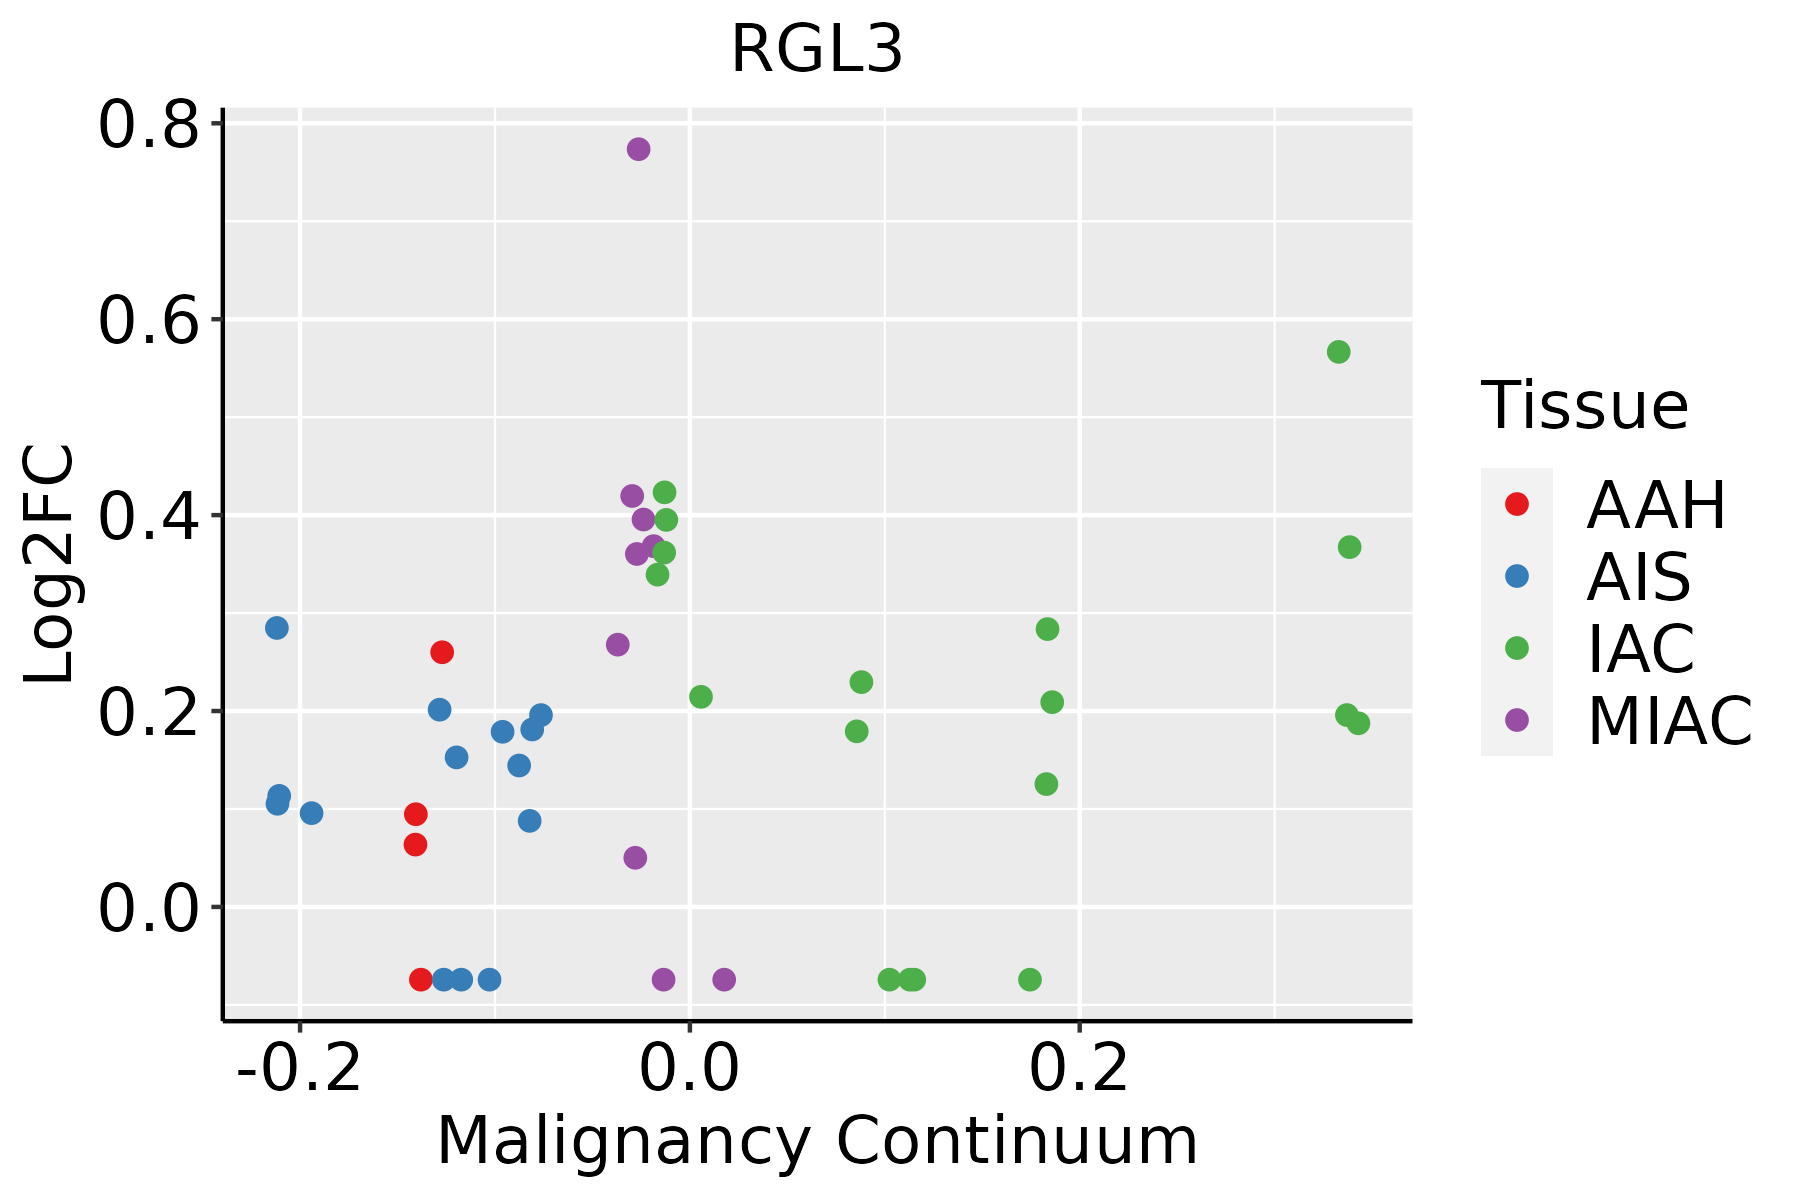 | AAH: Atypical adenomatous hyperplasia |
| AIS: Adenocarcinoma in situ | ||
| IAC: Invasive lung adenocarcinoma | ||
| MIA: Minimally invasive adenocarcinoma | ||
| Thyroid | 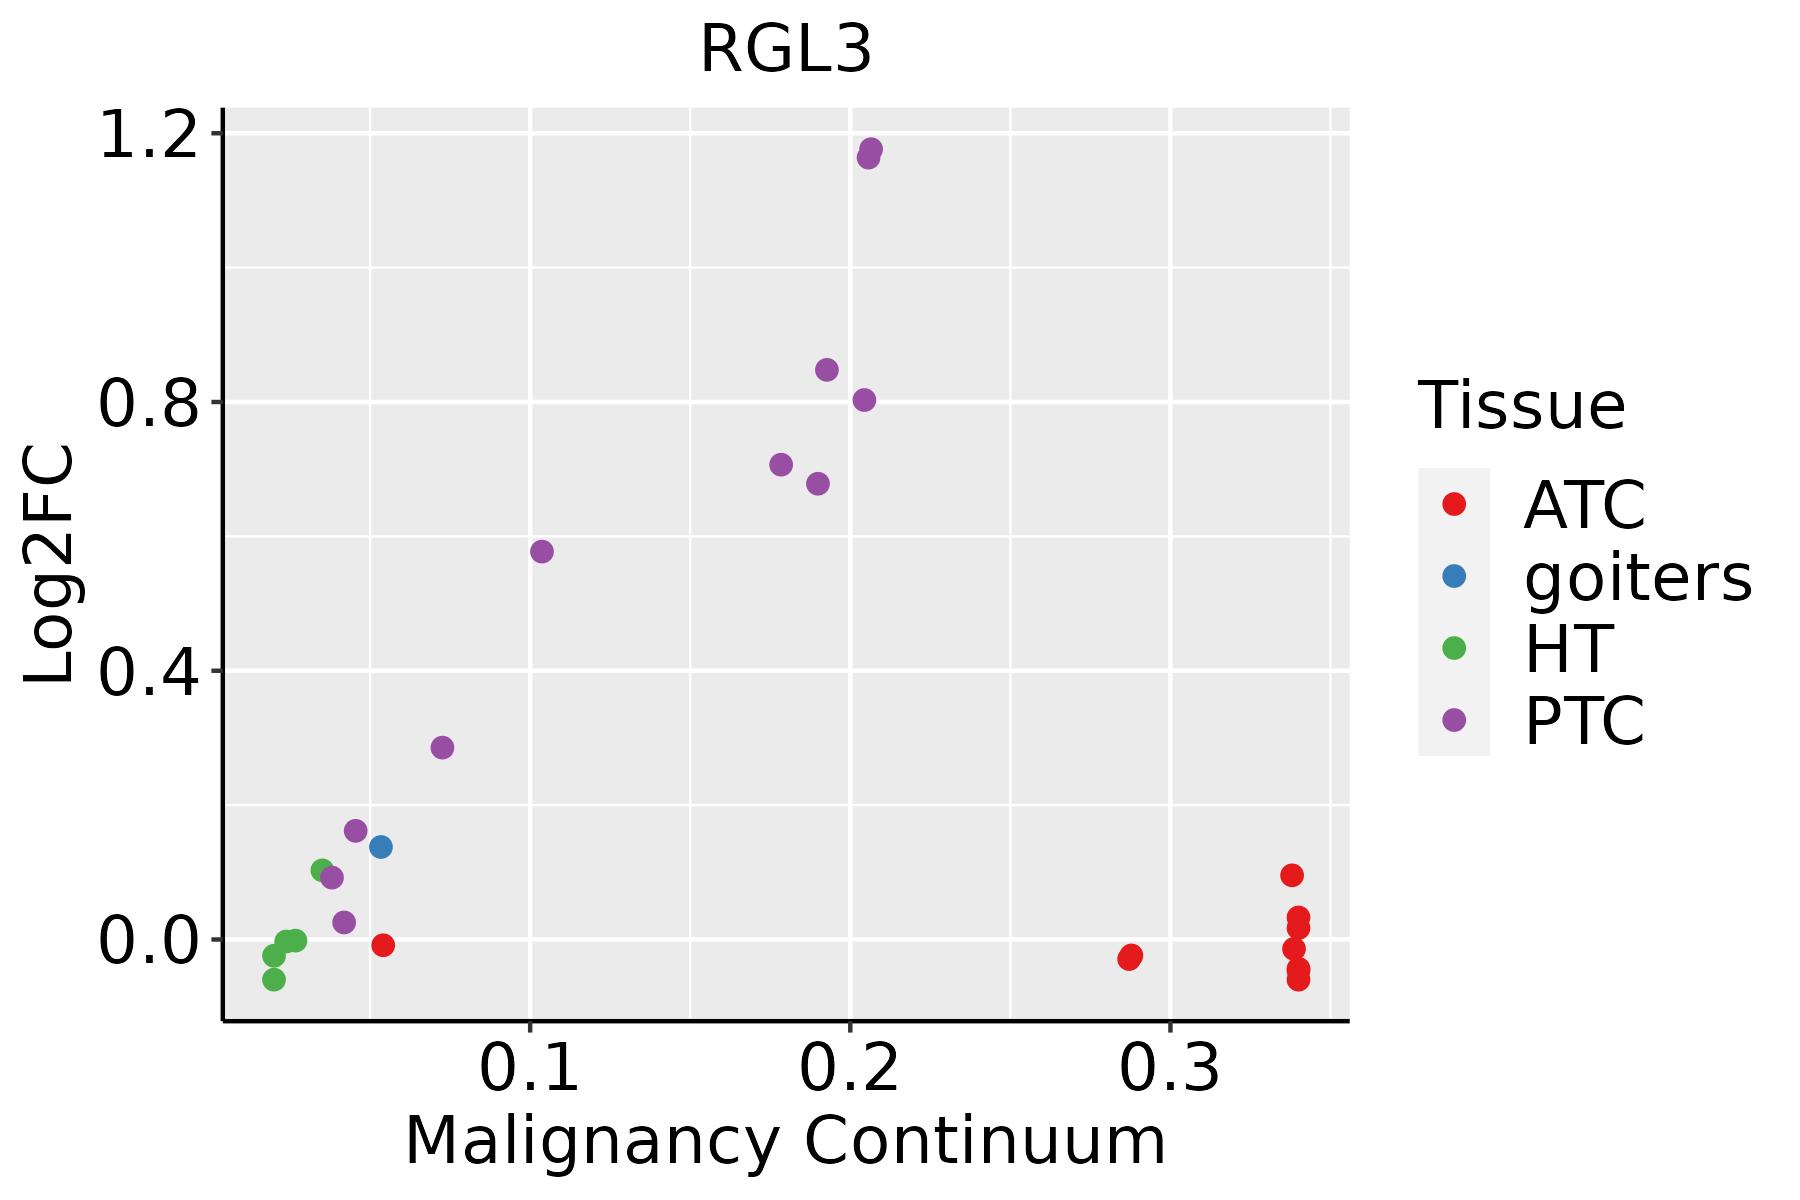 | ATC: Anaplastic thyroid cancer |
| HT: Hashimoto's thyroiditis | ||
| PTC: Papillary thyroid cancer |
| ∗log2FC in expression of this searched gene in stem-like cells from each diseased tissue sample relative to stem-like cells in normal samples in each tissue plotted against the malignancy continuum. Samples are colored based on if they are from different disease stage. |
Top |
Malignant transformation related pathway analysis |
| Find out the enriched GO biological processes and KEGG pathways involved in transition from healthy to precancer to cancer |
| Tissue | Disease Stage | Enriched GO biological Processes |
| Colorectum | AD |  |
| Colorectum | SER |  |
| Colorectum | MSS |  |
| Colorectum | MSI-H |  |
| Colorectum | FAP |  |
| ∗Top 15 enriched GO BP terms are showed in the bar plot of each disease state in each tissue. Each row represents a significant GO biological process which is colored according to the -log10(p.adjust). |
| Page: 1 2 3 4 5 6 7 8 9 |
| GO ID | Tissue | Disease Stage | Description | Gene Ratio | Bg Ratio | pvalue | p.adjust | Count |
| GO:0043087 | Colorectum | AD | regulation of GTPase activity | 110/3918 | 348/18723 | 1.64e-06 | 5.03e-05 | 110 |
| GO:0043547 | Colorectum | AD | positive regulation of GTPase activity | 75/3918 | 255/18723 | 7.95e-04 | 7.91e-03 | 75 |
| GO:00430872 | Colorectum | MSS | regulation of GTPase activity | 101/3467 | 348/18723 | 1.00e-06 | 3.46e-05 | 101 |
| GO:00435471 | Colorectum | MSS | positive regulation of GTPase activity | 68/3467 | 255/18723 | 7.97e-04 | 8.38e-03 | 68 |
| GO:00430876 | Lung | IAC | regulation of GTPase activity | 67/2061 | 348/18723 | 3.43e-06 | 1.44e-04 | 67 |
| GO:00435475 | Lung | IAC | positive regulation of GTPase activity | 48/2061 | 255/18723 | 1.40e-04 | 2.60e-03 | 48 |
| GO:004308721 | Lung | MIAC | regulation of GTPase activity | 41/967 | 348/18723 | 7.39e-07 | 1.08e-04 | 41 |
| GO:004354721 | Lung | MIAC | positive regulation of GTPase activity | 31/967 | 255/18723 | 8.63e-06 | 7.38e-04 | 31 |
| GO:004308718 | Thyroid | PTC | regulation of GTPase activity | 148/5968 | 348/18723 | 1.63e-05 | 1.71e-04 | 148 |
| GO:004354714 | Thyroid | PTC | positive regulation of GTPase activity | 103/5968 | 255/18723 | 2.38e-03 | 1.25e-02 | 103 |
| GO:004308719 | Thyroid | ATC | regulation of GTPase activity | 153/6293 | 348/18723 | 3.24e-05 | 2.68e-04 | 153 |
| GO:004354715 | Thyroid | ATC | positive regulation of GTPase activity | 106/6293 | 255/18723 | 4.58e-03 | 1.89e-02 | 106 |
| Page: 1 |
| Pathway ID | Tissue | Disease Stage | Description | Gene Ratio | Bg Ratio | pvalue | p.adjust | qvalue | Count |
| Page: 1 |
Top |
Cell-cell communication analysis |
| Identification of potential cell-cell interactions between two cell types and their ligand-receptor pairs for different disease states |
| Ligand | Receptor | LRpair | Pathway | Tissue | Disease Stage |
| Page: 1 |
Top |
Single-cell gene regulatory network inference analysis |
| Find out the significant the regulons (TFs) and the target genes of each regulon across cell types for different disease states |
| TF | Cell Type | Tissue | Disease Stage | Target Gene | RSS | Regulon Activity |
| ∗The dot plots of a searched regulon are shown for all cell subpopulations in each disease state of each tissue based on the regulon specific score inferred using pySCENIC and by calculating the average expression. |
| Page: 1 |
Top |
Somatic mutation of malignant transformation related genes |
| Annotation of somatic variants for genes involved in malignant transformation |
| Hugo Symbol | Variant Class | Variant Classification | dbSNP RS | HGVSc | HGVSp | HGVSp Short | SWISSPROT | BIOTYPE | SIFT | PolyPhen | Tumor Sample Barcode | Tissue | Histology | Sex | Age | Stage | Therapy Types | Drugs | Outcome |
| RGL3 | SNV | Missense_Mutation | novel | c.1985N>T | p.Pro662Leu | p.P662L | Q3MIN7 | protein_coding | deleterious(0.03) | benign(0.138) | TCGA-A2-A4S3-01 | Breast | breast invasive carcinoma | Female | <65 | I/II | Unknown | Unknown | SD |
| RGL3 | insertion | Frame_Shift_Ins | novel | c.517_518insAAAAAACAAATTCT | p.Thr173LysfsTer88 | p.T173Kfs*88 | Q3MIN7 | protein_coding | TCGA-AN-A0G0-01 | Breast | breast invasive carcinoma | Female | <65 | I/II | Unknown | Unknown | SD | ||
| RGL3 | insertion | Frame_Shift_Ins | novel | c.1889_1890insGCCGAGATCATACCACTGCA | p.Asp630GlufsTer18 | p.D630Efs*18 | Q3MIN7 | protein_coding | TCGA-BH-A0H7-01 | Breast | breast invasive carcinoma | Female | >=65 | III/IV | Chemotherapy | doxorubicin | SD | ||
| RGL3 | SNV | Missense_Mutation | novel | c.2113G>A | p.Glu705Lys | p.E705K | Q3MIN7 | protein_coding | tolerated(0.26) | benign(0.021) | TCGA-ZJ-AB0H-01 | Cervix | cervical & endocervical cancer | Female | <65 | III/IV | Unknown | Unknown | SD |
| RGL3 | SNV | Missense_Mutation | c.1477G>A | p.Glu493Lys | p.E493K | Q3MIN7 | protein_coding | deleterious(0.01) | benign(0.253) | TCGA-A6-6137-01 | Colorectum | colon adenocarcinoma | Male | <65 | III/IV | Chemotherapy | fluorouracil | SD | |
| RGL3 | SNV | Missense_Mutation | c.620N>T | p.Pro207Leu | p.P207L | Q3MIN7 | protein_coding | tolerated(0.3) | benign(0.042) | TCGA-A6-6781-01 | Colorectum | colon adenocarcinoma | Male | <65 | III/IV | Chemotherapy | oxaliplatin | SD | |
| RGL3 | SNV | Missense_Mutation | novel | c.1401N>C | p.Arg467Ser | p.R467S | Q3MIN7 | protein_coding | tolerated(0.92) | benign(0.005) | TCGA-AA-3862-01 | Colorectum | colon adenocarcinoma | Male | >=65 | I/II | Unknown | Unknown | SD |
| RGL3 | SNV | Missense_Mutation | rs148120187 | c.1571G>A | p.Arg524His | p.R524H | Q3MIN7 | protein_coding | deleterious(0) | probably_damaging(0.995) | TCGA-AD-5900-01 | Colorectum | colon adenocarcinoma | Male | >=65 | I/II | Unknown | Unknown | SD |
| RGL3 | SNV | Missense_Mutation | rs372106275 | c.1580N>T | p.Ala527Val | p.A527V | Q3MIN7 | protein_coding | tolerated(0.23) | probably_damaging(0.987) | TCGA-AD-6890-01 | Colorectum | colon adenocarcinoma | Male | >=65 | I/II | Unknown | Unknown | SD |
| RGL3 | SNV | Missense_Mutation | c.766A>G | p.Thr256Ala | p.T256A | Q3MIN7 | protein_coding | deleterious(0) | probably_damaging(0.999) | TCGA-AD-6895-01 | Colorectum | colon adenocarcinoma | Male | >=65 | III/IV | Unknown | Unknown | SD |
| Page: 1 2 3 4 5 6 7 |
Top |
Related drugs of malignant transformation related genes |
| Identification of chemicals and drugs interact with genes involved in malignant transfromation |
| (DGIdb 4.0) |
| Entrez ID | Symbol | Category | Interaction Types | Drug Claim Name | Drug Name | PMIDs |
| Page: 1 |

Copyright 2023-Present -The University of Texas Health Science Center at Houston |