
|
|||||
|
 | |
| |
| |
| |
| |
| |
|
Gene: RFX7 |
Gene summary for RFX7 |
| Gene information | Species | Human | Gene symbol | RFX7 | Gene ID | 64864 |
| Gene name | regulatory factor X7 | |
| Gene Alias | RFXDC2 | |
| Cytomap | 15q21.3 | |
| Gene Type | protein-coding | GO ID | GO:0006139 | UniProtAcc | Q2KHR2 |
Top |
Malignant transformation analysis |
| Identification of the aberrant gene expression in precancerous and cancerous lesions by comparing the gene expression of stem-like cells in diseased tissues with normal stem cells |
| Entrez ID | Symbol | Replicates | Species | Organ | Tissue | Adj P-value | Log2FC | Malignancy |
| 64864 | RFX7 | CCI_1 | Human | Cervix | CC | 8.97e-04 | 1.12e+00 | 0.528 |
| 64864 | RFX7 | CCI_2 | Human | Cervix | CC | 4.57e-15 | 1.27e+00 | 0.5249 |
| 64864 | RFX7 | CCI_3 | Human | Cervix | CC | 1.51e-16 | 6.92e-01 | 0.516 |
| 64864 | RFX7 | HTA11_3410_2000001011 | Human | Colorectum | AD | 1.09e-13 | -5.60e-01 | 0.0155 |
| 64864 | RFX7 | HTA11_2487_2000001011 | Human | Colorectum | SER | 4.18e-03 | -4.85e-01 | -0.1808 |
| 64864 | RFX7 | HTA11_3361_2000001011 | Human | Colorectum | AD | 2.45e-09 | -6.91e-01 | -0.1207 |
| 64864 | RFX7 | HTA11_696_2000001011 | Human | Colorectum | AD | 8.33e-09 | -4.04e-01 | -0.1464 |
| 64864 | RFX7 | HTA11_866_2000001011 | Human | Colorectum | AD | 6.63e-06 | -3.73e-01 | -0.1001 |
| 64864 | RFX7 | HTA11_5212_2000001011 | Human | Colorectum | AD | 3.13e-03 | -5.88e-01 | -0.2061 |
| 64864 | RFX7 | HTA11_5216_2000001011 | Human | Colorectum | SER | 3.62e-02 | -6.03e-01 | -0.1462 |
| 64864 | RFX7 | HTA11_866_3004761011 | Human | Colorectum | AD | 1.35e-09 | -5.38e-01 | 0.096 |
| 64864 | RFX7 | HTA11_8622_2000001021 | Human | Colorectum | SER | 4.23e-04 | -7.08e-01 | 0.0528 |
| 64864 | RFX7 | HTA11_7696_3000711011 | Human | Colorectum | AD | 4.87e-10 | -3.99e-01 | 0.0674 |
| 64864 | RFX7 | HTA11_6818_2000001021 | Human | Colorectum | AD | 2.33e-05 | -4.71e-01 | 0.0588 |
| 64864 | RFX7 | HTA11_99999970781_79442 | Human | Colorectum | MSS | 7.05e-04 | -2.76e-01 | 0.294 |
| 64864 | RFX7 | HTA11_99999965062_69753 | Human | Colorectum | MSI-H | 3.27e-02 | 5.53e-01 | 0.3487 |
| 64864 | RFX7 | HTA11_99999971662_82457 | Human | Colorectum | MSS | 3.88e-09 | -4.07e-01 | 0.3859 |
| 64864 | RFX7 | HTA11_99999973899_84307 | Human | Colorectum | MSS | 1.06e-04 | -5.71e-01 | 0.2585 |
| 64864 | RFX7 | HTA11_99999974143_84620 | Human | Colorectum | MSS | 1.62e-11 | -4.33e-01 | 0.3005 |
| 64864 | RFX7 | F007 | Human | Colorectum | FAP | 5.81e-04 | -1.76e-01 | 0.1176 |
| Page: 1 2 3 4 |
| Tissue | Expression Dynamics | Abbreviation |
| Cervix | 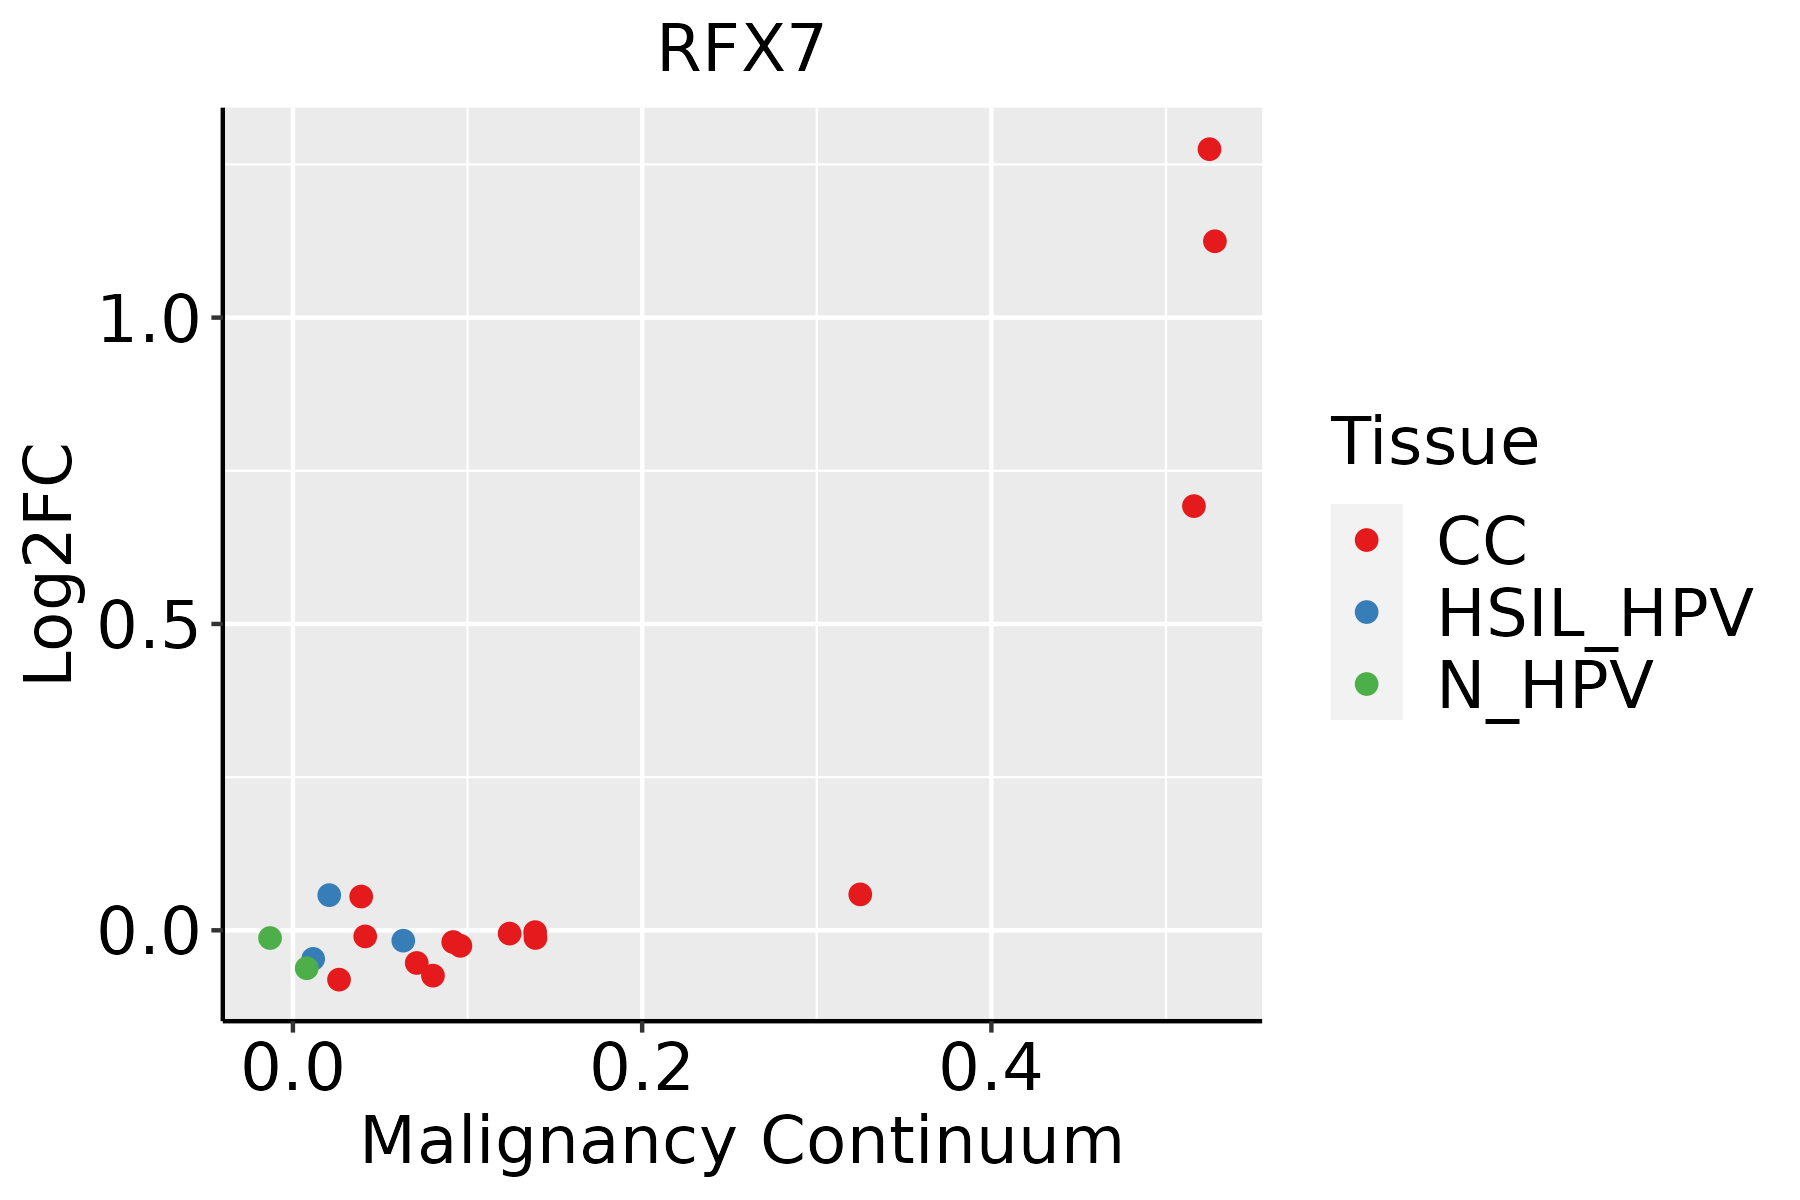 | CC: Cervix cancer |
| HSIL_HPV: HPV-infected high-grade squamous intraepithelial lesions | ||
| N_HPV: HPV-infected normal cervix | ||
| Colorectum (GSE201348) |  | FAP: Familial adenomatous polyposis |
| CRC: Colorectal cancer | ||
| Colorectum (HTA11) |  | AD: Adenomas |
| SER: Sessile serrated lesions | ||
| MSI-H: Microsatellite-high colorectal cancer | ||
| MSS: Microsatellite stable colorectal cancer | ||
| Lung |  | AAH: Atypical adenomatous hyperplasia |
| AIS: Adenocarcinoma in situ | ||
| IAC: Invasive lung adenocarcinoma | ||
| MIA: Minimally invasive adenocarcinoma | ||
| Prostate | 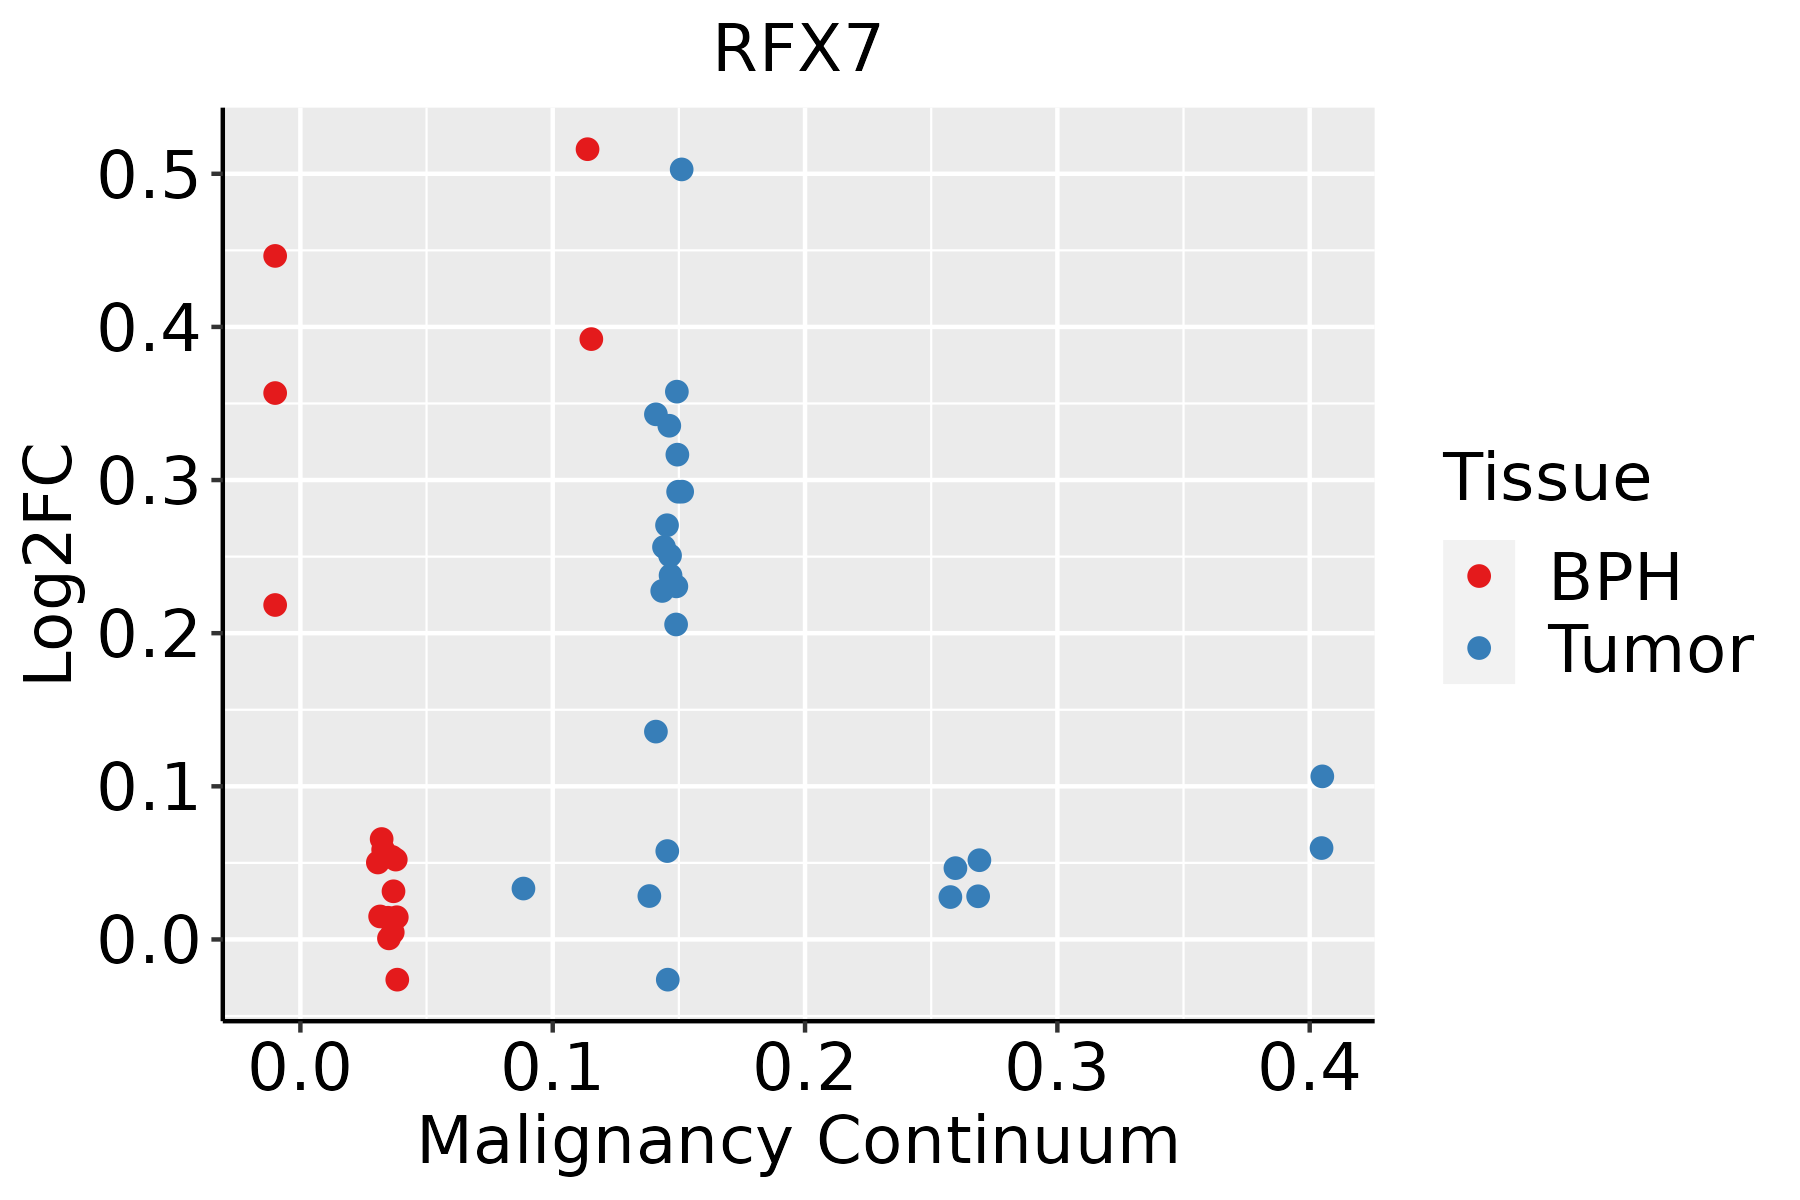 | BPH: Benign Prostatic Hyperplasia |
| ∗log2FC in expression of this searched gene in stem-like cells from each diseased tissue sample relative to stem-like cells in normal samples in each tissue plotted against the malignancy continuum. Samples are colored based on if they are from different disease stage. |
Top |
Malignant transformation related pathway analysis |
| Find out the enriched GO biological processes and KEGG pathways involved in transition from healthy to precancer to cancer |
| Tissue | Disease Stage | Enriched GO biological Processes |
| Colorectum | AD |  |
| Colorectum | SER |  |
| Colorectum | MSS |  |
| Colorectum | MSI-H |  |
| Colorectum | FAP |  |
| ∗Top 15 enriched GO BP terms are showed in the bar plot of each disease state in each tissue. Each row represents a significant GO biological process which is colored according to the -log10(p.adjust). |
| Page: 1 2 3 4 5 6 7 8 9 |
| GO ID | Tissue | Disease Stage | Description | Gene Ratio | Bg Ratio | pvalue | p.adjust | Count |
| Page: 1 |
| Pathway ID | Tissue | Disease Stage | Description | Gene Ratio | Bg Ratio | pvalue | p.adjust | qvalue | Count |
| Page: 1 |
Top |
Cell-cell communication analysis |
| Identification of potential cell-cell interactions between two cell types and their ligand-receptor pairs for different disease states |
| Ligand | Receptor | LRpair | Pathway | Tissue | Disease Stage |
| Page: 1 |
Top |
Single-cell gene regulatory network inference analysis |
| Find out the significant the regulons (TFs) and the target genes of each regulon across cell types for different disease states |
| TF | Cell Type | Tissue | Disease Stage | Target Gene | RSS | Regulon Activity |
| RFX7 | TFH | Breast | ADJ | XKR6,BMPR2,CSGALNACT1, etc. | 8.90e-02 |  |
| RFX7 | PLA | Breast | DCIS | XKR6,BMPR2,CSGALNACT1, etc. | 1.15e-01 |  |
| RFX7 | BMEM | Breast | DCIS | XKR6,BMPR2,CSGALNACT1, etc. | 9.22e-02 | |
| RFX7 | CD8TEFF | Breast | Healthy | XKR6,BMPR2,CSGALNACT1, etc. | 5.47e-02 |  |
| RFX7 | TFH | Breast | IDC | XKR6,BMPR2,CSGALNACT1, etc. | 1.33e-01 |  |
| RFX7 | CD8TEFF | Breast | Precancer | XKR6,BMPR2,CSGALNACT1, etc. | 6.06e-02 |  |
| RFX7 | MAIT | Colorectum | AD | POGLUT1,RTKN2,EGLN1, etc. | 1.24e-02 |  |
| RFX7 | TREG | Colorectum | ADJ | POGLUT1,RTKN2,EGLN1, etc. | 1.16e-01 |  |
| RFX7 | TREG | Colorectum | CRC | POGLUT1,RTKN2,EGLN1, etc. | 1.26e-01 |  |
| RFX7 | TH1 | Colorectum | CRC | POGLUT1,RTKN2,EGLN1, etc. | 1.96e-02 | |
| ∗The dot plots of a searched regulon are shown for all cell subpopulations in each disease state of each tissue based on the regulon specific score inferred using pySCENIC and by calculating the average expression. |
| Page: 1 2 |
Top |
Somatic mutation of malignant transformation related genes |
| Annotation of somatic variants for genes involved in malignant transformation |
| Hugo Symbol | Variant Class | Variant Classification | dbSNP RS | HGVSc | HGVSp | HGVSp Short | SWISSPROT | BIOTYPE | SIFT | PolyPhen | Tumor Sample Barcode | Tissue | Histology | Sex | Age | Stage | Therapy Types | Drugs | Outcome |
| RFX7 | SNV | Missense_Mutation | c.739C>G | p.Leu247Val | p.L247V | Q2KHR2 | protein_coding | tolerated(0.1) | benign(0) | TCGA-AC-A23H-01 | Breast | breast invasive carcinoma | Female | >=65 | I/II | Unknown | Unknown | PD | |
| RFX7 | SNV | Missense_Mutation | c.2555N>T | p.Thr852Ile | p.T852I | Q2KHR2 | protein_coding | deleterious(0.02) | probably_damaging(0.963) | TCGA-AN-A0FJ-01 | Breast | breast invasive carcinoma | Female | <65 | III/IV | Unknown | Unknown | SD | |
| RFX7 | SNV | Missense_Mutation | novel | c.858G>C | p.Met286Ile | p.M286I | Q2KHR2 | protein_coding | tolerated(0.21) | benign(0) | TCGA-AQ-A7U7-01 | Breast | breast invasive carcinoma | Female | <65 | III/IV | Targeted Molecular therapy | rituximab | CR |
| RFX7 | SNV | Missense_Mutation | novel | c.1333N>A | p.Glu445Lys | p.E445K | Q2KHR2 | protein_coding | deleterious(0.02) | probably_damaging(0.98) | TCGA-BH-A0B6-01 | Breast | breast invasive carcinoma | Female | <65 | I/II | Unknown | Unknown | SD |
| RFX7 | insertion | Frame_Shift_Ins | novel | c.1707_1708insTTGGCAGCTTTAATCCAAATGGATGGCA | p.Thr570LeufsTer37 | p.T570Lfs*37 | Q2KHR2 | protein_coding | TCGA-A2-A0D1-01 | Breast | breast invasive carcinoma | Female | >=65 | I/II | Chemotherapy | taxotere | SD | ||
| RFX7 | insertion | In_Frame_Ins | novel | c.2840_2841insCAACTTCAGATGCCGGAGTGTGAGCCCTGCTGT | p.Ser947_Pro948insAsnPheArgCysArgSerValSerProAlaVal | p.S947_P948insNFRCRSVSPAV | Q2KHR2 | protein_coding | TCGA-A8-A07J-01 | Breast | breast invasive carcinoma | Female | <65 | I/II | Chemotherapy | 5-fluorouracil | CR | ||
| RFX7 | insertion | Frame_Shift_Ins | novel | c.2579_2580insAAATCTTTAT | p.Pro861AsnfsTer13 | p.P861Nfs*13 | Q2KHR2 | protein_coding | TCGA-A8-A09D-01 | Breast | breast invasive carcinoma | Female | <65 | I/II | Chemotherapy | doxorubicin | CR | ||
| RFX7 | insertion | In_Frame_Ins | novel | c.2577_2578insGAAGCC | p.Pro859_Thr860insGluAla | p.P859_T860insEA | Q2KHR2 | protein_coding | TCGA-A8-A09D-01 | Breast | breast invasive carcinoma | Female | <65 | I/II | Chemotherapy | doxorubicin | CR | ||
| RFX7 | insertion | Nonsense_Mutation | novel | c.1584_1585insCTTTTAGCTTAATAATAGTGGAGATAGGAGGTTCAAGGGTTC | p.Ser528_Val529insLeuLeuAlaTerTerTerTrpArgTerGluValGlnGlyPhe | p.S528_V529insLLA***WR*EVQGF | Q2KHR2 | protein_coding | TCGA-BH-A0AY-01 | Breast | breast invasive carcinoma | Female | <65 | I/II | Chemotherapy | SD | |||
| RFX7 | deletion | Frame_Shift_Del | novel | c.2588delN | p.Pro863GlnfsTer9 | p.P863Qfs*9 | Q2KHR2 | protein_coding | TCGA-D8-A27V-01 | Breast | breast invasive carcinoma | Female | <65 | I/II | Hormone Therapy | tamoxiphen | SD |
| Page: 1 2 3 4 5 6 7 8 9 10 11 12 13 14 15 16 |
Top |
Related drugs of malignant transformation related genes |
| Identification of chemicals and drugs interact with genes involved in malignant transfromation |
| (DGIdb 4.0) |
| Entrez ID | Symbol | Category | Interaction Types | Drug Claim Name | Drug Name | PMIDs |
| Page: 1 |

Copyright 2023-Present -The University of Texas Health Science Center at Houston |