| Tissue | Expression Dynamics | Abbreviation |
| Cervix | 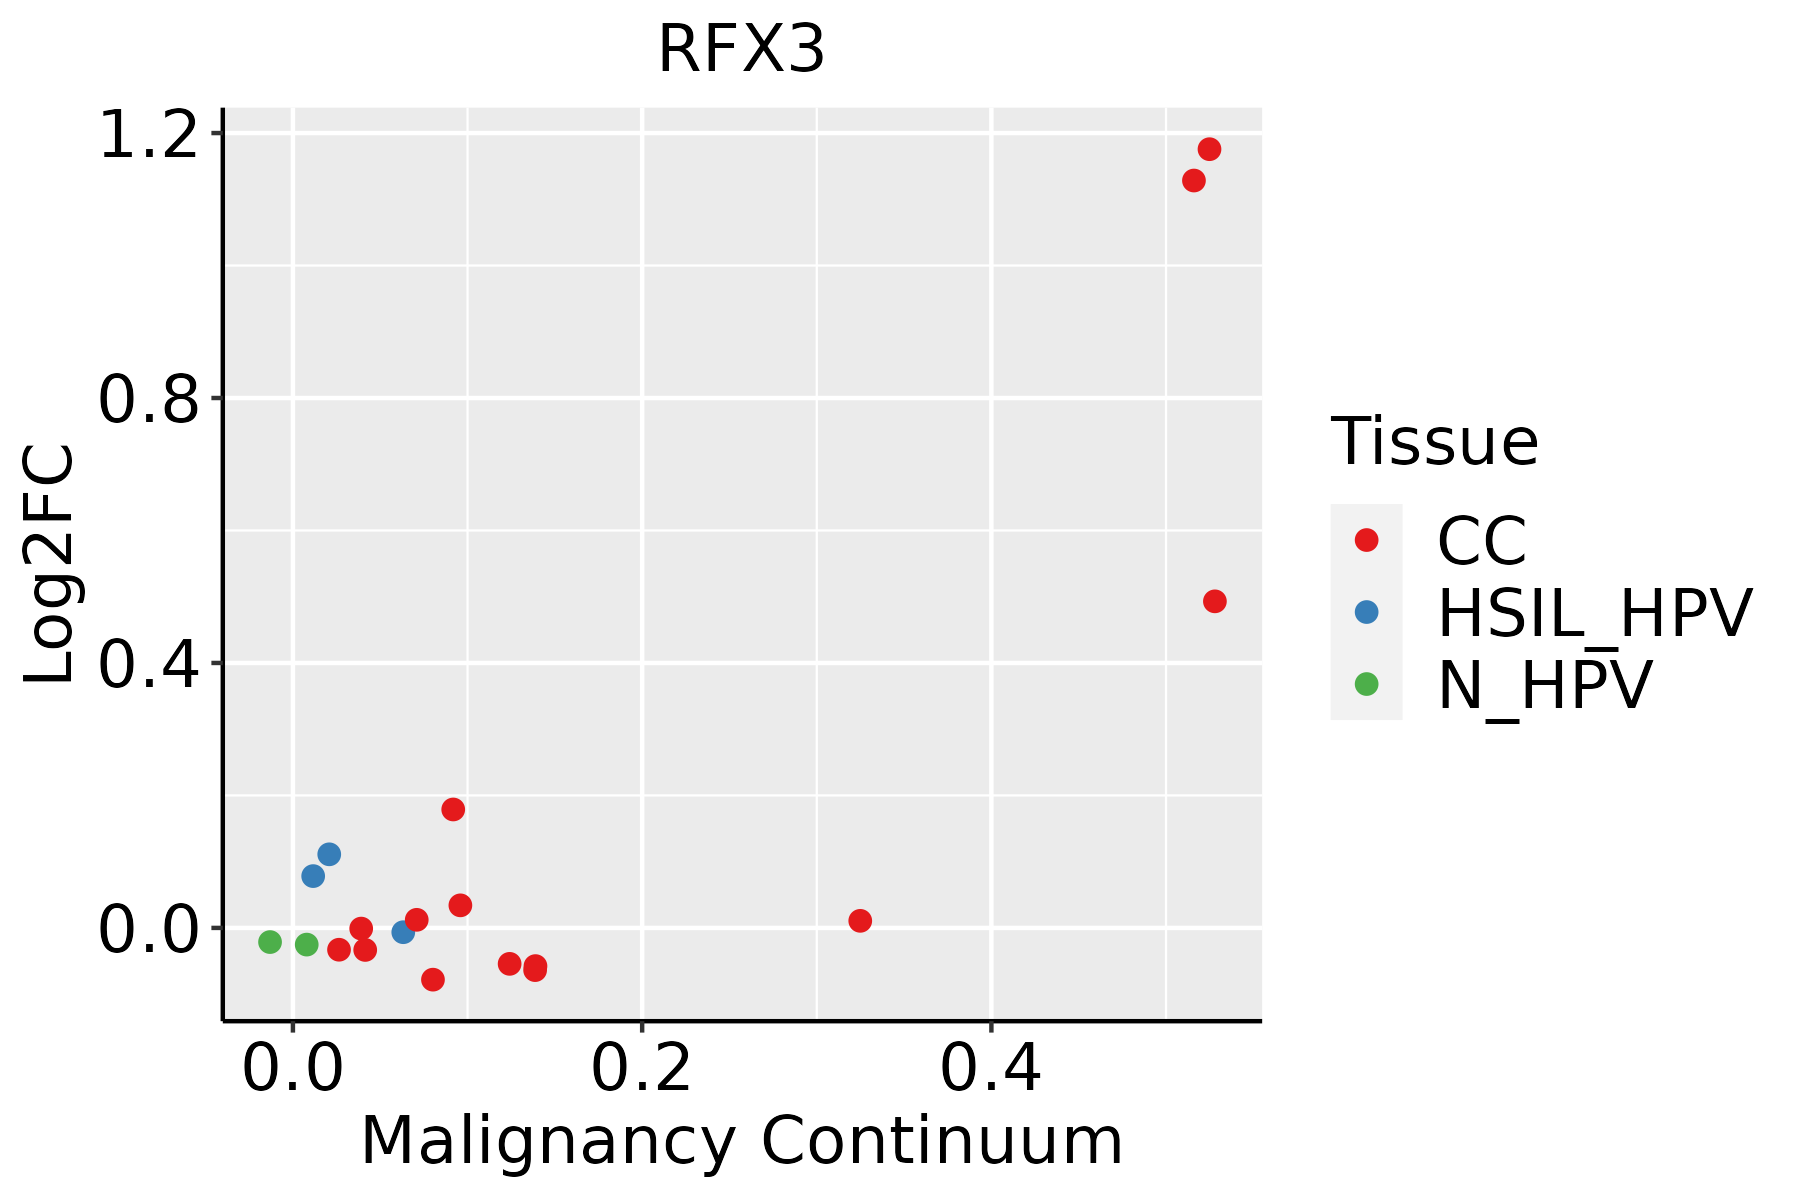 | CC: Cervix cancer |
| HSIL_HPV: HPV-infected high-grade squamous intraepithelial lesions |
| N_HPV: HPV-infected normal cervix |
| Colorectum (GSE201348) |  | FAP: Familial adenomatous polyposis |
| CRC: Colorectal cancer |
| Colorectum (HTA11) |  | AD: Adenomas |
| SER: Sessile serrated lesions |
| MSI-H: Microsatellite-high colorectal cancer |
| MSS: Microsatellite stable colorectal cancer |
| Endometrium |  | AEH: Atypical endometrial hyperplasia |
| EEC: Endometrioid Cancer |
| Lung | 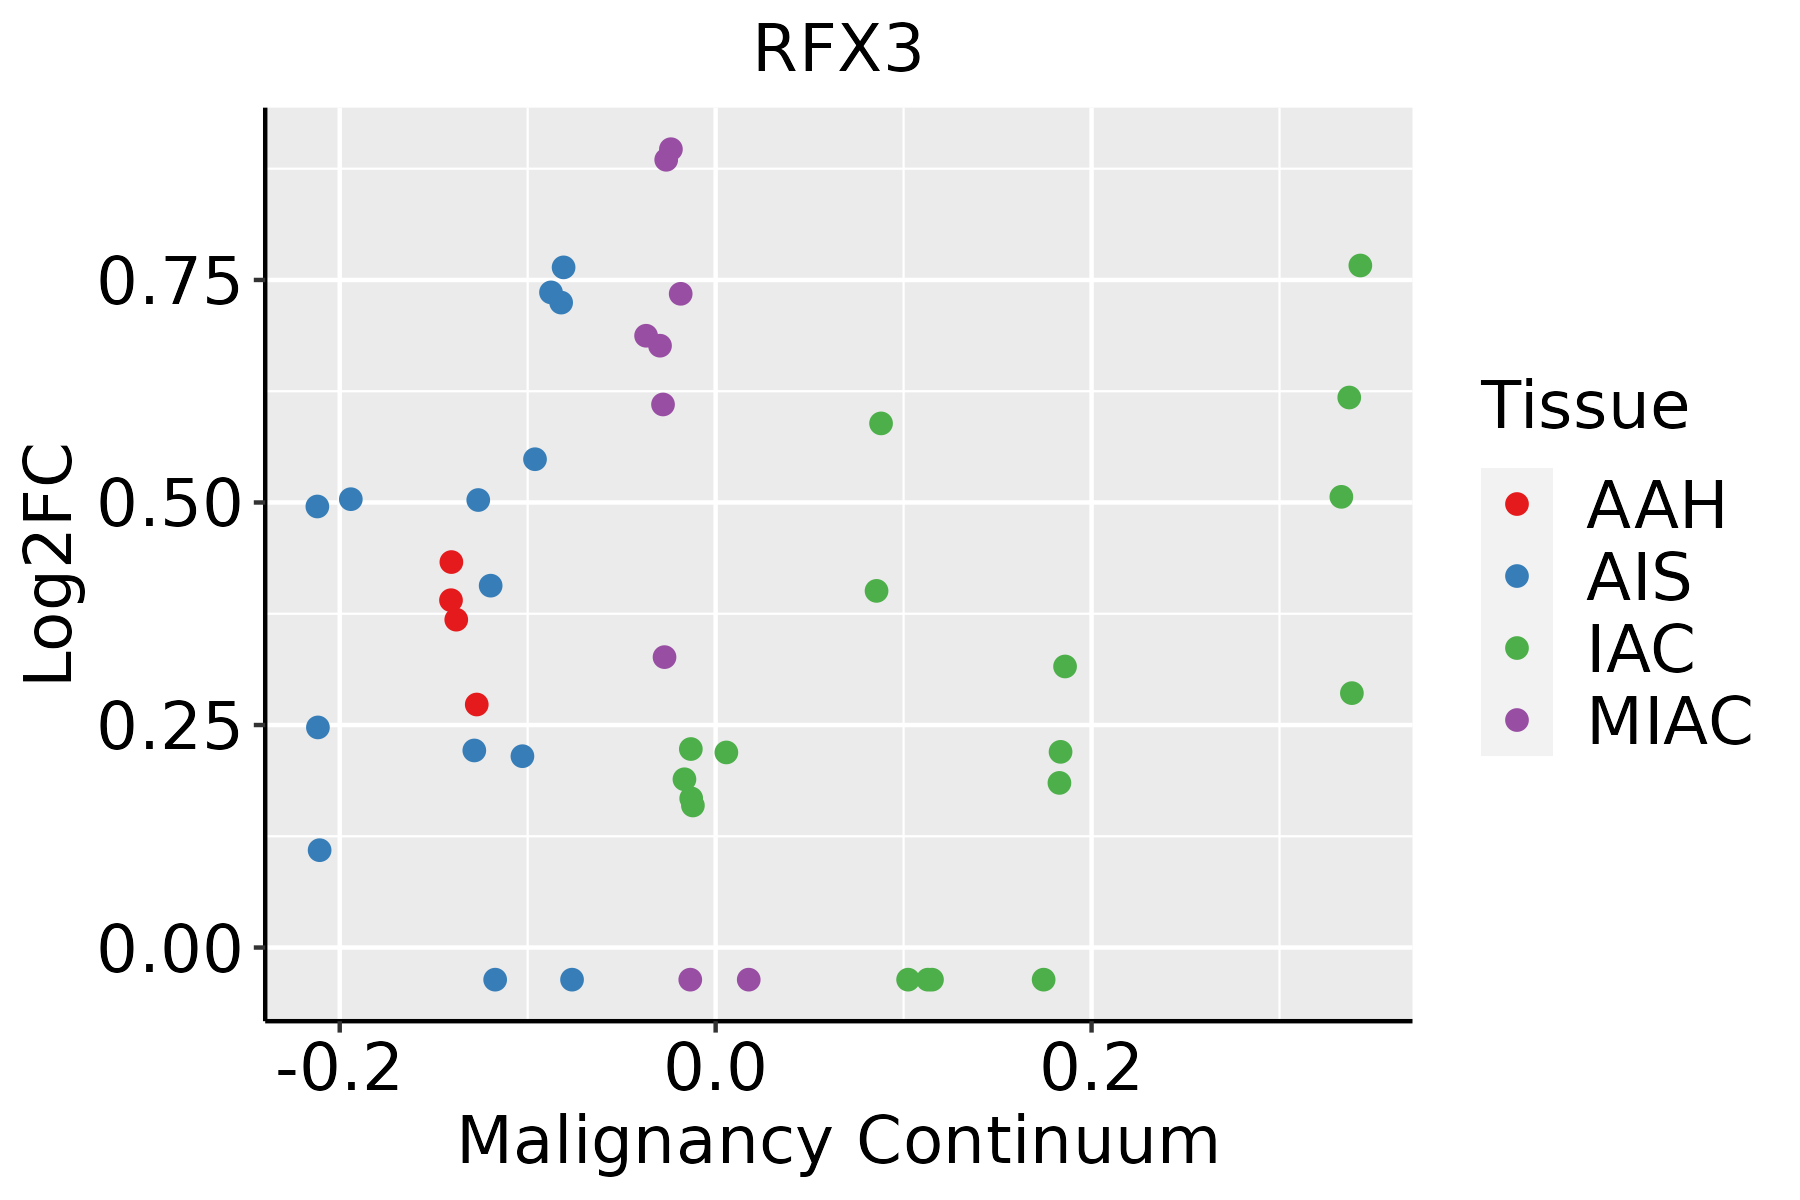 | AAH: Atypical adenomatous hyperplasia |
| AIS: Adenocarcinoma in situ |
| IAC: Invasive lung adenocarcinoma |
| MIA: Minimally invasive adenocarcinoma |
| GO ID | Tissue | Disease Stage | Description | Gene Ratio | Bg Ratio | pvalue | p.adjust | Count |
| GO:00107206 | Cervix | CC | positive regulation of cell development | 64/2311 | 298/18723 | 5.69e-06 | 1.41e-04 | 64 |
| GO:00308563 | Cervix | CC | regulation of epithelial cell differentiation | 36/2311 | 154/18723 | 1.02e-04 | 1.31e-03 | 36 |
| GO:000206410 | Cervix | CC | epithelial cell development | 45/2311 | 220/18723 | 4.14e-04 | 4.21e-03 | 45 |
| GO:00158337 | Cervix | CC | peptide transport | 46/2311 | 264/18723 | 9.69e-03 | 4.78e-02 | 46 |
| GO:0002064 | Colorectum | AD | epithelial cell development | 89/3918 | 220/18723 | 2.98e-11 | 3.52e-09 | 89 |
| GO:0050708 | Colorectum | AD | regulation of protein secretion | 83/3918 | 268/18723 | 6.59e-05 | 1.07e-03 | 83 |
| GO:0009306 | Colorectum | AD | protein secretion | 105/3918 | 359/18723 | 1.05e-04 | 1.57e-03 | 105 |
| GO:0035592 | Colorectum | AD | establishment of protein localization to extracellular region | 105/3918 | 360/18723 | 1.18e-04 | 1.73e-03 | 105 |
| GO:0071692 | Colorectum | AD | protein localization to extracellular region | 106/3918 | 368/18723 | 1.86e-04 | 2.49e-03 | 106 |
| GO:0050796 | Colorectum | AD | regulation of insulin secretion | 54/3918 | 165/18723 | 2.60e-04 | 3.25e-03 | 54 |
| GO:0010720 | Colorectum | AD | positive regulation of cell development | 87/3918 | 298/18723 | 4.17e-04 | 4.71e-03 | 87 |
| GO:0030073 | Colorectum | AD | insulin secretion | 61/3918 | 195/18723 | 4.28e-04 | 4.81e-03 | 61 |
| GO:0015833 | Colorectum | AD | peptide transport | 77/3918 | 264/18723 | 8.90e-04 | 8.60e-03 | 77 |
| GO:0090087 | Colorectum | AD | regulation of peptide transport | 60/3918 | 202/18723 | 1.94e-03 | 1.58e-02 | 60 |
| GO:0030072 | Colorectum | AD | peptide hormone secretion | 68/3918 | 236/18723 | 2.39e-03 | 1.85e-02 | 68 |
| GO:0002791 | Colorectum | AD | regulation of peptide secretion | 59/3918 | 200/18723 | 2.50e-03 | 1.92e-02 | 59 |
| GO:0090276 | Colorectum | AD | regulation of peptide hormone secretion | 58/3918 | 196/18723 | 2.51e-03 | 1.92e-02 | 58 |
| GO:0002790 | Colorectum | AD | peptide secretion | 69/3918 | 242/18723 | 2.97e-03 | 2.22e-02 | 69 |
| GO:0042886 | Colorectum | AD | amide transport | 83/3918 | 301/18723 | 3.37e-03 | 2.46e-02 | 83 |
| GO:00020641 | Colorectum | SER | epithelial cell development | 64/2897 | 220/18723 | 1.96e-07 | 1.10e-05 | 64 |
| TF | Cell Type | Tissue | Disease Stage | Target Gene | RSS | Regulon Activity |
| RFX3 | FIB | Breast | ADJ | MIR181A1HG,ANKRD42,ANKRD44, etc. | 5.02e-02 |  |
| RFX3 | CD8TEXP | Endometrium | ADJ | ZBTB20,SIK3,ARHGAP15, etc. | 2.48e-01 |  |
| RFX3 | BMEM | Endometrium | EEC | ZBTB20,SIK3,ARHGAP15, etc. | 1.22e-01 |  |
| RFX3 | TH17 | Endometrium | EEC | ZBTB20,SIK3,ARHGAP15, etc. | 5.09e-02 | |
| RFX3 | CD8TEXP | Endometrium | EEC | ZBTB20,SIK3,ARHGAP15, etc. | 1.31e-01 | |
| RFX3 | TREG | Lung | ADJ | ARHGAP15,SIK3,ZBTB20, etc. | 8.52e-02 |  |
| RFX3 | CD4TN | Lung | ADJ | ARHGAP15,SIK3,ZBTB20, etc. | 1.45e-01 | |
| RFX3 | PANIN | Pancreas | ADJ | RFX2,LRRIQ1,EFCAB2, etc. | 6.24e-02 |  |
| RFX3 | CD4TN | Skin | ADJ | JUND,ZBTB20,SIK3, etc. | 1.94e-01 |  |
| RFX3 | CD8TEXP | Skin | cSCC | JUND,ZBTB20,SIK3, etc. | 1.49e-01 |  |
| Hugo Symbol | Variant Class | Variant Classification | dbSNP RS | HGVSc | HGVSp | HGVSp Short | SWISSPROT | BIOTYPE | SIFT | PolyPhen | Tumor Sample Barcode | Tissue | Histology | Sex | Age | Stage | Therapy Types | Drugs | Outcome |
| RFX3 | SNV | Missense_Mutation | novel | c.1490N>A | p.Arg497Gln | p.R497Q | P48380 | protein_coding | deleterious(0.02) | possibly_damaging(0.639) | TCGA-AN-A046-01 | Breast | breast invasive carcinoma | Female | >=65 | I/II | Unknown | Unknown | SD |
| RFX3 | SNV | Missense_Mutation | | c.209N>A | p.Gly70Glu | p.G70E | P48380 | protein_coding | deleterious(0) | probably_damaging(0.998) | TCGA-AR-A1AX-01 | Breast | breast invasive carcinoma | Female | <65 | I/II | Chemotherapy | cytoxan | SD |
| RFX3 | SNV | Missense_Mutation | novel | c.160C>T | p.Pro54Ser | p.P54S | P48380 | protein_coding | tolerated(0.35) | possibly_damaging(0.609) | TCGA-AR-A251-01 | Breast | breast invasive carcinoma | Female | <65 | III/IV | Chemotherapy | doxorubicin | SD |
| RFX3 | SNV | Missense_Mutation | | c.1129N>A | p.Glu377Lys | p.E377K | P48380 | protein_coding | deleterious(0) | benign(0.041) | TCGA-BH-A0W7-01 | Breast | breast invasive carcinoma | Female | <65 | I/II | Chemotherapy | taxotere | CR |
| RFX3 | SNV | Missense_Mutation | novel | c.581N>G | p.Ala194Gly | p.A194G | P48380 | protein_coding | deleterious(0.01) | possibly_damaging(0.842) | TCGA-D8-A13Y-01 | Breast | breast invasive carcinoma | Female | <65 | I/II | Chemotherapy | doxorubicin | SD |
| RFX3 | SNV | Missense_Mutation | | c.1042N>A | p.Glu348Lys | p.E348K | P48380 | protein_coding | tolerated(0.13) | benign(0.101) | TCGA-D8-A27G-01 | Breast | breast invasive carcinoma | Female | >=65 | I/II | Unknown | Unknown | SD |
| RFX3 | SNV | Missense_Mutation | | c.1499C>A | p.Thr500Lys | p.T500K | P48380 | protein_coding | deleterious(0) | probably_damaging(0.985) | TCGA-E2-A159-01 | Breast | breast invasive carcinoma | Female | <65 | I/II | Chemotherapy | cyclophosphamide | SD |
| RFX3 | insertion | Frame_Shift_Ins | novel | c.135_136insT | p.Val46CysfsTer50 | p.V46Cfs*50 | P48380 | protein_coding | | | TCGA-A7-A13E-01 | Breast | breast invasive carcinoma | Female | <65 | I/II | Targeted Molecular therapy | bevacizumab | PD |
| RFX3 | insertion | Frame_Shift_Ins | novel | c.1747_1748insAAAGATTAAAAACAGCATTTATGACCTTTGTAGGT | p.Pro583GlnfsTer29 | p.P583Qfs*29 | P48380 | protein_coding | | | TCGA-A8-A06P-01 | Breast | breast invasive carcinoma | Female | <65 | III/IV | Unspecific | | SD |
| RFX3 | SNV | Missense_Mutation | rs777692576 | c.190N>A | p.Asp64Asn | p.D64N | P48380 | protein_coding | deleterious(0.05) | benign(0.077) | TCGA-2W-A8YY-01 | Cervix | cervical & endocervical cancer | Female | <65 | I/II | Chemotherapy | cisplatin | CR |


