
|
|||||
|
 | |
| |
| |
| |
| |
| |
|
Gene: RFX1 |
Gene summary for RFX1 |
| Gene information | Species | Human | Gene symbol | RFX1 | Gene ID | 5989 |
| Gene name | regulatory factor X1 | |
| Gene Alias | EFC | |
| Cytomap | 19p13.12 | |
| Gene Type | protein-coding | GO ID | GO:0002376 | UniProtAcc | P22670 |
Top |
Malignant transformation analysis |
| Identification of the aberrant gene expression in precancerous and cancerous lesions by comparing the gene expression of stem-like cells in diseased tissues with normal stem cells |
| Entrez ID | Symbol | Replicates | Species | Organ | Tissue | Adj P-value | Log2FC | Malignancy |
| 5989 | RFX1 | male-WTA | Human | Thyroid | PTC | 6.68e-27 | 2.75e-01 | 0.1037 |
| 5989 | RFX1 | PTC01 | Human | Thyroid | PTC | 1.20e-16 | 1.63e-01 | 0.1899 |
| 5989 | RFX1 | PTC04 | Human | Thyroid | PTC | 8.96e-14 | 2.72e-01 | 0.1927 |
| 5989 | RFX1 | PTC05 | Human | Thyroid | PTC | 1.17e-18 | 6.55e-01 | 0.2065 |
| 5989 | RFX1 | PTC06 | Human | Thyroid | PTC | 3.86e-29 | 6.87e-01 | 0.2057 |
| 5989 | RFX1 | PTC07 | Human | Thyroid | PTC | 1.26e-47 | 7.26e-01 | 0.2044 |
| 5989 | RFX1 | ATC12 | Human | Thyroid | ATC | 4.49e-11 | 1.74e-01 | 0.34 |
| 5989 | RFX1 | ATC13 | Human | Thyroid | ATC | 1.71e-27 | 5.63e-01 | 0.34 |
| 5989 | RFX1 | ATC4 | Human | Thyroid | ATC | 1.99e-11 | 2.58e-01 | 0.34 |
| 5989 | RFX1 | ATC5 | Human | Thyroid | ATC | 3.37e-30 | 6.13e-01 | 0.34 |
| Page: 1 |
| Tissue | Expression Dynamics | Abbreviation |
| Thyroid | 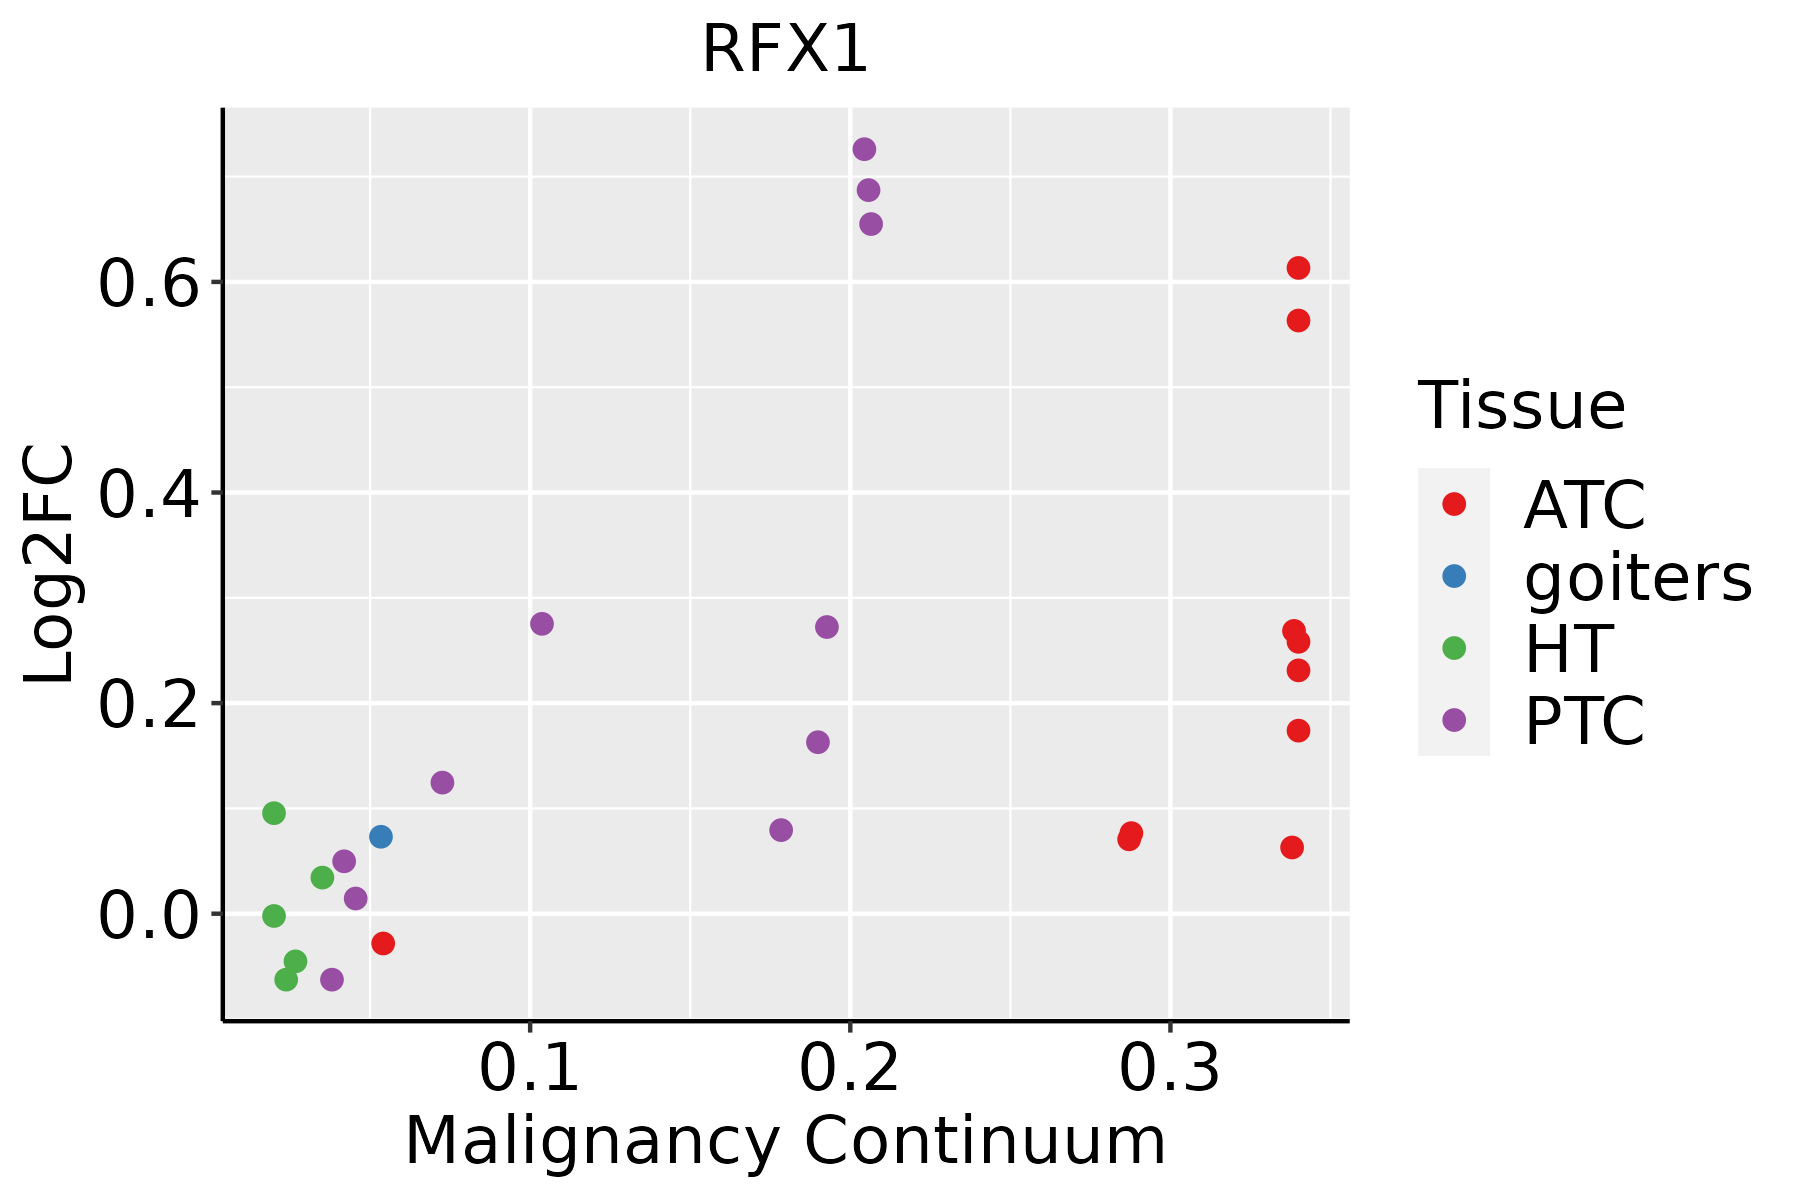 | ATC: Anaplastic thyroid cancer |
| HT: Hashimoto's thyroiditis | ||
| PTC: Papillary thyroid cancer |
| ∗log2FC in expression of this searched gene in stem-like cells from each diseased tissue sample relative to stem-like cells in normal samples in each tissue plotted against the malignancy continuum. Samples are colored based on if they are from different disease stage. |
Top |
Malignant transformation related pathway analysis |
| Find out the enriched GO biological processes and KEGG pathways involved in transition from healthy to precancer to cancer |
| Tissue | Disease Stage | Enriched GO biological Processes |
| Colorectum | AD |  |
| Colorectum | SER |  |
| Colorectum | MSS |  |
| Colorectum | MSI-H |  |
| Colorectum | FAP |  |
| ∗Top 15 enriched GO BP terms are showed in the bar plot of each disease state in each tissue. Each row represents a significant GO biological process which is colored according to the -log10(p.adjust). |
| Page: 1 2 3 4 5 6 7 8 9 |
| GO ID | Tissue | Disease Stage | Description | Gene Ratio | Bg Ratio | pvalue | p.adjust | Count |
| Page: 1 |
| Pathway ID | Tissue | Disease Stage | Description | Gene Ratio | Bg Ratio | pvalue | p.adjust | qvalue | Count |
| Page: 1 |
Top |
Cell-cell communication analysis |
| Identification of potential cell-cell interactions between two cell types and their ligand-receptor pairs for different disease states |
| Ligand | Receptor | LRpair | Pathway | Tissue | Disease Stage |
| Page: 1 |
Top |
Single-cell gene regulatory network inference analysis |
| Find out the significant the regulons (TFs) and the target genes of each regulon across cell types for different disease states |
| TF | Cell Type | Tissue | Disease Stage | Target Gene | RSS | Regulon Activity |
| RFX1 | MAIT | Liver | Healthy | RAB33A,TGFB1,WBP1, etc. | 1.16e-02 |  |
| RFX1 | GC | Stomach | Healthy | IQCG,SGSM3,SYNGAP1, etc. | 1.26e-02 |  |
| RFX1 | MAIT | Stomach | Healthy | IQCG,SGSM3,SYNGAP1, etc. | 8.56e-03 | |
| RFX1 | TH17 | Stomach | SIM | IQCG,SGSM3,SYNGAP1, etc. | 5.49e-02 |  |
| RFX1 | CD8TEXINT | Stomach | WIM | IQCG,SGSM3,SYNGAP1, etc. | 4.47e-02 |  |
| RFX1 | ECM | Thyroid | ATC | AC090125.1,TDO2,SPON2, etc. | 2.12e-01 |  |
| RFX1 | LYMEND | Thyroid | goiters | AC090125.1,TDO2,SPON2, etc. | 2.71e-02 |  |
| RFX1 | LYMEND | Thyroid | PTC | AC090125.1,TDO2,SPON2, etc. | 9.43e-02 |  |
| ∗The dot plots of a searched regulon are shown for all cell subpopulations in each disease state of each tissue based on the regulon specific score inferred using pySCENIC and by calculating the average expression. |
| Page: 1 |
Top |
Somatic mutation of malignant transformation related genes |
| Annotation of somatic variants for genes involved in malignant transformation |
| Hugo Symbol | Variant Class | Variant Classification | dbSNP RS | HGVSc | HGVSp | HGVSp Short | SWISSPROT | BIOTYPE | SIFT | PolyPhen | Tumor Sample Barcode | Tissue | Histology | Sex | Age | Stage | Therapy Types | Drugs | Outcome |
| RFX1 | SNV | Missense_Mutation | c.2009N>G | p.Leu670Arg | p.L670R | P22670 | protein_coding | deleterious(0) | possibly_damaging(0.786) | TCGA-A2-A1FW-01 | Breast | breast invasive carcinoma | Female | <65 | III/IV | Chemotherapy | cytoxan | SD | |
| RFX1 | SNV | Missense_Mutation | c.2143N>C | p.Ala715Pro | p.A715P | P22670 | protein_coding | deleterious(0.01) | probably_damaging(0.991) | TCGA-A7-A0CE-01 | Breast | breast invasive carcinoma | Female | <65 | I/II | Chemotherapy | adriamycin | SD | |
| RFX1 | SNV | Missense_Mutation | novel | c.2764N>A | p.Asp922Asn | p.D922N | P22670 | protein_coding | deleterious(0.03) | possibly_damaging(0.484) | TCGA-A7-A3IY-01 | Breast | breast invasive carcinoma | Female | >=65 | I/II | Hormone Therapy | anastrozole | SD |
| RFX1 | SNV | Missense_Mutation | c.2282C>T | p.Ala761Val | p.A761V | P22670 | protein_coding | deleterious(0) | benign(0.269) | TCGA-AO-A128-01 | Breast | breast invasive carcinoma | Female | <65 | I/II | Chemotherapy | doxorubicin | SD | |
| RFX1 | SNV | Missense_Mutation | c.1339N>C | p.Glu447Gln | p.E447Q | P22670 | protein_coding | deleterious(0.01) | probably_damaging(0.992) | TCGA-AR-A0TX-01 | Breast | breast invasive carcinoma | Female | <65 | I/II | Unknown | Unknown | SD | |
| RFX1 | SNV | Missense_Mutation | rs754841032 | c.529N>T | p.Arg177Cys | p.R177C | P22670 | protein_coding | deleterious_low_confidence(0) | benign(0.386) | TCGA-BH-A18G-01 | Breast | breast invasive carcinoma | Female | >=65 | I/II | Unknown | Unknown | SD |
| RFX1 | SNV | Missense_Mutation | c.1464N>A | p.Phe488Leu | p.F488L | P22670 | protein_coding | deleterious(0.01) | probably_damaging(0.999) | TCGA-D8-A27G-01 | Breast | breast invasive carcinoma | Female | >=65 | I/II | Unknown | Unknown | SD | |
| RFX1 | SNV | Missense_Mutation | novel | c.2635N>T | p.Arg879Trp | p.R879W | P22670 | protein_coding | deleterious(0) | probably_damaging(0.998) | TCGA-2W-A8YY-01 | Cervix | cervical & endocervical cancer | Female | <65 | I/II | Chemotherapy | cisplatin | CR |
| RFX1 | SNV | Missense_Mutation | c.2671N>A | p.Glu891Lys | p.E891K | P22670 | protein_coding | deleterious(0) | probably_damaging(0.983) | TCGA-C5-A1MH-01 | Cervix | cervical & endocervical cancer | Female | >=65 | III/IV | Chemotherapy | cisplatin | PD | |
| RFX1 | SNV | Missense_Mutation | novel | c.517N>T | p.Leu173Phe | p.L173F | P22670 | protein_coding | tolerated_low_confidence(0.07) | benign(0.001) | TCGA-C5-A8XK-01 | Cervix | cervical & endocervical cancer | Female | <65 | I/II | Chemotherapy | cisplatin | SD |
| Page: 1 2 3 4 5 6 7 8 |
Top |
Related drugs of malignant transformation related genes |
| Identification of chemicals and drugs interact with genes involved in malignant transfromation |
| (DGIdb 4.0) |
| Entrez ID | Symbol | Category | Interaction Types | Drug Claim Name | Drug Name | PMIDs |
| Page: 1 |

Copyright 2023-Present -The University of Texas Health Science Center at Houston |