Schematic overview of the cellular and molecular mechanisms involved in the cancer progression, including the proposed cellular and molecular mechanisms in cancer cells trajectory. AT1: alveolar type 1 cells; AT2: alveolar type 2 cells; AAH: atypical adenomatous hyperplasia; AIS: adenocarcinoma in situ; MIA: minimally invasive adenocarcinoma; IA: invasive adenocarcinoma; EMT: epithelial-mesenchymal transition

Home

Download

Statistics

Help

Contact

Center for Computational Systems Medicine
leaf

Gene summary

leaf

Malignant transformation analysis

leaf

Malignant transformation related pathway analysis

leaf

Cell-cell communication analysis

leaf

Single-cell gene regulatory network inference analysis

leaf

Somatic mutation of malignant transformation related genes

leaf

Related drugs of malignant transformation related genes

Gene: RFWD2

Gene summary for RFWD2

check button Gene summary.

Gene informationSpeciesHuman
Gene symbol

RFWD2

Gene ID

64326

Gene nameCOP1 E3 ubiquitin ligase
Gene AliasCFAP78
Cytomap1q25.1-q25.2
Gene Typeprotein-coding
GO ID

GO:0006464

UniProtAcc

Q8NHY2


Top

Malignant transformation analysis

check button Identification of the aberrant gene expression in precancerous and cancerous lesions by comparing the gene expression of stem-like cells in diseased tissues with normal stem cells
check button Malignant transformation involving gene list.
Entrez IDSymbolReplicatesSpeciesOrganTissueAdj P-valueLog2FCMalignancy
64326RFWD2HTA11_99999970781_79442HumanColorectumMSS2.69e-518.10e-010.294
64326RFWD2HTA11_99999965062_69753HumanColorectumMSI-H4.49e-261.81e+000.3487
64326RFWD2HTA11_99999965104_69814HumanColorectumMSS1.46e-591.47e+000.281
64326RFWD2HTA11_99999971662_82457HumanColorectumMSS2.28e-387.98e-010.3859
64326RFWD2HTA11_99999973899_84307HumanColorectumMSS1.52e-206.49e-010.2585
64326RFWD2HTA11_99999974143_84620HumanColorectumMSS2.21e-315.70e-010.3005
64326RFWD2AEH-subject1HumanEndometriumAEH4.06e-07-1.26e-01-0.3059
64326RFWD2AEH-subject2HumanEndometriumAEH1.04e-05-1.26e-01-0.2525
64326RFWD2AEH-subject3HumanEndometriumAEH1.87e-06-1.26e-01-0.2576
64326RFWD2AEH-subject4HumanEndometriumAEH8.47e-04-1.26e-01-0.2657
64326RFWD2AEH-subject5HumanEndometriumAEH1.87e-06-1.26e-01-0.2953
64326RFWD2EEC-subject1HumanEndometriumEEC8.53e-06-1.26e-01-0.2682
64326RFWD2EEC-subject2HumanEndometriumEEC1.88e-08-1.26e-01-0.2607
64326RFWD2EEC-subject3HumanEndometriumEEC3.99e-06-1.26e-01-0.2525
64326RFWD2EEC-subject4HumanEndometriumEEC8.71e-07-1.26e-01-0.2571
64326RFWD2EEC-subject5HumanEndometriumEEC1.89e-07-1.26e-01-0.249
64326RFWD2GSM5276934HumanEndometriumEEC3.99e-06-1.26e-01-0.0913
64326RFWD2GSM5276935HumanEndometriumEEC8.77e-08-1.26e-01-0.123
64326RFWD2GSM5276937HumanEndometriumEEC3.33e-05-1.26e-01-0.0897
64326RFWD2GSM6177620_NYU_UCEC1_lib1_lib1HumanEndometriumEEC3.59e-04-1.26e-01-0.1869
Page: 1 2 3 4 5 6 

check button Transcriptomic changes along malignancy continuum.
TissueExpression DynamicsAbbreviation
Colorectum (GSE201348)The image shows the transcriptomic changes along malignancy continuum.log2FC in expression of this searched gene in stem-like cells from each diseased tissue sample relative to stem-like cells in normal samples in each tissue plotted against the malignancy continuum. Samples are colored based on if they are from different disease stage.FAP: Familial adenomatous polyposis
CRC: Colorectal cancer
Colorectum (HTA11)The image shows the transcriptomic changes along malignancy continuum.log2FC in expression of this searched gene in stem-like cells from each diseased tissue sample relative to stem-like cells in normal samples in each tissue plotted against the malignancy continuum. Samples are colored based on if they are from different disease stage.AD: Adenomas
SER: Sessile serrated lesions
MSI-H: Microsatellite-high colorectal cancer
MSS: Microsatellite stable colorectal cancer
EndometriumThe image shows the transcriptomic changes along malignancy continuum.log2FC in expression of this searched gene in stem-like cells from each diseased tissue sample relative to stem-like cells in normal samples in each tissue plotted against the malignancy continuum. Samples are colored based on if they are from different disease stage.
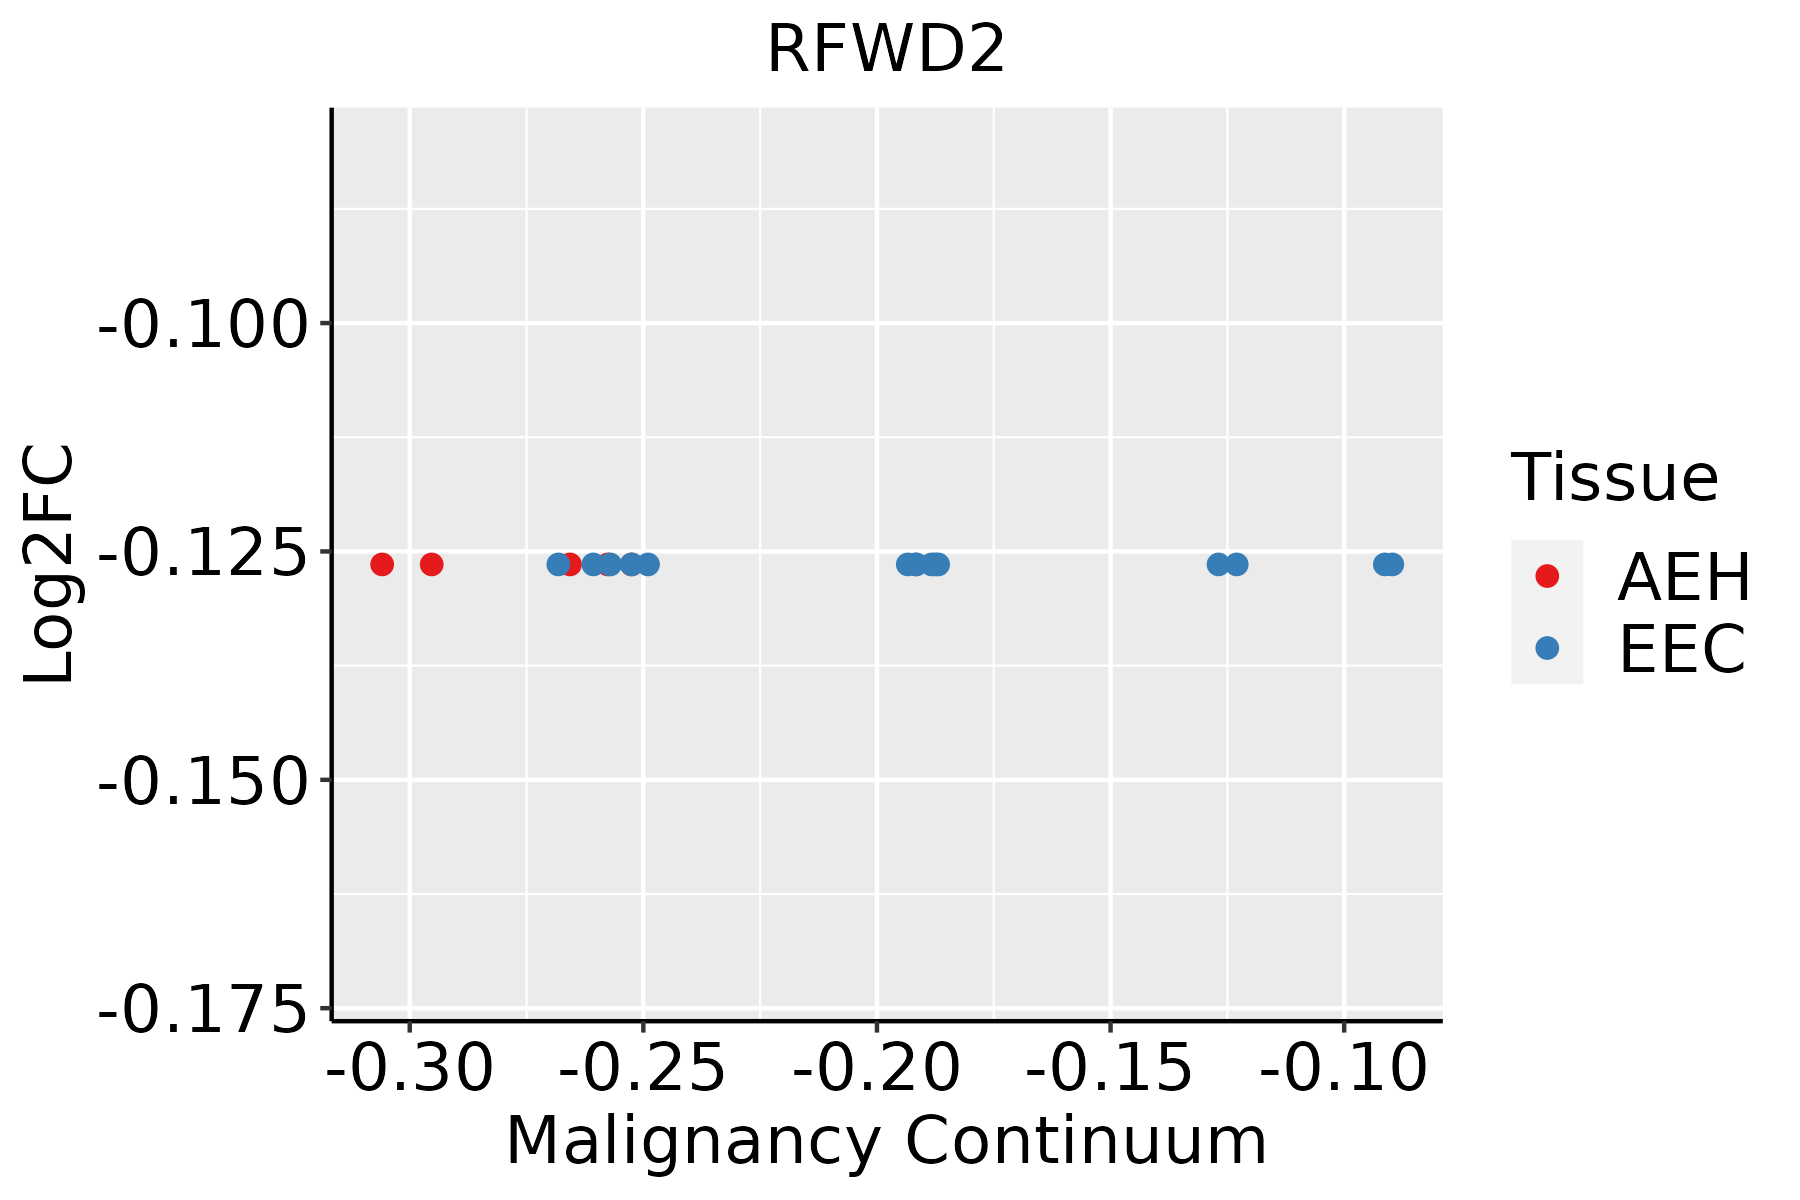
AEH: Atypical endometrial hyperplasia
EEC: Endometrioid Cancer
EsophagusThe image shows the transcriptomic changes along malignancy continuum.log2FC in expression of this searched gene in stem-like cells from each diseased tissue sample relative to stem-like cells in normal samples in each tissue plotted against the malignancy continuum. Samples are colored based on if they are from different disease stage.ESCC: Esophageal squamous cell carcinoma
HGIN: High-grade intraepithelial neoplasias
LGIN: Low-grade intraepithelial neoplasias
LiverThe image shows the transcriptomic changes along malignancy continuum.log2FC in expression of this searched gene in stem-like cells from each diseased tissue sample relative to stem-like cells in normal samples in each tissue plotted against the malignancy continuum. Samples are colored based on if they are from different disease stage.
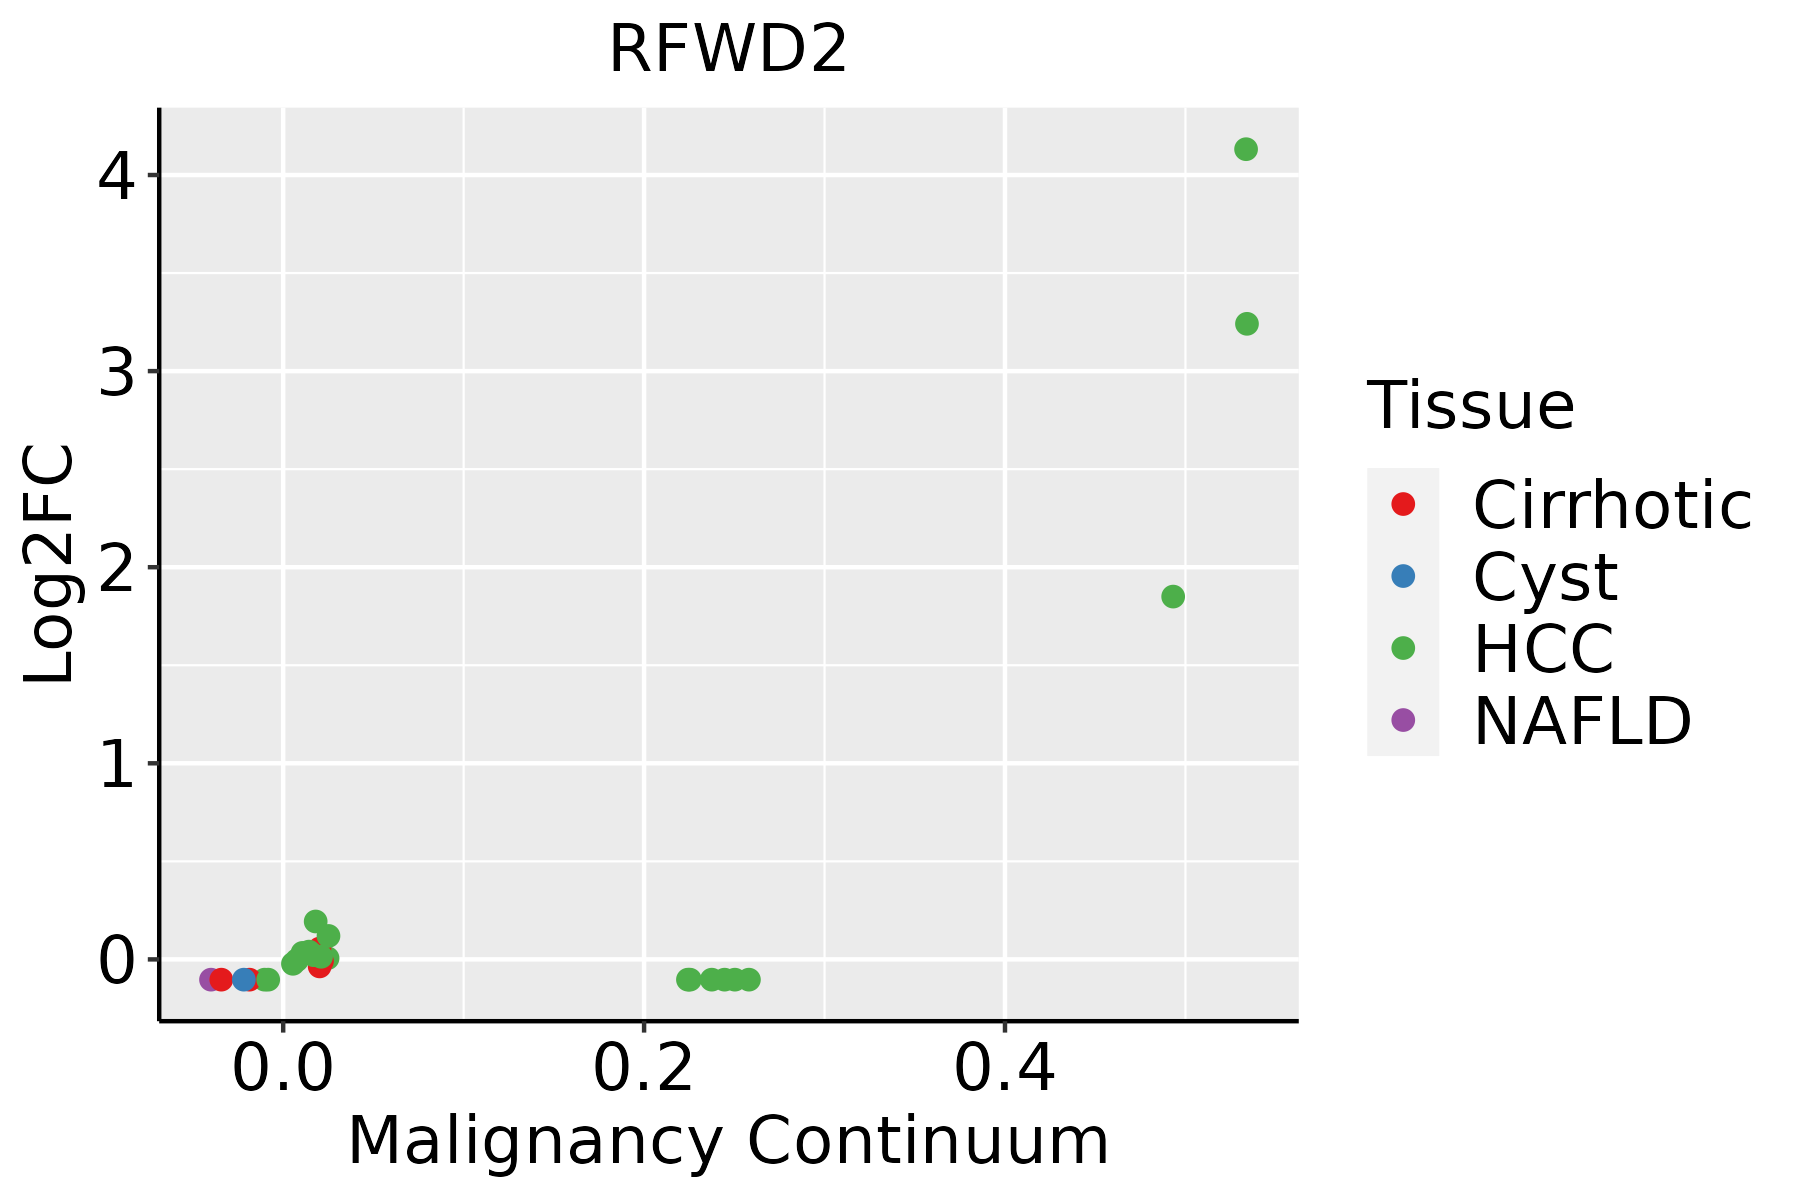
HCC: Hepatocellular carcinoma
NAFLD: Non-alcoholic fatty liver disease
Oral CavityThe image shows the transcriptomic changes along malignancy continuum.log2FC in expression of this searched gene in stem-like cells from each diseased tissue sample relative to stem-like cells in normal samples in each tissue plotted against the malignancy continuum. Samples are colored based on if they are from different disease stage.EOLP: Erosive Oral lichen planus
LP: leukoplakia
NEOLP: Non-erosive oral lichen planus
OSCC: Oral squamous cell carcinoma
SkinThe image shows the transcriptomic changes along malignancy continuum.log2FC in expression of this searched gene in stem-like cells from each diseased tissue sample relative to stem-like cells in normal samples in each tissue plotted against the malignancy continuum. Samples are colored based on if they are from different disease stage.
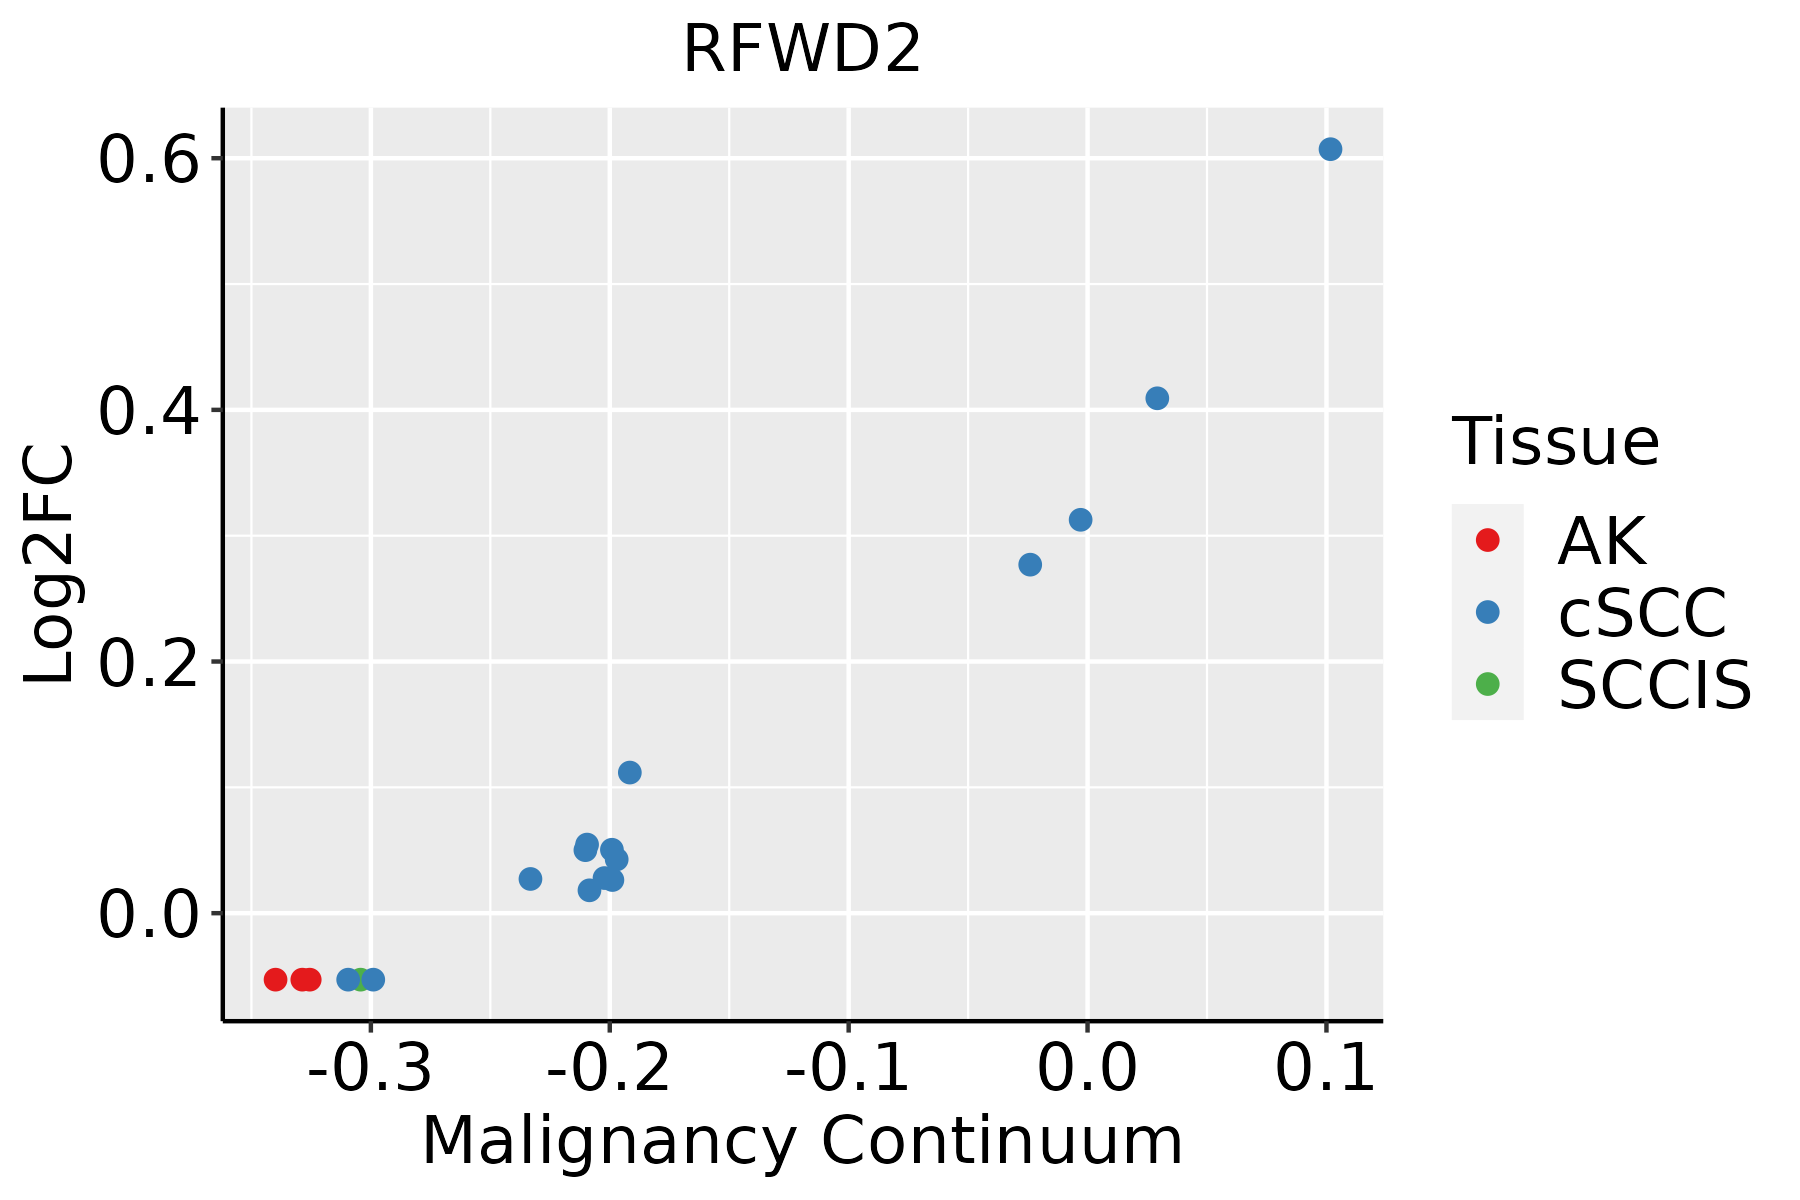
AK: Actinic keratosis
cSCC: Cutaneous squamous cell carcinoma
SCCIS:squamous cell carcinoma in situ
∗log2FC in expression of this searched gene in stem-like cells from each diseased tissue sample relative to stem-like cells in normal samples in each tissue plotted against the malignancy continuum. Samples are colored based on if they are from different disease stage.

Top

Malignant transformation related pathway analysis

check buttonFind out the enriched GO biological processes and KEGG pathways involved in transition from healthy to precancer to cancer
check button Figure of enriched GO biological processes.
TissueDisease StageEnriched GO biological Processes
ColorectumADGO analysis - Figure of enriched GO biological processes: Top 15 enriched GO BP terms are showed in the bar plot of each disease state in each tissue. Each row represents a significant GO biological process which is colored according to the -log10(p.adjust).
ColorectumSERGO analysis - Figure of enriched GO biological processes: Top 15 enriched GO BP terms are showed in the bar plot of each disease state in each tissue. Each row represents a significant GO biological process which is colored according to the -log10(p.adjust).
ColorectumMSSGO analysis - Figure of enriched GO biological processes: Top 15 enriched GO BP terms are showed in the bar plot of each disease state in each tissue. Each row represents a significant GO biological process which is colored according to the -log10(p.adjust).
ColorectumMSI-HGO analysis - Figure of enriched GO biological processes: Top 15 enriched GO BP terms are showed in the bar plot of each disease state in each tissue. Each row represents a significant GO biological process which is colored according to the -log10(p.adjust).
ColorectumFAPGO analysis - Figure of enriched GO biological processes: Top 15 enriched GO BP terms are showed in the bar plot of each disease state in each tissue. Each row represents a significant GO biological process which is colored according to the -log10(p.adjust).
∗Top 15 enriched GO BP terms are showed in the bar plot of each disease state in each tissue. Each row represents a significant GO biological process which is colored according to the -log10(p.adjust).
Page: 1 2 3 4 5 6 7 8 9 

check button Enriched GO biological processes.
GO IDTissueDisease StageDescriptionGene RatioBg Ratiopvaluep.adjustCount
Page: 1 

check button Enriched KEGG pathways.
Pathway IDTissueDisease StageDescriptionGene RatioBg Ratiopvaluep.adjustqvalueCount
hsa0412014CervixCCUbiquitin mediated proteolysis49/1267142/84654.26e-097.68e-084.54e-0849
hsa0412015CervixCCUbiquitin mediated proteolysis49/1267142/84654.26e-097.68e-084.54e-0849
hsa04120ColorectumADUbiquitin mediated proteolysis58/2092142/84651.46e-051.53e-049.76e-0558
hsa041201ColorectumADUbiquitin mediated proteolysis58/2092142/84651.46e-051.53e-049.76e-0558
hsa041202ColorectumSERUbiquitin mediated proteolysis39/1580142/84656.18e-033.66e-022.66e-0239
hsa041203ColorectumSERUbiquitin mediated proteolysis39/1580142/84656.18e-033.66e-022.66e-0239
hsa041204ColorectumMSSUbiquitin mediated proteolysis55/1875142/84655.02e-066.00e-053.68e-0555
hsa041205ColorectumMSSUbiquitin mediated proteolysis55/1875142/84655.02e-066.00e-053.68e-0555
hsa041206ColorectumFAPUbiquitin mediated proteolysis51/1404142/84651.55e-085.84e-073.55e-0751
hsa041207ColorectumFAPUbiquitin mediated proteolysis51/1404142/84651.55e-085.84e-073.55e-0751
hsa0412016EndometriumAEHUbiquitin mediated proteolysis41/1197142/84653.42e-064.27e-053.13e-0541
hsa0412017EndometriumAEHUbiquitin mediated proteolysis41/1197142/84653.42e-064.27e-053.13e-0541
hsa0412023EndometriumEECUbiquitin mediated proteolysis41/1237142/84657.86e-069.58e-057.14e-0541
hsa0412033EndometriumEECUbiquitin mediated proteolysis41/1237142/84657.86e-069.58e-057.14e-0541
hsa0412010LiverNAFLDUbiquitin mediated proteolysis44/1043142/84652.59e-091.70e-071.37e-0744
hsa0412011LiverNAFLDUbiquitin mediated proteolysis44/1043142/84652.59e-091.70e-071.37e-0744
hsa0412021LiverCirrhoticUbiquitin mediated proteolysis72/2530142/84651.32e-071.97e-061.21e-0672
hsa0412031LiverCirrhoticUbiquitin mediated proteolysis72/2530142/84651.32e-071.97e-061.21e-0672
hsa0412041LiverHCCUbiquitin mediated proteolysis110/4020142/84651.67e-133.74e-122.08e-12110
hsa041156LiverHCCp53 signaling pathway46/402074/84657.64e-032.08e-021.16e-0246
Page: 1 2 

Top

Cell-cell communication analysis

check buttonIdentification of potential cell-cell interactions between two cell types and their ligand-receptor pairs for different disease states
LigandReceptorLRpairPathwayTissueDisease Stage
Page: 1 

Top

Single-cell gene regulatory network inference analysis

check buttonFind out the significant the regulons (TFs) and the target genes of each regulon across cell types for different disease states
TFCell TypeTissueDisease StageTarget GeneRSSRegulon Activity
∗The dot plots of a searched regulon are shown for all cell subpopulations in each disease state of each tissue based on the regulon specific score inferred using pySCENIC and by calculating the average expression.
Page: 1 

Top

Somatic mutation of malignant transformation related genes

check buttonAnnotation of somatic variants for genes involved in malignant transformation
Hugo SymbolVariant ClassVariant ClassificationdbSNP RSHGVScHGVSpHGVSp ShortSWISSPROTBIOTYPESIFTPolyPhenTumor Sample BarcodeTissueHistologySexAgeStageTherapy TypesDrugsOutcome
RFWD2SNVMissense_Mutationnovelc.1537N>Cp.Glu513Glnp.E513QQ8NHY2protein_codingdeleterious(0)probably_damaging(0.988)TCGA-5L-AAT1-01Breastbreast invasive carcinomaFemale<65III/IVHormone TherapyletrozolSD
RFWD2SNVMissense_Mutationnovelc.1011N>Ap.Phe337Leup.F337LQ8NHY2protein_codingtolerated(0.33)possibly_damaging(0.827)TCGA-5L-AAT1-01Breastbreast invasive carcinomaFemale<65III/IVHormone TherapyletrozolSD
RFWD2SNVMissense_Mutationrs753910989c.660G>Cp.Gln220Hisp.Q220HQ8NHY2protein_codingtolerated(0.07)probably_damaging(0.965)TCGA-AC-A23H-01Breastbreast invasive carcinomaFemale>=65I/IIUnknownUnknownPD
RFWD2SNVMissense_Mutationc.1412N>Tp.Ser471Leup.S471LQ8NHY2protein_codingdeleterious(0)probably_damaging(0.979)TCGA-E2-A1IL-01Breastbreast invasive carcinomaFemale>=65I/IIHormone TherapyarimidexSD
RFWD2insertionIn_Frame_Insnovelc.477_478insGAGAAAGAGTCCATGGGTCTCGGGAACTCAGGTTTGTTGp.Cys159_Ile160insGluLysGluSerMetGlyLeuGlyAsnSerGlyLeuLeup.C159_I160insEKESMGLGNSGLLQ8NHY2protein_codingTCGA-A2-A0CP-01Breastbreast invasive carcinomaFemale<65I/IIChemotherapycytoxanSD
RFWD2insertionIn_Frame_Insnovelc.1325_1326insTGTAAGp.Thr442_Lys443insValArgp.T442_K443insVRQ8NHY2protein_codingTCGA-AC-A3QQ-01Breastbreast invasive carcinomaFemale<65I/IIUnknownUnknownSD
RFWD2insertionFrame_Shift_Insnovelc.1324_1325insTp.Thr442IlefsTer5p.T442Ifs*5Q8NHY2protein_codingTCGA-AC-A3QQ-01Breastbreast invasive carcinomaFemale<65I/IIUnknownUnknownSD
RFWD2SNVMissense_Mutationnovelc.1846G>Ap.Ala616Thrp.A616TQ8NHY2protein_codingdeleterious(0)probably_damaging(0.989)TCGA-C5-A3HE-01Cervixcervical & endocervical cancerFemale<65I/IIUnknownUnknownPD
RFWD2SNVMissense_Mutationc.1625C>Gp.Ser542Cysp.S542CQ8NHY2protein_codingtolerated(0.49)probably_damaging(0.995)TCGA-IR-A3LF-01Cervixcervical & endocervical cancerFemale<65I/IIUnknownUnknownSD
RFWD2SNVMissense_Mutationnovelc.1636N>Cp.Asp546Hisp.D546HQ8NHY2protein_codingdeleterious(0)probably_damaging(0.994)TCGA-JW-A5VL-01Cervixcervical & endocervical cancerFemale<65I/IIUnknownUnknownSD
Page: 1 2 3 4 5 6 7 8 9 

Top

Related drugs of malignant transformation related genes

check buttonIdentification of chemicals and drugs interact with genes involved in malignant transfromation
(DGIdb 4.0)
Entrez IDSymbolCategoryInteraction TypesDrug Claim NameDrug NamePMIDs
Page: 1