
|
|||||
|
 | |
| |
| |
| |
| |
| |
|
Gene: RFNG |
Gene summary for RFNG |
| Gene information | Species | Human | Gene symbol | RFNG | Gene ID | 5986 |
| Gene name | RFNG O-fucosylpeptide 3-beta-N-acetylglucosaminyltransferase | |
| Gene Alias | RFNG | |
| Cytomap | 17q25.3 | |
| Gene Type | protein-coding | GO ID | GO:0007154 | UniProtAcc | Q8N9R1 |
Top |
Malignant transformation analysis |
| Identification of the aberrant gene expression in precancerous and cancerous lesions by comparing the gene expression of stem-like cells in diseased tissues with normal stem cells |
| Entrez ID | Symbol | Replicates | Species | Organ | Tissue | Adj P-value | Log2FC | Malignancy |
| 5986 | RFNG | HCC1_Meng | Human | Liver | HCC | 2.59e-44 | 1.82e-01 | 0.0246 |
| 5986 | RFNG | HCC2_Meng | Human | Liver | HCC | 1.80e-13 | 7.74e-02 | 0.0107 |
| 5986 | RFNG | HCC1 | Human | Liver | HCC | 2.73e-09 | 3.03e+00 | 0.5336 |
| 5986 | RFNG | HCC2 | Human | Liver | HCC | 3.30e-26 | 3.57e+00 | 0.5341 |
| 5986 | RFNG | Pt14.a | Human | Liver | HCC | 1.28e-02 | 3.12e-01 | 0.0169 |
| 5986 | RFNG | S014 | Human | Liver | HCC | 1.99e-11 | 4.46e-01 | 0.2254 |
| 5986 | RFNG | S015 | Human | Liver | HCC | 7.49e-14 | 5.27e-01 | 0.2375 |
| 5986 | RFNG | S016 | Human | Liver | HCC | 7.22e-13 | 4.49e-01 | 0.2243 |
| 5986 | RFNG | S027 | Human | Liver | HCC | 4.68e-03 | 3.47e-01 | 0.2446 |
| 5986 | RFNG | S028 | Human | Liver | HCC | 1.86e-10 | 4.07e-01 | 0.2503 |
| 5986 | RFNG | S029 | Human | Liver | HCC | 1.59e-06 | 3.30e-01 | 0.2581 |
| 5986 | RFNG | C04 | Human | Oral cavity | OSCC | 2.52e-03 | 3.47e-01 | 0.2633 |
| 5986 | RFNG | C21 | Human | Oral cavity | OSCC | 3.48e-15 | 7.35e-01 | 0.2678 |
| 5986 | RFNG | C30 | Human | Oral cavity | OSCC | 4.14e-18 | 8.72e-01 | 0.3055 |
| 5986 | RFNG | C43 | Human | Oral cavity | OSCC | 3.92e-09 | 2.21e-01 | 0.1704 |
| 5986 | RFNG | C51 | Human | Oral cavity | OSCC | 2.38e-13 | 4.94e-01 | 0.2674 |
| 5986 | RFNG | C06 | Human | Oral cavity | OSCC | 2.28e-02 | 5.08e-01 | 0.2699 |
| 5986 | RFNG | C08 | Human | Oral cavity | OSCC | 1.92e-06 | 1.90e-01 | 0.1919 |
| 5986 | RFNG | C09 | Human | Oral cavity | OSCC | 1.08e-03 | 1.21e-01 | 0.1431 |
| 5986 | RFNG | SYSMH1 | Human | Oral cavity | OSCC | 2.10e-12 | 3.54e-01 | 0.1127 |
| Page: 1 2 |
| Tissue | Expression Dynamics | Abbreviation |
| Liver |  | HCC: Hepatocellular carcinoma |
| NAFLD: Non-alcoholic fatty liver disease | ||
| Oral Cavity | 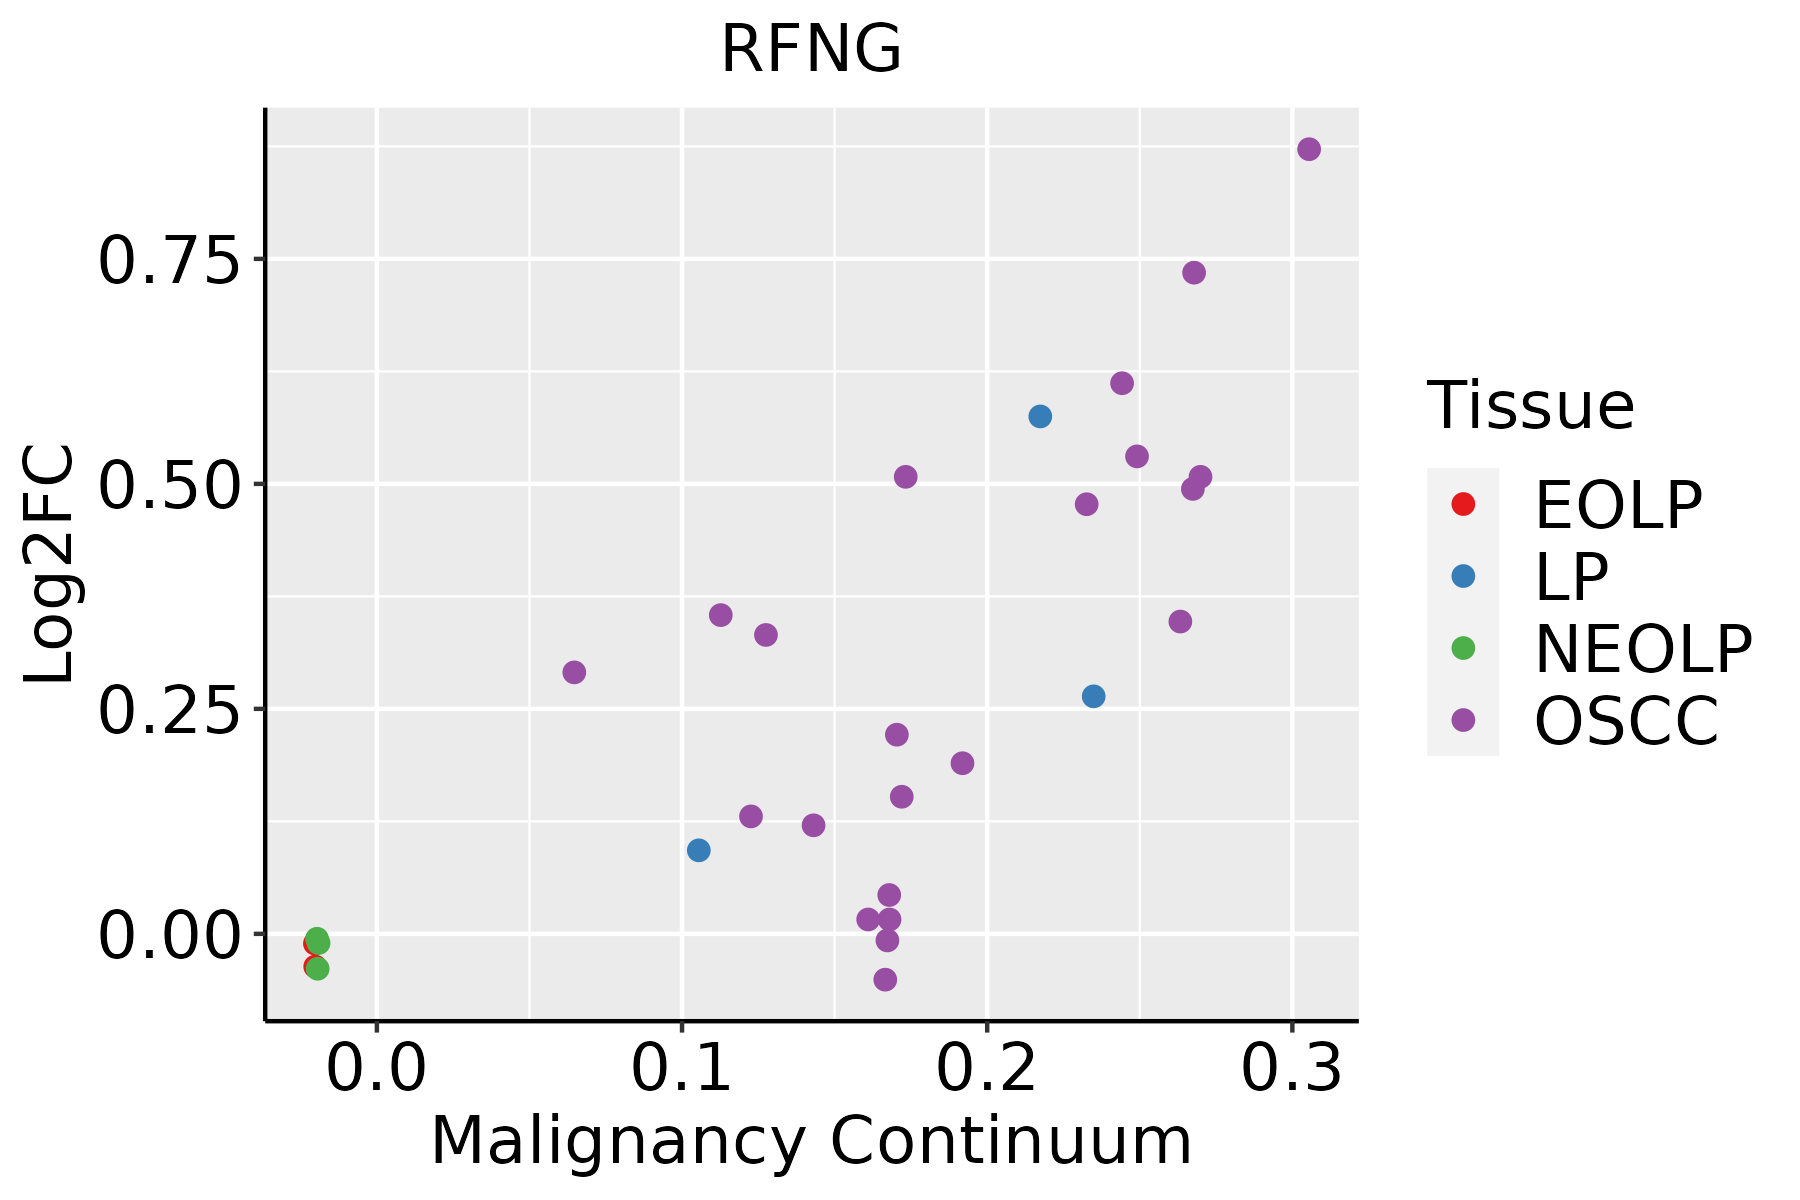 | EOLP: Erosive Oral lichen planus |
| LP: leukoplakia | ||
| NEOLP: Non-erosive oral lichen planus | ||
| OSCC: Oral squamous cell carcinoma | ||
| Thyroid |  | ATC: Anaplastic thyroid cancer |
| HT: Hashimoto's thyroiditis | ||
| PTC: Papillary thyroid cancer |
| ∗log2FC in expression of this searched gene in stem-like cells from each diseased tissue sample relative to stem-like cells in normal samples in each tissue plotted against the malignancy continuum. Samples are colored based on if they are from different disease stage. |
Top |
Malignant transformation related pathway analysis |
| Find out the enriched GO biological processes and KEGG pathways involved in transition from healthy to precancer to cancer |
| Tissue | Disease Stage | Enriched GO biological Processes |
| Colorectum | AD |  |
| Colorectum | SER |  |
| Colorectum | MSS |  |
| Colorectum | MSI-H |  |
| Colorectum | FAP |  |
| ∗Top 15 enriched GO BP terms are showed in the bar plot of each disease state in each tissue. Each row represents a significant GO biological process which is colored according to the -log10(p.adjust). |
| Page: 1 2 3 4 5 6 7 8 9 |
| GO ID | Tissue | Disease Stage | Description | Gene Ratio | Bg Ratio | pvalue | p.adjust | Count |
| GO:005109822 | Liver | HCC | regulation of binding | 225/7958 | 363/18723 | 3.78e-14 | 2.37e-12 | 225 |
| GO:004339322 | Liver | HCC | regulation of protein binding | 129/7958 | 196/18723 | 3.27e-11 | 1.26e-09 | 129 |
| GO:005109922 | Liver | HCC | positive regulation of binding | 108/7958 | 173/18723 | 9.22e-08 | 1.83e-06 | 108 |
| GO:003209221 | Liver | HCC | positive regulation of protein binding | 59/7958 | 85/18723 | 4.66e-07 | 7.61e-06 | 59 |
| GO:005109820 | Oral cavity | OSCC | regulation of binding | 212/7305 | 363/18723 | 3.88e-14 | 2.15e-12 | 212 |
| GO:004339318 | Oral cavity | OSCC | regulation of protein binding | 121/7305 | 196/18723 | 8.92e-11 | 2.73e-09 | 121 |
| GO:005109920 | Oral cavity | OSCC | positive regulation of binding | 105/7305 | 173/18723 | 5.88e-09 | 1.26e-07 | 105 |
| GO:003209210 | Oral cavity | OSCC | positive regulation of protein binding | 54/7305 | 85/18723 | 4.05e-06 | 4.71e-05 | 54 |
| GO:00072196 | Oral cavity | OSCC | Notch signaling pathway | 92/7305 | 172/18723 | 7.84e-05 | 6.08e-04 | 92 |
| GO:00085934 | Oral cavity | OSCC | regulation of Notch signaling pathway | 53/7305 | 95/18723 | 6.64e-04 | 3.72e-03 | 53 |
| GO:0051098113 | Thyroid | PTC | regulation of binding | 195/5968 | 363/18723 | 3.21e-18 | 3.37e-16 | 195 |
| GO:0051099113 | Thyroid | PTC | positive regulation of binding | 100/5968 | 173/18723 | 1.56e-12 | 6.96e-11 | 100 |
| GO:0043393111 | Thyroid | PTC | regulation of protein binding | 103/5968 | 196/18723 | 1.39e-09 | 3.96e-08 | 103 |
| GO:0032092110 | Thyroid | PTC | positive regulation of protein binding | 51/5968 | 85/18723 | 8.36e-08 | 1.70e-06 | 51 |
| GO:00072199 | Thyroid | PTC | Notch signaling pathway | 70/5968 | 172/18723 | 8.82e-03 | 3.67e-02 | 70 |
| GO:005109834 | Thyroid | ATC | regulation of binding | 203/6293 | 363/18723 | 1.18e-18 | 1.55e-16 | 203 |
| GO:005109934 | Thyroid | ATC | positive regulation of binding | 103/6293 | 173/18723 | 2.19e-12 | 9.05e-11 | 103 |
| GO:004339327 | Thyroid | ATC | regulation of protein binding | 110/6293 | 196/18723 | 6.99e-11 | 2.22e-09 | 110 |
| GO:003209224 | Thyroid | ATC | positive regulation of protein binding | 53/6293 | 85/18723 | 5.37e-08 | 9.67e-07 | 53 |
| GO:000721915 | Thyroid | ATC | Notch signaling pathway | 79/6293 | 172/18723 | 5.08e-04 | 2.96e-03 | 79 |
| Page: 1 2 |
| Pathway ID | Tissue | Disease Stage | Description | Gene Ratio | Bg Ratio | pvalue | p.adjust | qvalue | Count |
| hsa051652 | Liver | HCC | Human papillomavirus infection | 188/4020 | 331/8465 | 3.34e-04 | 1.49e-03 | 8.29e-04 | 188 |
| hsa051653 | Liver | HCC | Human papillomavirus infection | 188/4020 | 331/8465 | 3.34e-04 | 1.49e-03 | 8.29e-04 | 188 |
| hsa051659 | Oral cavity | OSCC | Human papillomavirus infection | 200/3704 | 331/8465 | 3.83e-10 | 4.93e-09 | 2.51e-09 | 200 |
| hsa043305 | Oral cavity | OSCC | Notch signaling pathway | 44/3704 | 62/8465 | 1.26e-05 | 5.55e-05 | 2.83e-05 | 44 |
| hsa0516514 | Oral cavity | OSCC | Human papillomavirus infection | 200/3704 | 331/8465 | 3.83e-10 | 4.93e-09 | 2.51e-09 | 200 |
| hsa0433012 | Oral cavity | OSCC | Notch signaling pathway | 44/3704 | 62/8465 | 1.26e-05 | 5.55e-05 | 2.83e-05 | 44 |
| Page: 1 |
Top |
Cell-cell communication analysis |
| Identification of potential cell-cell interactions between two cell types and their ligand-receptor pairs for different disease states |
| Ligand | Receptor | LRpair | Pathway | Tissue | Disease Stage |
| Page: 1 |
Top |
Single-cell gene regulatory network inference analysis |
| Find out the significant the regulons (TFs) and the target genes of each regulon across cell types for different disease states |
| TF | Cell Type | Tissue | Disease Stage | Target Gene | RSS | Regulon Activity |
| ∗The dot plots of a searched regulon are shown for all cell subpopulations in each disease state of each tissue based on the regulon specific score inferred using pySCENIC and by calculating the average expression. |
| Page: 1 |
Top |
Somatic mutation of malignant transformation related genes |
| Annotation of somatic variants for genes involved in malignant transformation |
| Hugo Symbol | Variant Class | Variant Classification | dbSNP RS | HGVSc | HGVSp | HGVSp Short | SWISSPROT | BIOTYPE | SIFT | PolyPhen | Tumor Sample Barcode | Tissue | Histology | Sex | Age | Stage | Therapy Types | Drugs | Outcome |
| RFNG | SNV | Missense_Mutation | novel | c.709N>A | p.Asp237Asn | p.D237N | Q9Y644 | protein_coding | deleterious(0) | probably_damaging(0.999) | TCGA-BH-A0BZ-01 | Breast | breast invasive carcinoma | Female | <65 | III/IV | Chemotherapy | doxorubicin | CR |
| RFNG | SNV | Missense_Mutation | c.325N>A | p.Val109Ile | p.V109I | Q9Y644 | protein_coding | tolerated(0.17) | benign(0.027) | TCGA-BH-A1FC-01 | Breast | breast invasive carcinoma | Female | >=65 | I/II | Unknown | Unknown | SD | |
| RFNG | SNV | Missense_Mutation | c.394N>A | p.Asp132Asn | p.D132N | Q9Y644 | protein_coding | deleterious(0.03) | probably_damaging(0.999) | TCGA-EK-A2RK-01 | Cervix | cervical & endocervical cancer | Female | >=65 | I/II | Unknown | Unknown | SD | |
| RFNG | SNV | Missense_Mutation | rs757464403 | c.667G>A | p.Gly223Ser | p.G223S | Q9Y644 | protein_coding | tolerated(0.25) | probably_damaging(1) | TCGA-D5-6931-01 | Colorectum | colon adenocarcinoma | Male | >=65 | III/IV | Unknown | Unknown | SD |
| RFNG | SNV | Missense_Mutation | novel | c.561N>T | p.Gln187His | p.Q187H | Q9Y644 | protein_coding | tolerated(0.13) | possibly_damaging(0.898) | TCGA-D1-A167-01 | Endometrium | uterine corpus endometrioid carcinoma | Female | >=65 | I/II | Unknown | Unknown | SD |
| RFNG | SNV | Missense_Mutation | novel | c.769C>A | p.Leu257Ile | p.L257I | Q9Y644 | protein_coding | deleterious(0) | probably_damaging(0.999) | TCGA-D1-A1NZ-01 | Endometrium | uterine corpus endometrioid carcinoma | Female | <65 | I/II | Unknown | Unknown | SD |
| RFNG | SNV | Missense_Mutation | rs772335800 | c.766N>T | p.Pro256Ser | p.P256S | Q9Y644 | protein_coding | tolerated(0.37) | benign(0.018) | TCGA-86-8281-01 | Lung | lung adenocarcinoma | Male | >=65 | I/II | Unknown | Unknown | SD |
| RFNG | SNV | Missense_Mutation | novel | c.276C>G | p.Ile92Met | p.I92M | Q9Y644 | protein_coding | deleterious(0.02) | probably_damaging(0.941) | TCGA-98-8021-01 | Lung | lung squamous cell carcinoma | Female | >=65 | I/II | Unknown | Unknown | PD |
| RFNG | SNV | Missense_Mutation | rs755250241 | c.934C>T | p.Leu312Phe | p.L312F | Q9Y644 | protein_coding | tolerated(0.13) | probably_damaging(0.933) | TCGA-BA-5556-01 | Oral cavity | head & neck squamous cell carcinoma | Female | <65 | I/II | Unknown | Unknown | SD |
| RFNG | SNV | Missense_Mutation | rs765977318 | c.730N>A | p.Val244Met | p.V244M | Q9Y644 | protein_coding | deleterious(0) | probably_damaging(0.936) | TCGA-CN-6023-01 | Oral cavity | head & neck squamous cell carcinoma | Male | >=65 | I/II | Chemotherapy | erbitux | SD |
| Page: 1 2 |
Top |
Related drugs of malignant transformation related genes |
| Identification of chemicals and drugs interact with genes involved in malignant transfromation |
| (DGIdb 4.0) |
| Entrez ID | Symbol | Category | Interaction Types | Drug Claim Name | Drug Name | PMIDs |
| Page: 1 |

Copyright 2023-Present -The University of Texas Health Science Center at Houston |