
|
|||||
|
 | |
| |
| |
| |
| |
| |
|
Gene: RFK |
Gene summary for RFK |
| Gene information | Species | Human | Gene symbol | RFK | Gene ID | 55312 |
| Gene name | riboflavin kinase | |
| Gene Alias | RIFK | |
| Cytomap | 9q21.13 | |
| Gene Type | protein-coding | GO ID | GO:0006139 | UniProtAcc | B2RDZ2 |
Top |
Malignant transformation analysis |
| Identification of the aberrant gene expression in precancerous and cancerous lesions by comparing the gene expression of stem-like cells in diseased tissues with normal stem cells |
| Entrez ID | Symbol | Replicates | Species | Organ | Tissue | Adj P-value | Log2FC | Malignancy |
| 55312 | RFK | HTA11_78_2000001011 | Human | Colorectum | AD | 4.00e-03 | 2.79e-01 | -0.1088 |
| 55312 | RFK | HTA11_347_2000001011 | Human | Colorectum | AD | 1.55e-07 | 1.89e-01 | -0.1954 |
| 55312 | RFK | HTA11_866_3004761011 | Human | Colorectum | AD | 5.84e-03 | 1.35e-01 | 0.096 |
| 55312 | RFK | HTA11_6801_2000001011 | Human | Colorectum | SER | 5.64e-04 | 3.83e-01 | 0.0171 |
| 55312 | RFK | HTA11_99999970781_79442 | Human | Colorectum | MSS | 2.97e-12 | 3.95e-01 | 0.294 |
| 55312 | RFK | HTA11_99999965062_69753 | Human | Colorectum | MSI-H | 2.78e-03 | 8.28e-01 | 0.3487 |
| 55312 | RFK | HTA11_99999965104_69814 | Human | Colorectum | MSS | 2.16e-04 | 2.18e-01 | 0.281 |
| 55312 | RFK | HTA11_99999971662_82457 | Human | Colorectum | MSS | 3.23e-05 | 3.34e-01 | 0.3859 |
| 55312 | RFK | LZE4T | Human | Esophagus | ESCC | 5.92e-03 | 2.94e-01 | 0.0811 |
| 55312 | RFK | LZE5T | Human | Esophagus | ESCC | 4.61e-02 | 2.40e-01 | 0.0514 |
| 55312 | RFK | LZE24T | Human | Esophagus | ESCC | 1.01e-07 | 2.16e-01 | 0.0596 |
| 55312 | RFK | LZE21T | Human | Esophagus | ESCC | 9.43e-03 | 2.49e-01 | 0.0655 |
| 55312 | RFK | P2T-E | Human | Esophagus | ESCC | 6.12e-29 | 4.78e-01 | 0.1177 |
| 55312 | RFK | P4T-E | Human | Esophagus | ESCC | 1.32e-13 | 3.03e-01 | 0.1323 |
| 55312 | RFK | P5T-E | Human | Esophagus | ESCC | 7.72e-15 | 2.36e-01 | 0.1327 |
| 55312 | RFK | P8T-E | Human | Esophagus | ESCC | 6.39e-16 | 3.69e-01 | 0.0889 |
| 55312 | RFK | P9T-E | Human | Esophagus | ESCC | 4.57e-04 | 1.64e-01 | 0.1131 |
| 55312 | RFK | P10T-E | Human | Esophagus | ESCC | 4.35e-12 | 2.49e-01 | 0.116 |
| 55312 | RFK | P11T-E | Human | Esophagus | ESCC | 9.22e-13 | 5.35e-01 | 0.1426 |
| 55312 | RFK | P12T-E | Human | Esophagus | ESCC | 6.93e-13 | 2.59e-01 | 0.1122 |
| Page: 1 2 3 4 5 6 |
| Tissue | Expression Dynamics | Abbreviation |
| Colorectum (GSE201348) |  | FAP: Familial adenomatous polyposis |
| CRC: Colorectal cancer | ||
| Colorectum (HTA11) |  | AD: Adenomas |
| SER: Sessile serrated lesions | ||
| MSI-H: Microsatellite-high colorectal cancer | ||
| MSS: Microsatellite stable colorectal cancer | ||
| Esophagus | 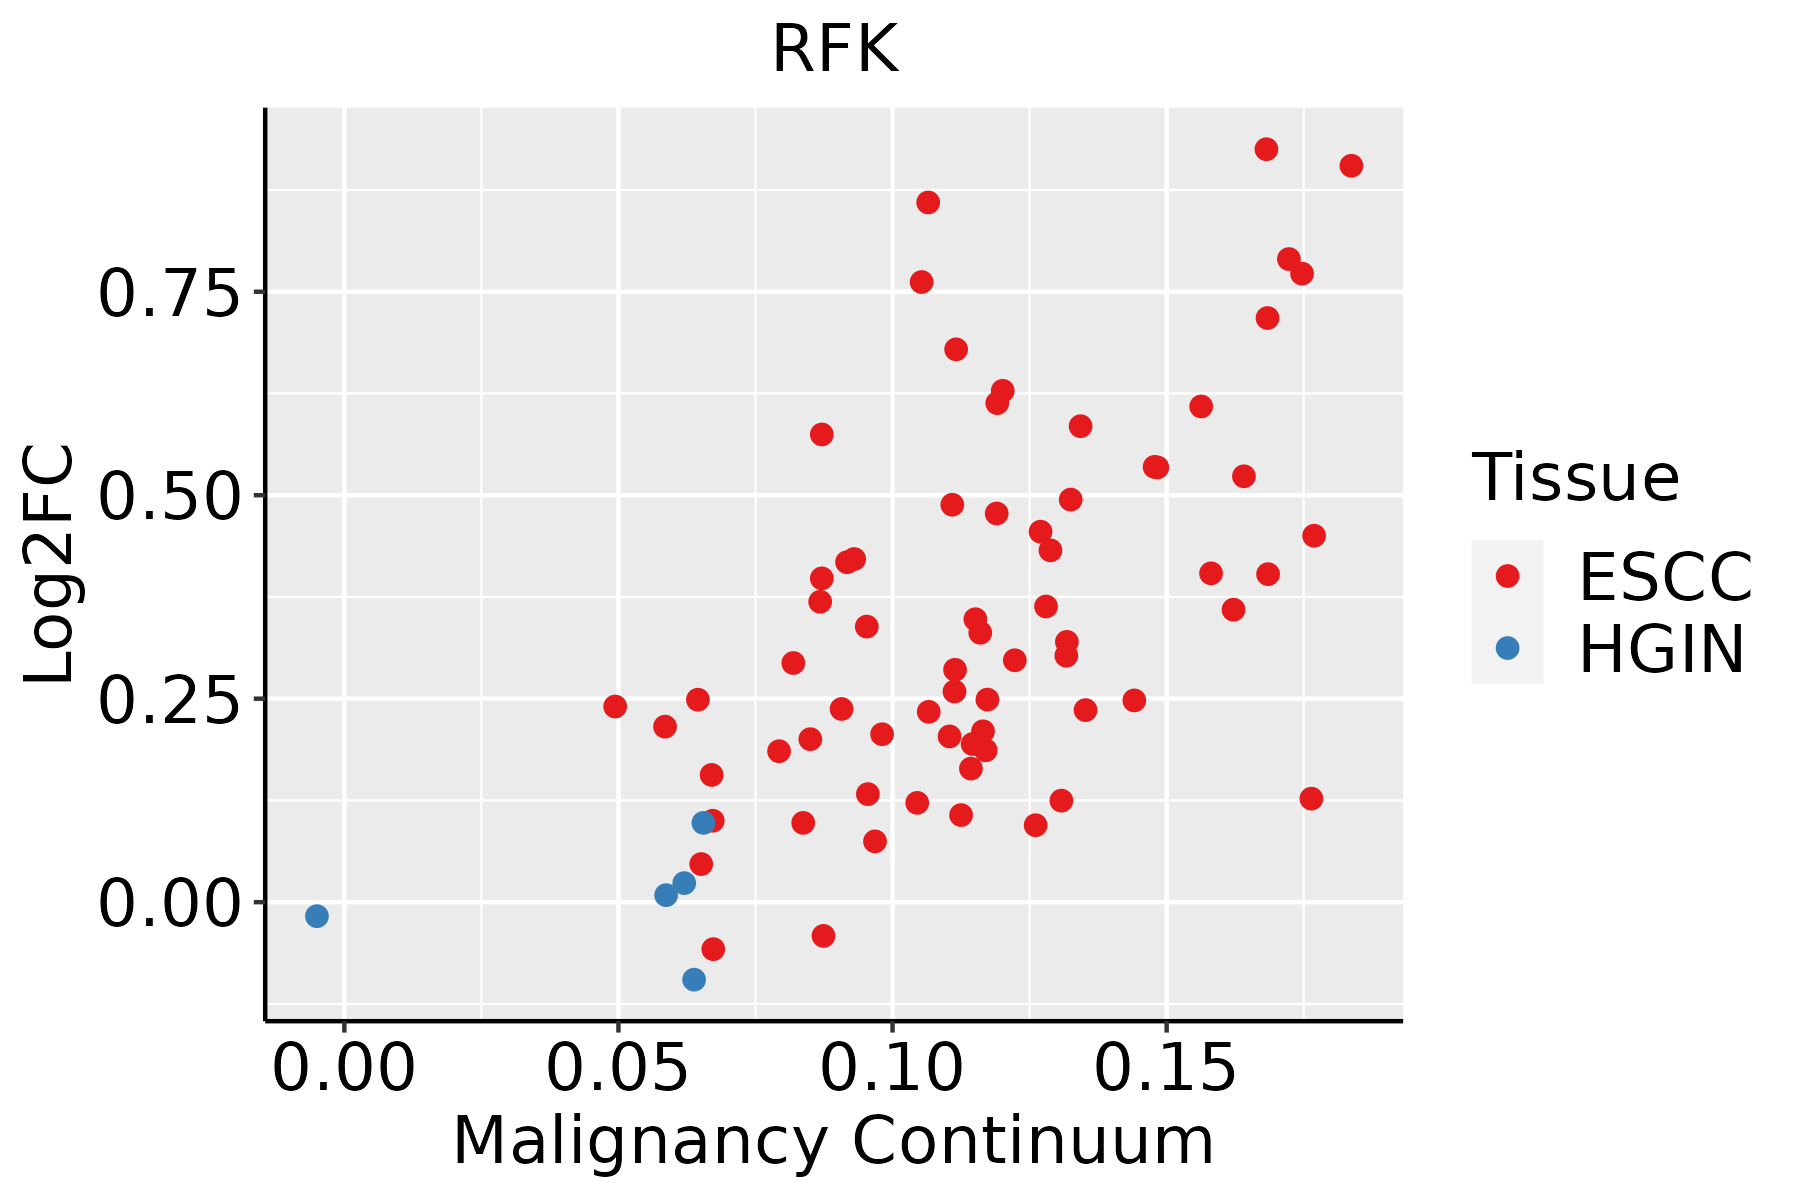 | ESCC: Esophageal squamous cell carcinoma |
| HGIN: High-grade intraepithelial neoplasias | ||
| LGIN: Low-grade intraepithelial neoplasias | ||
| Liver |  | HCC: Hepatocellular carcinoma |
| NAFLD: Non-alcoholic fatty liver disease | ||
| Oral Cavity |  | EOLP: Erosive Oral lichen planus |
| LP: leukoplakia | ||
| NEOLP: Non-erosive oral lichen planus | ||
| OSCC: Oral squamous cell carcinoma | ||
| Thyroid | 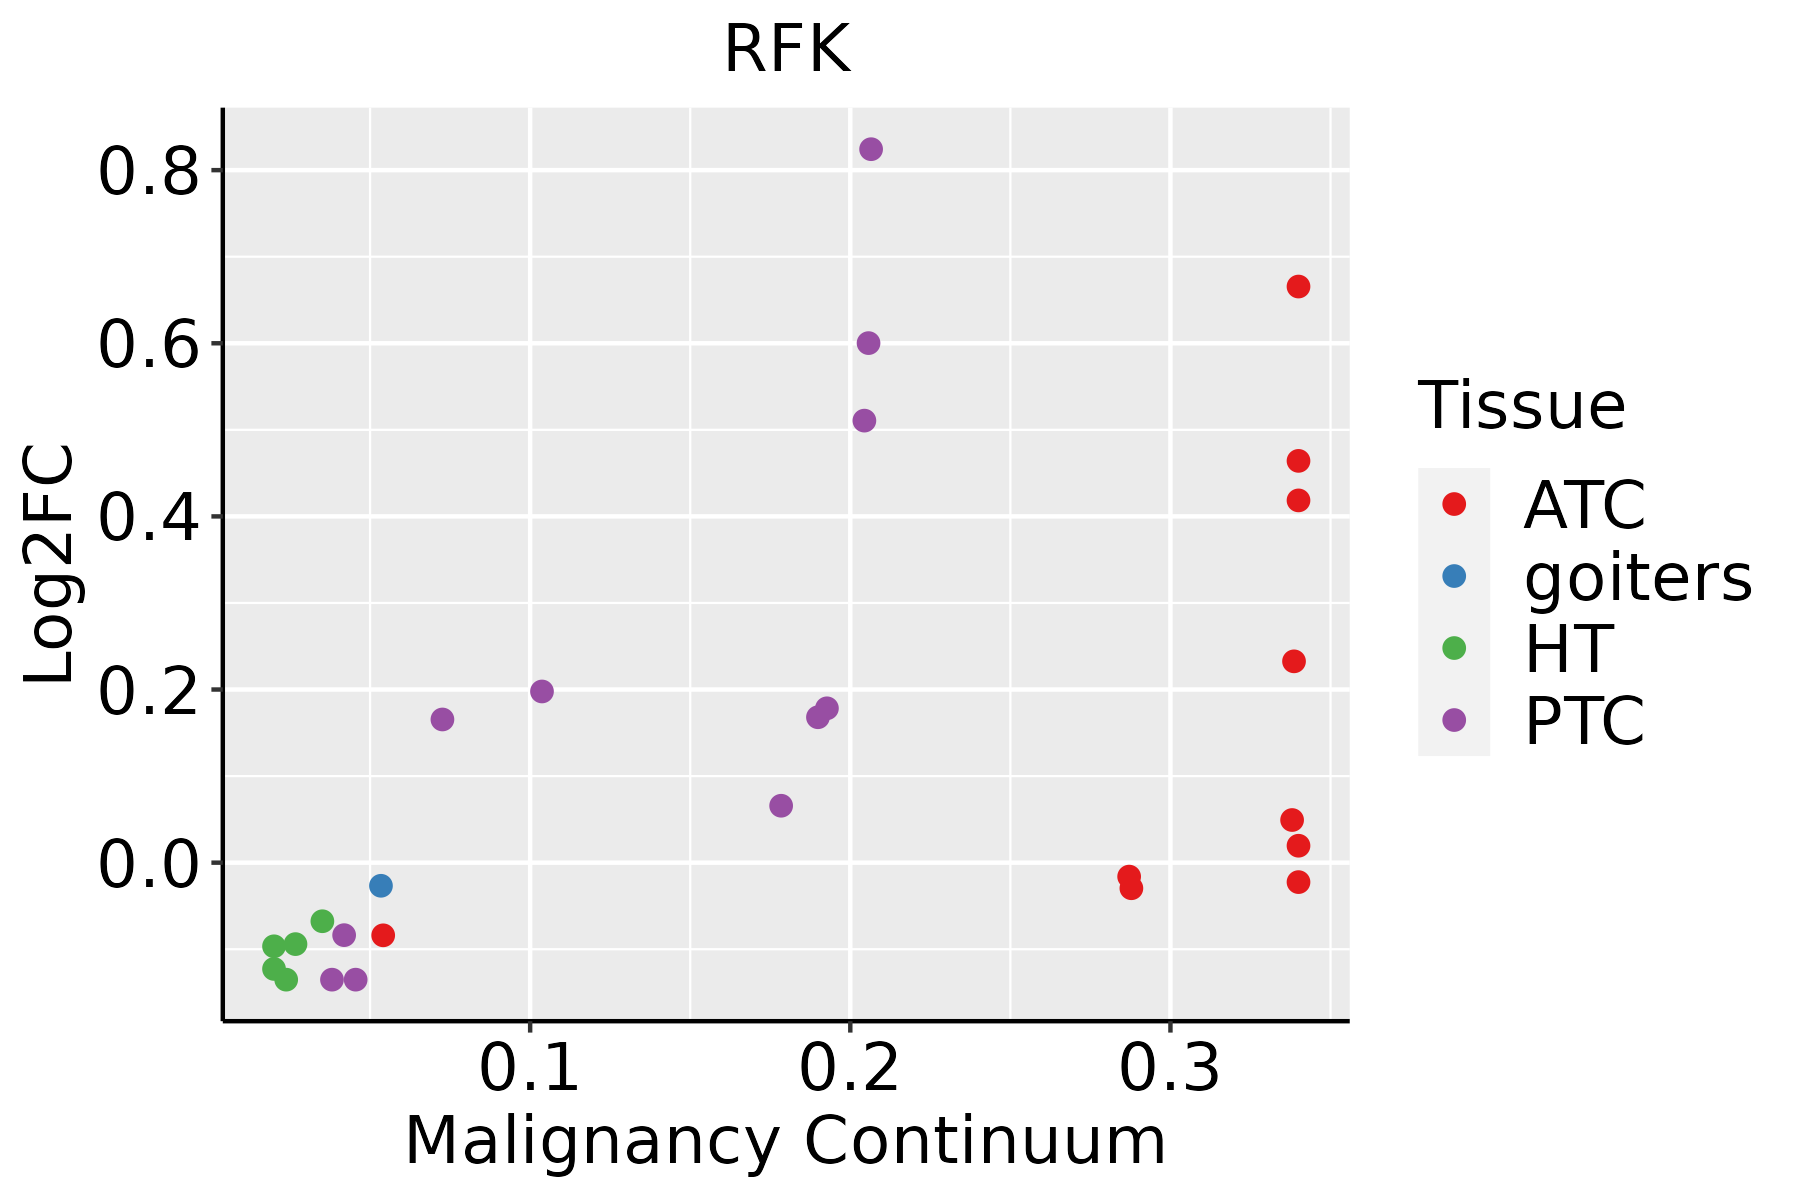 | ATC: Anaplastic thyroid cancer |
| HT: Hashimoto's thyroiditis | ||
| PTC: Papillary thyroid cancer |
| ∗log2FC in expression of this searched gene in stem-like cells from each diseased tissue sample relative to stem-like cells in normal samples in each tissue plotted against the malignancy continuum. Samples are colored based on if they are from different disease stage. |
Top |
Malignant transformation related pathway analysis |
| Find out the enriched GO biological processes and KEGG pathways involved in transition from healthy to precancer to cancer |
| Tissue | Disease Stage | Enriched GO biological Processes |
| Colorectum | AD |  |
| Colorectum | SER |  |
| Colorectum | MSS |  |
| Colorectum | MSI-H |  |
| Colorectum | FAP |  |
| ∗Top 15 enriched GO BP terms are showed in the bar plot of each disease state in each tissue. Each row represents a significant GO biological process which is colored according to the -log10(p.adjust). |
| Page: 1 2 3 4 5 6 7 8 9 |
| GO ID | Tissue | Disease Stage | Description | Gene Ratio | Bg Ratio | pvalue | p.adjust | Count |
| GO:0009259 | Colorectum | AD | ribonucleotide metabolic process | 144/3918 | 385/18723 | 5.25e-14 | 1.13e-11 | 144 |
| GO:0019693 | Colorectum | AD | ribose phosphate metabolic process | 145/3918 | 396/18723 | 3.01e-13 | 5.71e-11 | 145 |
| GO:0009117 | Colorectum | AD | nucleotide metabolic process | 168/3918 | 489/18723 | 2.20e-12 | 3.36e-10 | 168 |
| GO:0006753 | Colorectum | AD | nucleoside phosphate metabolic process | 169/3918 | 497/18723 | 4.99e-12 | 6.98e-10 | 169 |
| GO:0009260 | Colorectum | AD | ribonucleotide biosynthetic process | 66/3918 | 182/18723 | 1.25e-06 | 4.02e-05 | 66 |
| GO:0046390 | Colorectum | AD | ribose phosphate biosynthetic process | 67/3918 | 190/18723 | 3.21e-06 | 9.05e-05 | 67 |
| GO:1901293 | Colorectum | AD | nucleoside phosphate biosynthetic process | 80/3918 | 256/18723 | 6.31e-05 | 1.05e-03 | 80 |
| GO:0009165 | Colorectum | AD | nucleotide biosynthetic process | 79/3918 | 254/18723 | 8.33e-05 | 1.30e-03 | 79 |
| GO:0072593 | Colorectum | AD | reactive oxygen species metabolic process | 73/3918 | 239/18723 | 2.79e-04 | 3.42e-03 | 73 |
| GO:0051353 | Colorectum | AD | positive regulation of oxidoreductase activity | 21/3918 | 59/18723 | 6.58e-03 | 4.08e-02 | 21 |
| GO:00092591 | Colorectum | SER | ribonucleotide metabolic process | 104/2897 | 385/18723 | 3.27e-09 | 3.04e-07 | 104 |
| GO:00196931 | Colorectum | SER | ribose phosphate metabolic process | 105/2897 | 396/18723 | 8.15e-09 | 7.14e-07 | 105 |
| GO:00091171 | Colorectum | SER | nucleotide metabolic process | 122/2897 | 489/18723 | 2.50e-08 | 1.76e-06 | 122 |
| GO:00067531 | Colorectum | SER | nucleoside phosphate metabolic process | 122/2897 | 497/18723 | 6.64e-08 | 4.33e-06 | 122 |
| GO:00725931 | Colorectum | SER | reactive oxygen species metabolic process | 61/2897 | 239/18723 | 3.63e-05 | 9.39e-04 | 61 |
| GO:00092601 | Colorectum | SER | ribonucleotide biosynthetic process | 49/2897 | 182/18723 | 4.85e-05 | 1.19e-03 | 49 |
| GO:00463901 | Colorectum | SER | ribose phosphate biosynthetic process | 50/2897 | 190/18723 | 7.70e-05 | 1.72e-03 | 50 |
| GO:00091651 | Colorectum | SER | nucleotide biosynthetic process | 58/2897 | 254/18723 | 1.21e-03 | 1.38e-02 | 58 |
| GO:19012931 | Colorectum | SER | nucleoside phosphate biosynthetic process | 58/2897 | 256/18723 | 1.47e-03 | 1.59e-02 | 58 |
| GO:0051341 | Colorectum | SER | regulation of oxidoreductase activity | 27/2897 | 107/18723 | 5.86e-03 | 4.29e-02 | 27 |
| Page: 1 2 3 4 5 6 |
| Pathway ID | Tissue | Disease Stage | Description | Gene Ratio | Bg Ratio | pvalue | p.adjust | qvalue | Count |
| hsa012405 | Esophagus | ESCC | Biosynthesis of cofactors | 97/4205 | 153/8465 | 3.88e-04 | 1.35e-03 | 6.94e-04 | 97 |
| hsa0124012 | Esophagus | ESCC | Biosynthesis of cofactors | 97/4205 | 153/8465 | 3.88e-04 | 1.35e-03 | 6.94e-04 | 97 |
| hsa01240 | Liver | Cirrhotic | Biosynthesis of cofactors | 66/2530 | 153/8465 | 3.11e-04 | 1.99e-03 | 1.23e-03 | 66 |
| hsa012401 | Liver | Cirrhotic | Biosynthesis of cofactors | 66/2530 | 153/8465 | 3.11e-04 | 1.99e-03 | 1.23e-03 | 66 |
| hsa012402 | Liver | HCC | Biosynthesis of cofactors | 103/4020 | 153/8465 | 4.67e-07 | 5.05e-06 | 2.81e-06 | 103 |
| hsa012403 | Liver | HCC | Biosynthesis of cofactors | 103/4020 | 153/8465 | 4.67e-07 | 5.05e-06 | 2.81e-06 | 103 |
| hsa012404 | Oral cavity | OSCC | Biosynthesis of cofactors | 88/3704 | 153/8465 | 3.84e-04 | 1.20e-03 | 6.12e-04 | 88 |
| hsa0124011 | Oral cavity | OSCC | Biosynthesis of cofactors | 88/3704 | 153/8465 | 3.84e-04 | 1.20e-03 | 6.12e-04 | 88 |
| Page: 1 |
Top |
Cell-cell communication analysis |
| Identification of potential cell-cell interactions between two cell types and their ligand-receptor pairs for different disease states |
| Ligand | Receptor | LRpair | Pathway | Tissue | Disease Stage |
| Page: 1 |
Top |
Single-cell gene regulatory network inference analysis |
| Find out the significant the regulons (TFs) and the target genes of each regulon across cell types for different disease states |
| TF | Cell Type | Tissue | Disease Stage | Target Gene | RSS | Regulon Activity |
| ∗The dot plots of a searched regulon are shown for all cell subpopulations in each disease state of each tissue based on the regulon specific score inferred using pySCENIC and by calculating the average expression. |
| Page: 1 |
Top |
Somatic mutation of malignant transformation related genes |
| Annotation of somatic variants for genes involved in malignant transformation |
| Hugo Symbol | Variant Class | Variant Classification | dbSNP RS | HGVSc | HGVSp | HGVSp Short | SWISSPROT | BIOTYPE | SIFT | PolyPhen | Tumor Sample Barcode | Tissue | Histology | Sex | Age | Stage | Therapy Types | Drugs | Outcome |
| RFK | SNV | Missense_Mutation | novel | c.299N>C | p.Val100Ala | p.V100A | Q969G6 | protein_coding | tolerated(0.12) | benign(0.099) | TCGA-AZ-4315-01 | Colorectum | colon adenocarcinoma | Male | <65 | I/II | Unknown | Unknown | SD |
| RFK | SNV | Missense_Mutation | novel | c.446N>A | p.Ser149Asn | p.S149N | Q969G6 | protein_coding | tolerated(0.48) | benign(0) | TCGA-EI-6917-01 | Colorectum | rectum adenocarcinoma | Male | <65 | III/IV | Chemotherapy | 5fluorouracil+oxaciplatina+l-folinian | SD |
| RFK | SNV | Missense_Mutation | novel | c.330N>A | p.Asp110Glu | p.D110E | Q969G6 | protein_coding | tolerated(0.33) | benign(0.003) | TCGA-AX-A06F-01 | Endometrium | uterine corpus endometrioid carcinoma | Female | <65 | III/IV | Chemotherapy | carboplatin | SD |
| RFK | SNV | Missense_Mutation | novel | c.202N>G | p.Asn68Asp | p.N68D | Q969G6 | protein_coding | deleterious(0) | probably_damaging(0.946) | TCGA-AX-A2HG-01 | Endometrium | uterine corpus endometrioid carcinoma | Female | <65 | I/II | Unknown | Unknown | SD |
| RFK | SNV | Missense_Mutation | c.321N>T | p.Lys107Asn | p.K107N | Q969G6 | protein_coding | tolerated(0.09) | possibly_damaging(0.702) | TCGA-B5-A0JY-01 | Endometrium | uterine corpus endometrioid carcinoma | Female | <65 | III/IV | Chemotherapy | doxorubicin | SD | |
| RFK | SNV | Missense_Mutation | novel | c.239N>T | p.Thr80Ile | p.T80I | Q969G6 | protein_coding | tolerated(0.23) | possibly_damaging(0.851) | TCGA-DF-A2KU-01 | Endometrium | uterine corpus endometrioid carcinoma | Female | Unknown | I/II | Unknown | Unknown | SD |
| RFK | SNV | Missense_Mutation | novel | c.410N>C | p.Lys137Thr | p.K137T | Q969G6 | protein_coding | deleterious(0.02) | possibly_damaging(0.618) | TCGA-EO-A3B0-01 | Endometrium | uterine corpus endometrioid carcinoma | Female | <65 | III/IV | Unknown | Unknown | SD |
| RFK | SNV | Missense_Mutation | novel | c.402N>C | p.Glu134Asp | p.E134D | Q969G6 | protein_coding | tolerated(0.14) | benign(0.005) | TCGA-FI-A2D5-01 | Endometrium | uterine corpus endometrioid carcinoma | Female | <65 | III/IV | Chemotherapy | carboplatinum | PD |
| RFK | SNV | Missense_Mutation | novel | c.43G>A | p.Gly15Ser | p.G15S | Q969G6 | protein_coding | deleterious(0) | probably_damaging(0.984) | TCGA-DD-AADW-01 | Liver | liver hepatocellular carcinoma | Male | <65 | I/II | Unknown | Unknown | PD |
| RFK | SNV | Missense_Mutation | c.154N>T | p.Ser52Cys | p.S52C | Q969G6 | protein_coding | tolerated(0.34) | possibly_damaging(0.446) | TCGA-L9-A7SV-01 | Lung | lung adenocarcinoma | Male | >=65 | I/II | Chemotherapy | cisplatin | CR |
| Page: 1 2 |
Top |
Related drugs of malignant transformation related genes |
| Identification of chemicals and drugs interact with genes involved in malignant transfromation |
| (DGIdb 4.0) |
| Entrez ID | Symbol | Category | Interaction Types | Drug Claim Name | Drug Name | PMIDs |
| 55312 | RFK | KINASE, ENZYME | escitalopram | ESCITALOPRAM | ||
| 55312 | RFK | KINASE, ENZYME | citalopram | CITALOPRAM |
| Page: 1 |

Copyright 2023-Present -The University of Texas Health Science Center at Houston |