
|
|||||
|
 | |
| |
| |
| |
| |
| |
|
Gene: RFFL |
Gene summary for RFFL |
| Gene information | Species | Human | Gene symbol | RFFL | Gene ID | 117584 |
| Gene name | ring finger and FYVE like domain containing E3 ubiquitin protein ligase | |
| Gene Alias | CARP-2 | |
| Cytomap | 17q12 | |
| Gene Type | protein-coding | GO ID | GO:0000209 | UniProtAcc | Q8WZ73 |
Top |
Malignant transformation analysis |
| Identification of the aberrant gene expression in precancerous and cancerous lesions by comparing the gene expression of stem-like cells in diseased tissues with normal stem cells |
| Entrez ID | Symbol | Replicates | Species | Organ | Tissue | Adj P-value | Log2FC | Malignancy |
| 117584 | RFFL | HCC1_Meng | Human | Liver | HCC | 1.41e-63 | 9.70e-02 | 0.0246 |
| 117584 | RFFL | HCC2_Meng | Human | Liver | HCC | 9.55e-10 | 6.42e-02 | 0.0107 |
| 117584 | RFFL | Pt14.a | Human | Liver | HCC | 3.19e-02 | 2.09e-01 | 0.0169 |
| 117584 | RFFL | S014 | Human | Liver | HCC | 2.03e-12 | 4.13e-01 | 0.2254 |
| 117584 | RFFL | S015 | Human | Liver | HCC | 1.45e-12 | 3.76e-01 | 0.2375 |
| 117584 | RFFL | S016 | Human | Liver | HCC | 1.75e-07 | 2.45e-01 | 0.2243 |
| 117584 | RFFL | S027 | Human | Liver | HCC | 3.78e-04 | 4.26e-01 | 0.2446 |
| 117584 | RFFL | S028 | Human | Liver | HCC | 1.76e-16 | 6.45e-01 | 0.2503 |
| 117584 | RFFL | S029 | Human | Liver | HCC | 2.27e-18 | 7.22e-01 | 0.2581 |
| 117584 | RFFL | male-WTA | Human | Thyroid | PTC | 4.19e-21 | 2.25e-01 | 0.1037 |
| 117584 | RFFL | PTC01 | Human | Thyroid | PTC | 2.62e-05 | 7.97e-02 | 0.1899 |
| 117584 | RFFL | PTC04 | Human | Thyroid | PTC | 4.00e-06 | 2.37e-01 | 0.1927 |
| 117584 | RFFL | PTC05 | Human | Thyroid | PTC | 5.19e-04 | 2.51e-01 | 0.2065 |
| 117584 | RFFL | PTC06 | Human | Thyroid | PTC | 5.15e-29 | 6.54e-01 | 0.2057 |
| 117584 | RFFL | PTC07 | Human | Thyroid | PTC | 7.91e-16 | 2.91e-01 | 0.2044 |
| 117584 | RFFL | ATC12 | Human | Thyroid | ATC | 7.93e-03 | -4.03e-02 | 0.34 |
| 117584 | RFFL | ATC13 | Human | Thyroid | ATC | 5.38e-17 | 1.79e-01 | 0.34 |
| 117584 | RFFL | ATC4 | Human | Thyroid | ATC | 5.63e-05 | -1.51e-02 | 0.34 |
| 117584 | RFFL | ATC5 | Human | Thyroid | ATC | 3.25e-08 | 1.96e-01 | 0.34 |
| Page: 1 |
| Tissue | Expression Dynamics | Abbreviation |
| Liver | 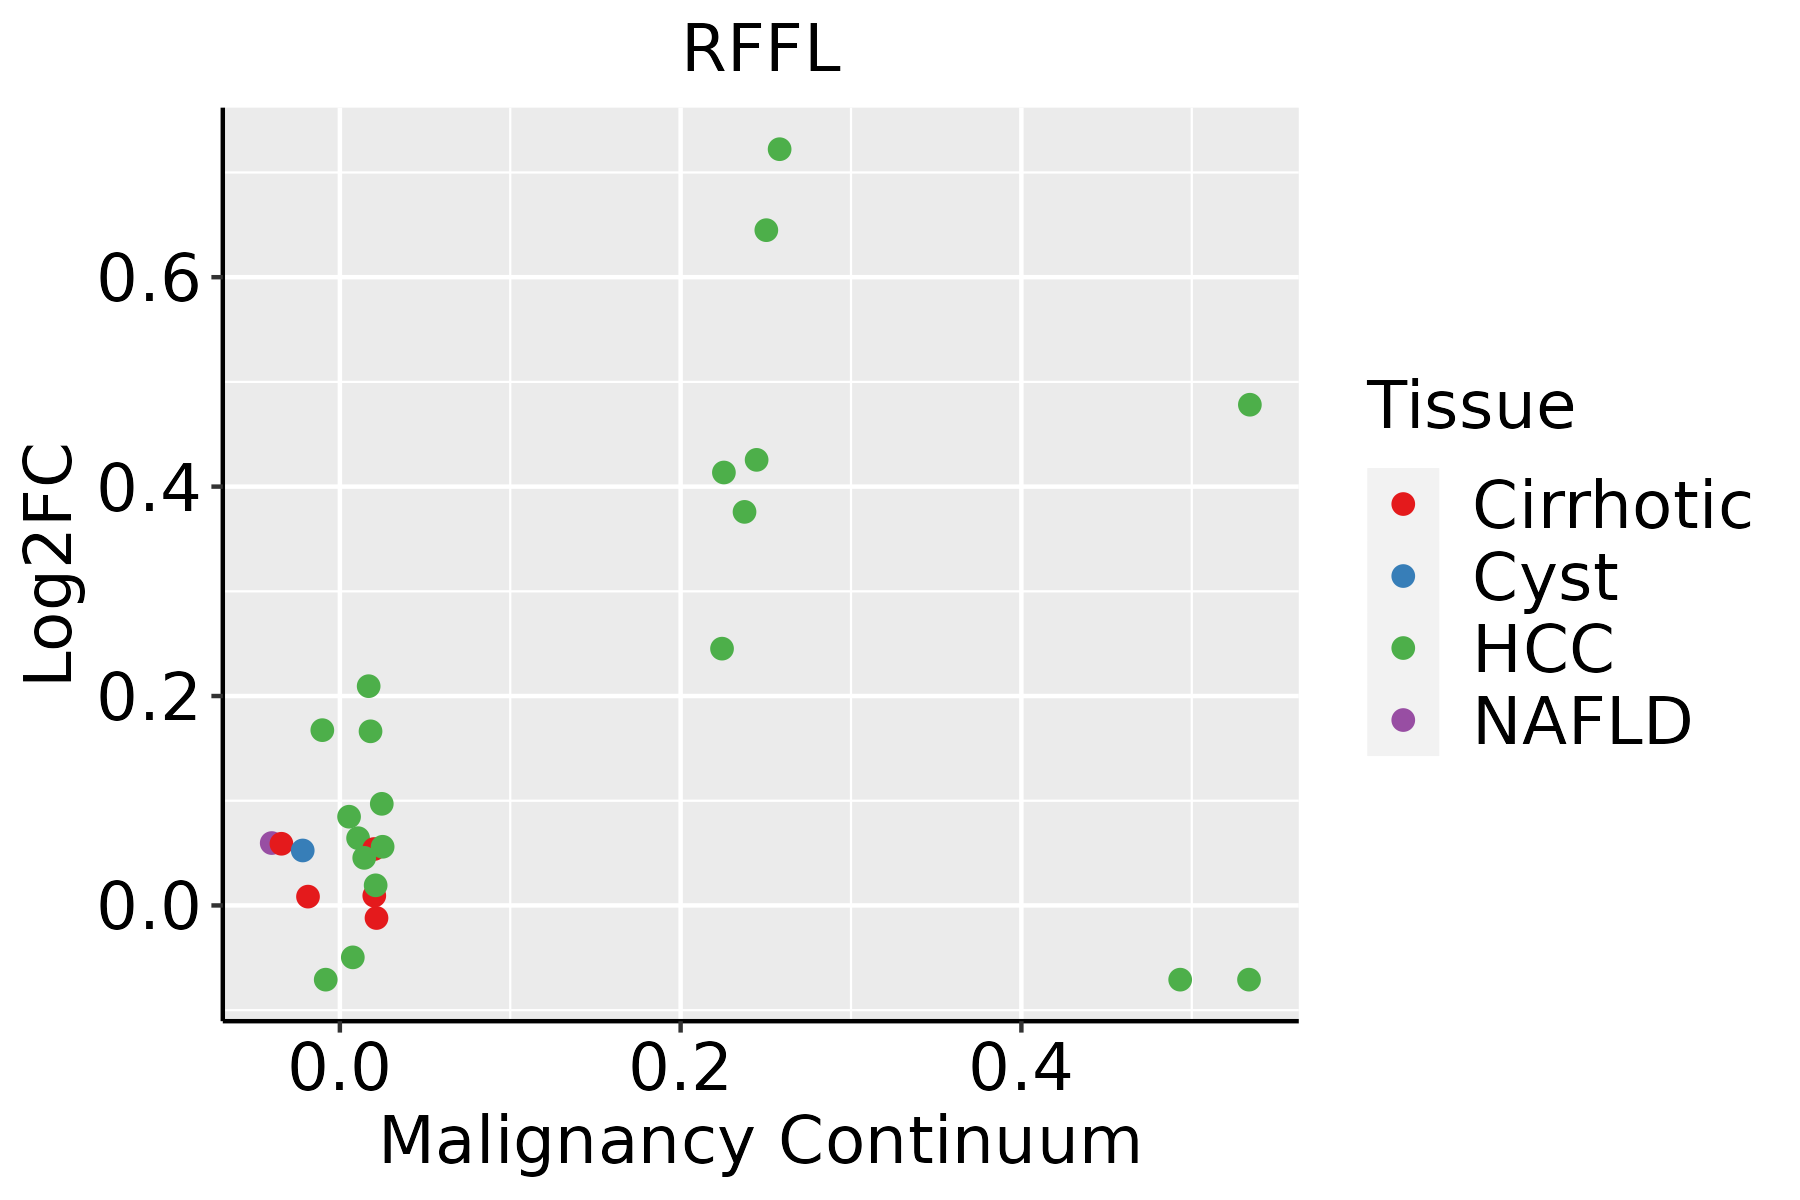 | HCC: Hepatocellular carcinoma |
| NAFLD: Non-alcoholic fatty liver disease | ||
| Thyroid |  | ATC: Anaplastic thyroid cancer |
| HT: Hashimoto's thyroiditis | ||
| PTC: Papillary thyroid cancer |
| ∗log2FC in expression of this searched gene in stem-like cells from each diseased tissue sample relative to stem-like cells in normal samples in each tissue plotted against the malignancy continuum. Samples are colored based on if they are from different disease stage. |
Top |
Malignant transformation related pathway analysis |
| Find out the enriched GO biological processes and KEGG pathways involved in transition from healthy to precancer to cancer |
| Tissue | Disease Stage | Enriched GO biological Processes |
| Colorectum | AD |  |
| Colorectum | SER |  |
| Colorectum | MSS |  |
| Colorectum | MSI-H |  |
| Colorectum | FAP |  |
| ∗Top 15 enriched GO BP terms are showed in the bar plot of each disease state in each tissue. Each row represents a significant GO biological process which is colored according to the -log10(p.adjust). |
| Page: 1 2 3 4 5 6 7 8 9 |
| GO ID | Tissue | Disease Stage | Description | Gene Ratio | Bg Ratio | pvalue | p.adjust | Count |
| GO:001049822 | Liver | HCC | proteasomal protein catabolic process | 351/7958 | 490/18723 | 6.92e-40 | 1.46e-36 | 351 |
| GO:004316122 | Liver | HCC | proteasome-mediated ubiquitin-dependent protein catabolic process | 299/7958 | 412/18723 | 7.82e-36 | 8.27e-33 | 299 |
| GO:200123322 | Liver | HCC | regulation of apoptotic signaling pathway | 226/7958 | 356/18723 | 7.26e-16 | 5.68e-14 | 226 |
| GO:009719122 | Liver | HCC | extrinsic apoptotic signaling pathway | 143/7958 | 219/18723 | 6.99e-12 | 2.97e-10 | 143 |
| GO:200123412 | Liver | HCC | negative regulation of apoptotic signaling pathway | 145/7958 | 224/18723 | 1.33e-11 | 5.36e-10 | 145 |
| GO:000020921 | Liver | HCC | protein polyubiquitination | 151/7958 | 236/18723 | 1.90e-11 | 7.59e-10 | 151 |
| GO:007093621 | Liver | HCC | protein K48-linked ubiquitination | 52/7958 | 65/18723 | 6.70e-10 | 2.11e-08 | 52 |
| GO:007233122 | Liver | HCC | signal transduction by p53 class mediator | 108/7958 | 163/18723 | 7.14e-10 | 2.23e-08 | 108 |
| GO:200123621 | Liver | HCC | regulation of extrinsic apoptotic signaling pathway | 98/7958 | 151/18723 | 2.17e-08 | 5.08e-07 | 98 |
| GO:190179622 | Liver | HCC | regulation of signal transduction by p53 class mediator | 64/7958 | 93/18723 | 2.53e-07 | 4.45e-06 | 64 |
| GO:004328112 | Liver | HCC | regulation of cysteine-type endopeptidase activity involved in apoptotic process | 125/7958 | 209/18723 | 3.12e-07 | 5.42e-06 | 125 |
| GO:200011612 | Liver | HCC | regulation of cysteine-type endopeptidase activity | 137/7958 | 235/18723 | 6.91e-07 | 1.08e-05 | 137 |
| GO:005254722 | Liver | HCC | regulation of peptidase activity | 247/7958 | 461/18723 | 8.28e-07 | 1.27e-05 | 247 |
| GO:004315412 | Liver | HCC | negative regulation of cysteine-type endopeptidase activity involved in apoptotic process | 54/7958 | 78/18723 | 1.61e-06 | 2.27e-05 | 54 |
| GO:005254822 | Liver | HCC | regulation of endopeptidase activity | 230/7958 | 432/18723 | 3.58e-06 | 4.68e-05 | 230 |
| GO:000862511 | Liver | HCC | extrinsic apoptotic signaling pathway via death domain receptors | 55/7958 | 82/18723 | 5.97e-06 | 7.35e-05 | 55 |
| GO:200011712 | Liver | HCC | negative regulation of cysteine-type endopeptidase activity | 57/7958 | 86/18723 | 7.14e-06 | 8.47e-05 | 57 |
| GO:00319291 | Liver | HCC | TOR signaling | 78/7958 | 126/18723 | 8.49e-06 | 9.97e-05 | 78 |
| GO:200123712 | Liver | HCC | negative regulation of extrinsic apoptotic signaling pathway | 62/7958 | 97/18723 | 1.67e-05 | 1.81e-04 | 62 |
| GO:004586122 | Liver | HCC | negative regulation of proteolysis | 186/7958 | 351/18723 | 4.19e-05 | 4.11e-04 | 186 |
| Page: 1 2 3 4 5 |
| Pathway ID | Tissue | Disease Stage | Description | Gene Ratio | Bg Ratio | pvalue | p.adjust | qvalue | Count |
| Page: 1 |
Top |
Cell-cell communication analysis |
| Identification of potential cell-cell interactions between two cell types and their ligand-receptor pairs for different disease states |
| Ligand | Receptor | LRpair | Pathway | Tissue | Disease Stage |
| Page: 1 |
Top |
Single-cell gene regulatory network inference analysis |
| Find out the significant the regulons (TFs) and the target genes of each regulon across cell types for different disease states |
| TF | Cell Type | Tissue | Disease Stage | Target Gene | RSS | Regulon Activity |
| ∗The dot plots of a searched regulon are shown for all cell subpopulations in each disease state of each tissue based on the regulon specific score inferred using pySCENIC and by calculating the average expression. |
| Page: 1 |
Top |
Somatic mutation of malignant transformation related genes |
| Annotation of somatic variants for genes involved in malignant transformation |
| Hugo Symbol | Variant Class | Variant Classification | dbSNP RS | HGVSc | HGVSp | HGVSp Short | SWISSPROT | BIOTYPE | SIFT | PolyPhen | Tumor Sample Barcode | Tissue | Histology | Sex | Age | Stage | Therapy Types | Drugs | Outcome |
| RFFL | SNV | Missense_Mutation | c.667N>A | p.Glu223Lys | p.E223K | Q8WZ73 | protein_coding | tolerated(0.18) | benign(0.164) | TCGA-A2-A0EY-01 | Breast | breast invasive carcinoma | Female | <65 | I/II | Chemotherapy | adriamycin | SD | |
| RFFL | SNV | Missense_Mutation | c.107N>T | p.Ser36Phe | p.S36F | Q8WZ73 | protein_coding | deleterious(0) | possibly_damaging(0.901) | TCGA-AC-A2B8-01 | Breast | breast invasive carcinoma | Female | >=65 | I/II | Chemotherapy | chemo | PD | |
| RFFL | SNV | Missense_Mutation | novel | c.312G>A | p.Met104Ile | p.M104I | Q8WZ73 | protein_coding | deleterious(0.01) | benign(0.007) | TCGA-C8-A8HQ-01 | Breast | breast invasive carcinoma | Female | <65 | I/II | Unknown | Unknown | SD |
| RFFL | SNV | Missense_Mutation | novel | c.443N>A | p.Ala148Asp | p.A148D | Q8WZ73 | protein_coding | tolerated(0.55) | benign(0.031) | TCGA-GM-A3XG-01 | Breast | breast invasive carcinoma | Female | <65 | III/IV | Chemotherapy | paclitaxel | CR |
| RFFL | SNV | Missense_Mutation | c.503G>T | p.Ser168Ile | p.S168I | Q8WZ73 | protein_coding | tolerated(0.05) | benign(0.062) | TCGA-C5-A1BF-01 | Cervix | cervical & endocervical cancer | Female | <65 | I/II | Chemotherapy | cisplatin | PD | |
| RFFL | SNV | Missense_Mutation | c.458N>G | p.Pro153Arg | p.P153R | Q8WZ73 | protein_coding | tolerated(0.16) | benign(0.1) | TCGA-C5-A1BQ-01 | Cervix | cervical & endocervical cancer | Female | >=65 | III/IV | Chemotherapy | cisplatin | CR | |
| RFFL | SNV | Missense_Mutation | c.42G>C | p.Gln14His | p.Q14H | Q8WZ73 | protein_coding | tolerated(0.05) | benign(0.001) | TCGA-EK-A3GJ-01 | Cervix | cervical & endocervical cancer | Female | <65 | I/II | Unknown | Unknown | SD | |
| RFFL | SNV | Missense_Mutation | novel | c.278C>G | p.Ala93Gly | p.A93G | Q8WZ73 | protein_coding | tolerated(1) | benign(0.013) | TCGA-AA-3966-01 | Colorectum | colon adenocarcinoma | Female | >=65 | I/II | Unknown | Unknown | SD |
| RFFL | SNV | Missense_Mutation | novel | c.582N>T | p.Glu194Asp | p.E194D | Q8WZ73 | protein_coding | tolerated(0.34) | benign(0.001) | TCGA-EI-6917-01 | Colorectum | rectum adenocarcinoma | Male | <65 | III/IV | Chemotherapy | 5fluorouracil+oxaciplatina+l-folinian | SD |
| RFFL | SNV | Missense_Mutation | novel | c.329N>T | p.Arg110Met | p.R110M | Q8WZ73 | protein_coding | deleterious(0) | probably_damaging(0.999) | TCGA-A5-A0G2-01 | Endometrium | uterine corpus endometrioid carcinoma | Female | <65 | III/IV | Unknown | Unknown | SD |
| Page: 1 2 3 4 5 |
Top |
Related drugs of malignant transformation related genes |
| Identification of chemicals and drugs interact with genes involved in malignant transfromation |
| (DGIdb 4.0) |
| Entrez ID | Symbol | Category | Interaction Types | Drug Claim Name | Drug Name | PMIDs |
| Page: 1 |

Copyright 2023-Present -The University of Texas Health Science Center at Houston |