
|
|||||
|
 | |
| |
| |
| |
| |
| |
|
Gene: RFC1 |
Gene summary for RFC1 |
| Gene information | Species | Human | Gene symbol | RFC1 | Gene ID | 5981 |
| Gene name | replication factor C subunit 1 | |
| Gene Alias | A1 | |
| Cytomap | 4p14 | |
| Gene Type | protein-coding | GO ID | GO:0000122 | UniProtAcc | P35251 |
Top |
Malignant transformation analysis |
| Identification of the aberrant gene expression in precancerous and cancerous lesions by comparing the gene expression of stem-like cells in diseased tissues with normal stem cells |
| Entrez ID | Symbol | Replicates | Species | Organ | Tissue | Adj P-value | Log2FC | Malignancy |
| 5981 | RFC1 | LZE2T | Human | Esophagus | ESCC | 7.72e-07 | 7.35e-01 | 0.082 |
| 5981 | RFC1 | LZE4T | Human | Esophagus | ESCC | 8.51e-16 | 4.72e-01 | 0.0811 |
| 5981 | RFC1 | LZE7T | Human | Esophagus | ESCC | 8.78e-13 | 4.29e-01 | 0.0667 |
| 5981 | RFC1 | LZE8T | Human | Esophagus | ESCC | 1.99e-07 | 3.04e-01 | 0.067 |
| 5981 | RFC1 | LZE20T | Human | Esophagus | ESCC | 5.35e-12 | 2.88e-01 | 0.0662 |
| 5981 | RFC1 | LZE24T | Human | Esophagus | ESCC | 2.71e-19 | 3.86e-01 | 0.0596 |
| 5981 | RFC1 | LZE21T | Human | Esophagus | ESCC | 6.52e-03 | 2.67e-01 | 0.0655 |
| 5981 | RFC1 | LZE6T | Human | Esophagus | ESCC | 2.16e-08 | 3.83e-01 | 0.0845 |
| 5981 | RFC1 | P1T-E | Human | Esophagus | ESCC | 5.41e-15 | 7.06e-01 | 0.0875 |
| 5981 | RFC1 | P2T-E | Human | Esophagus | ESCC | 7.23e-65 | 1.18e+00 | 0.1177 |
| 5981 | RFC1 | P4T-E | Human | Esophagus | ESCC | 2.77e-19 | 4.34e-01 | 0.1323 |
| 5981 | RFC1 | P5T-E | Human | Esophagus | ESCC | 1.67e-11 | 4.15e-01 | 0.1327 |
| 5981 | RFC1 | P8T-E | Human | Esophagus | ESCC | 8.44e-29 | 6.32e-01 | 0.0889 |
| 5981 | RFC1 | P9T-E | Human | Esophagus | ESCC | 1.35e-06 | 2.00e-01 | 0.1131 |
| 5981 | RFC1 | P10T-E | Human | Esophagus | ESCC | 2.81e-20 | 5.56e-01 | 0.116 |
| 5981 | RFC1 | P11T-E | Human | Esophagus | ESCC | 5.55e-18 | 7.26e-01 | 0.1426 |
| 5981 | RFC1 | P12T-E | Human | Esophagus | ESCC | 2.33e-35 | 5.87e-01 | 0.1122 |
| 5981 | RFC1 | P15T-E | Human | Esophagus | ESCC | 1.31e-23 | 4.96e-01 | 0.1149 |
| 5981 | RFC1 | P16T-E | Human | Esophagus | ESCC | 1.22e-45 | 8.82e-01 | 0.1153 |
| 5981 | RFC1 | P17T-E | Human | Esophagus | ESCC | 5.92e-09 | 5.94e-01 | 0.1278 |
| Page: 1 2 3 4 5 6 7 |
| Tissue | Expression Dynamics | Abbreviation |
| Esophagus | 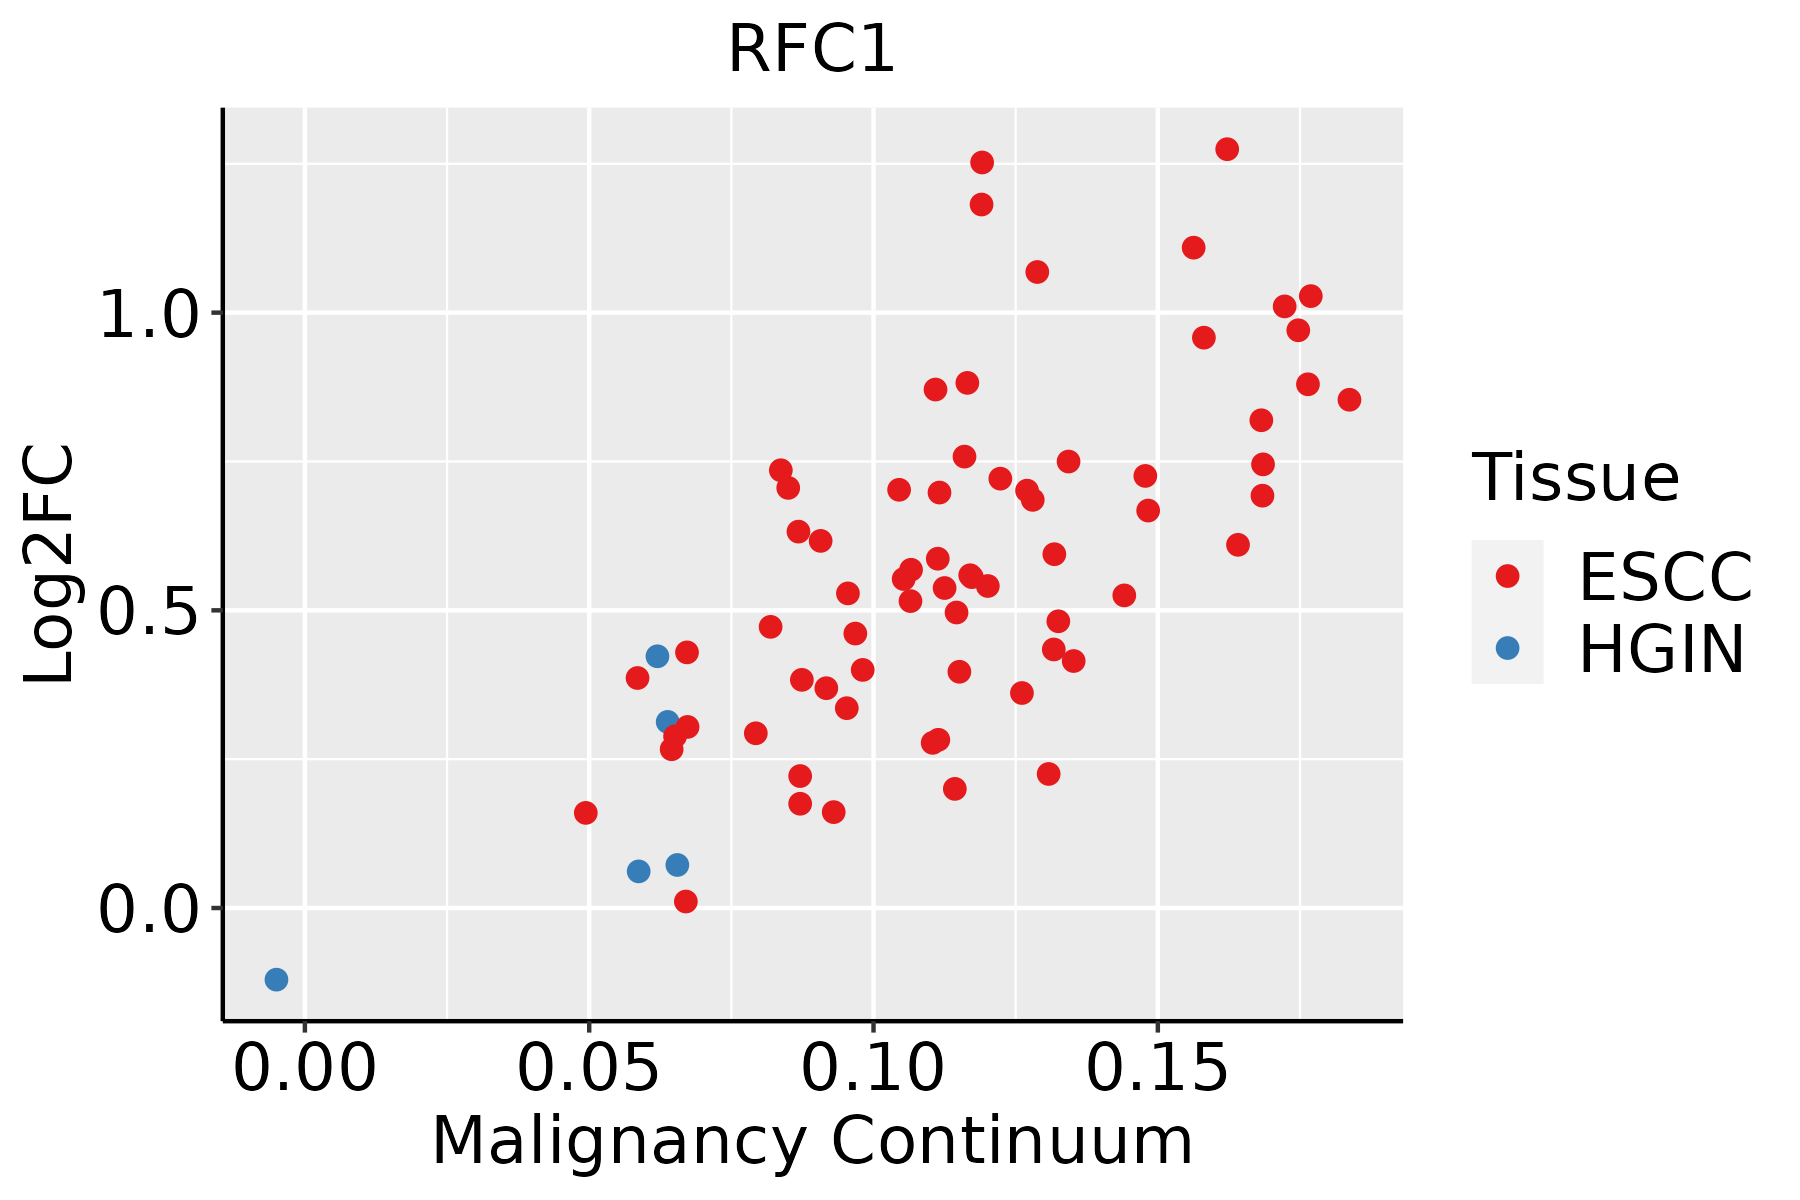 | ESCC: Esophageal squamous cell carcinoma |
| HGIN: High-grade intraepithelial neoplasias | ||
| LGIN: Low-grade intraepithelial neoplasias | ||
| Liver |  | HCC: Hepatocellular carcinoma |
| NAFLD: Non-alcoholic fatty liver disease | ||
| Oral Cavity | 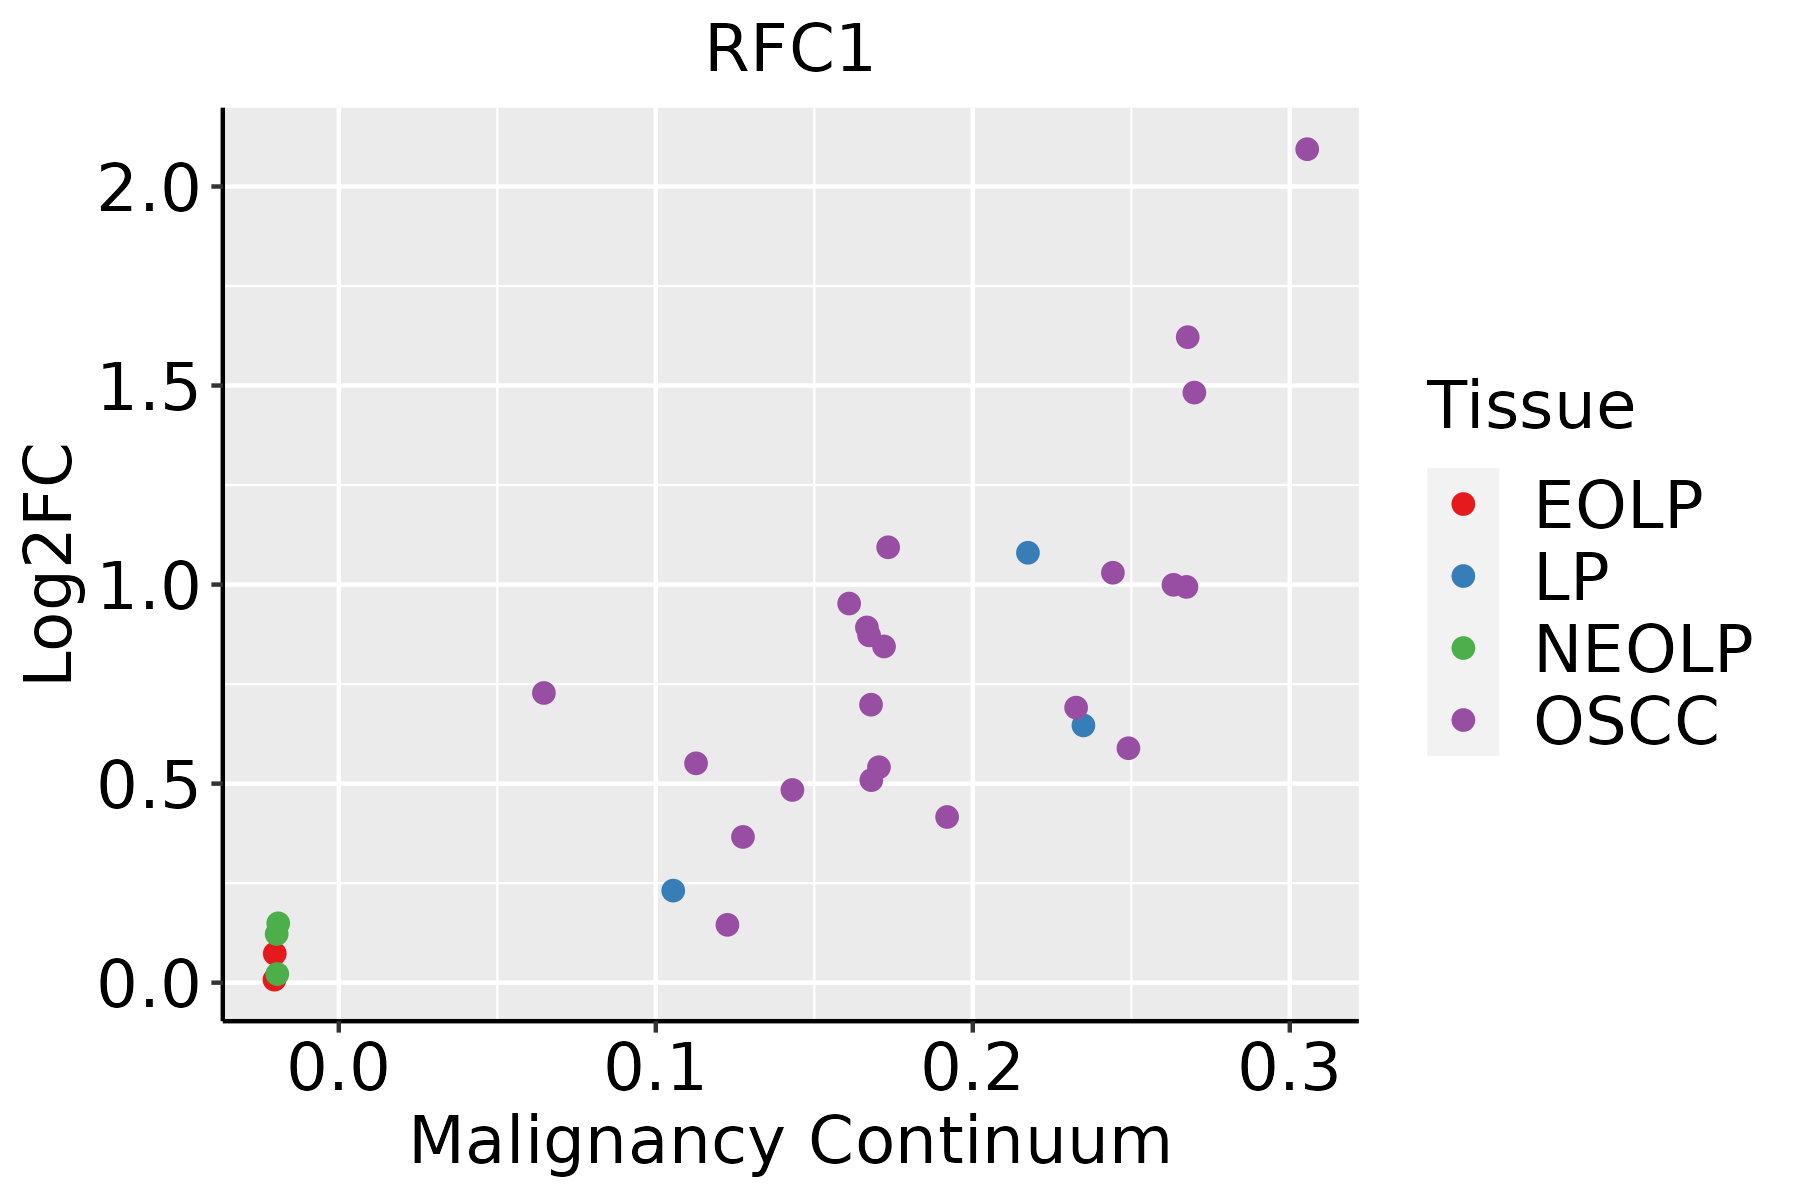 | EOLP: Erosive Oral lichen planus |
| LP: leukoplakia | ||
| NEOLP: Non-erosive oral lichen planus | ||
| OSCC: Oral squamous cell carcinoma | ||
| Prostate |  | BPH: Benign Prostatic Hyperplasia |
| Skin | 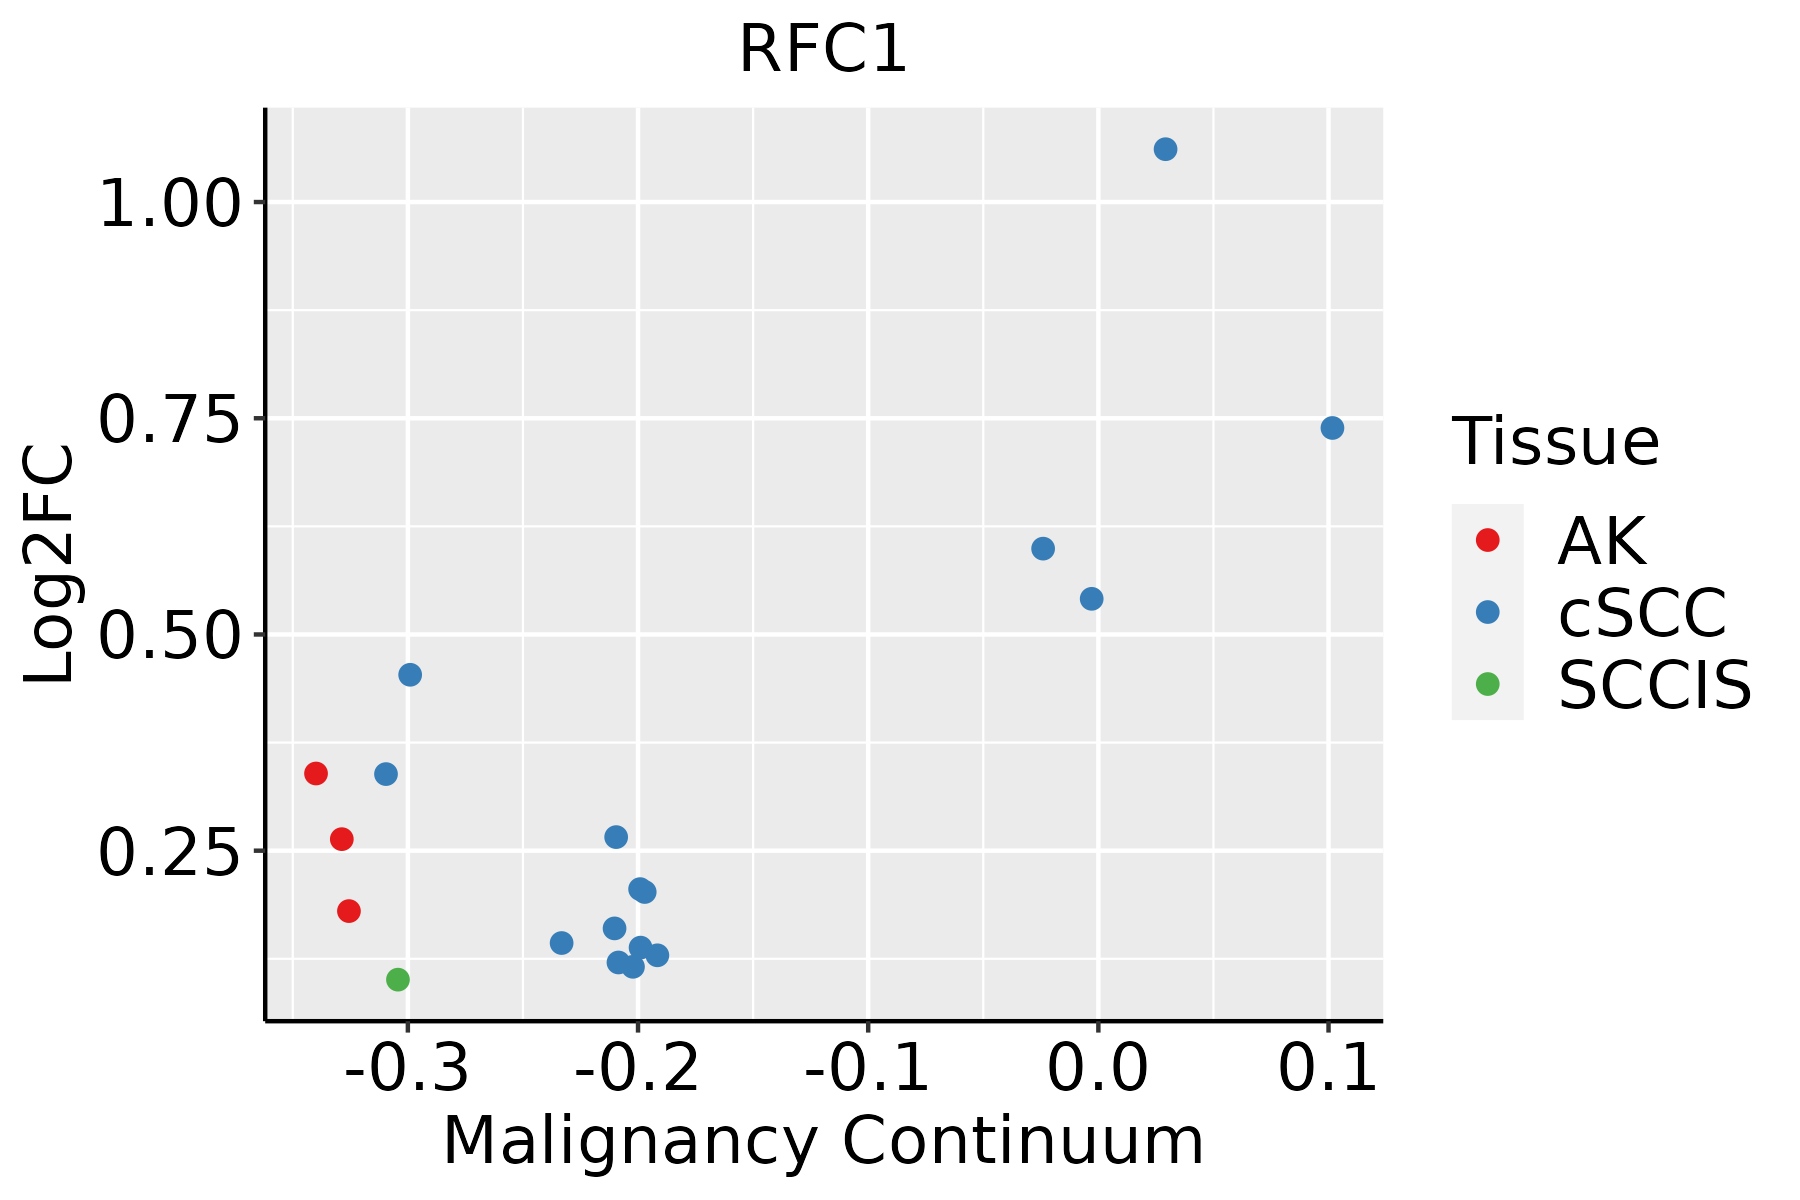 | AK: Actinic keratosis |
| cSCC: Cutaneous squamous cell carcinoma | ||
| SCCIS:squamous cell carcinoma in situ | ||
| Thyroid | 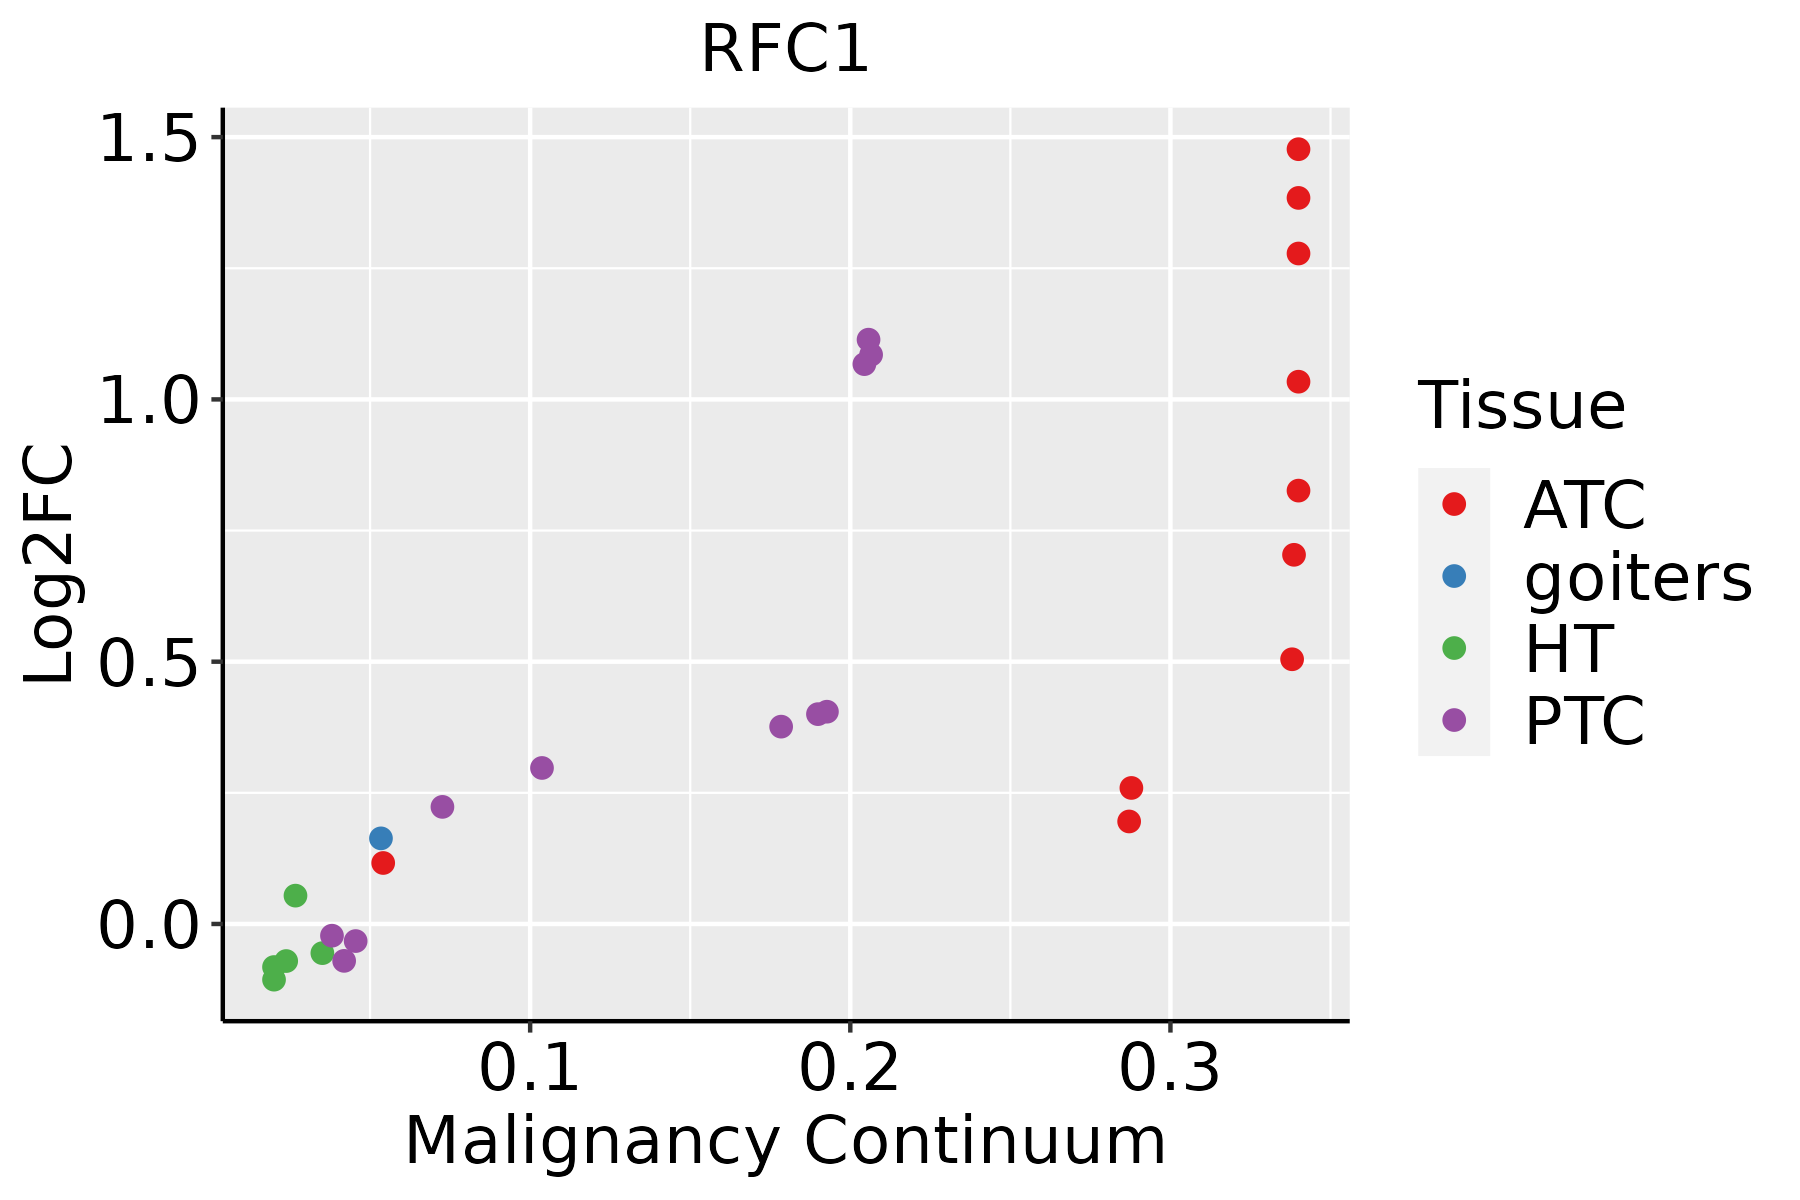 | ATC: Anaplastic thyroid cancer |
| HT: Hashimoto's thyroiditis | ||
| PTC: Papillary thyroid cancer |
| ∗log2FC in expression of this searched gene in stem-like cells from each diseased tissue sample relative to stem-like cells in normal samples in each tissue plotted against the malignancy continuum. Samples are colored based on if they are from different disease stage. |
Top |
Malignant transformation related pathway analysis |
| Find out the enriched GO biological processes and KEGG pathways involved in transition from healthy to precancer to cancer |
| Tissue | Disease Stage | Enriched GO biological Processes |
| Colorectum | AD |  |
| Colorectum | SER |  |
| Colorectum | MSS |  |
| Colorectum | MSI-H |  |
| Colorectum | FAP |  |
| ∗Top 15 enriched GO BP terms are showed in the bar plot of each disease state in each tissue. Each row represents a significant GO biological process which is colored according to the -log10(p.adjust). |
| Page: 1 2 3 4 5 6 7 8 9 |
| GO ID | Tissue | Disease Stage | Description | Gene Ratio | Bg Ratio | pvalue | p.adjust | Count |
| GO:00062604 | Esophagus | ESCC | DNA replication | 181/8552 | 260/18723 | 3.55e-15 | 2.05e-13 | 181 |
| GO:000072319 | Esophagus | ESCC | telomere maintenance | 99/8552 | 131/18723 | 2.68e-12 | 1.08e-10 | 99 |
| GO:007189716 | Esophagus | ESCC | DNA biosynthetic process | 127/8552 | 180/18723 | 1.04e-11 | 3.85e-10 | 127 |
| GO:000700418 | Esophagus | ESCC | telomere maintenance via telomerase | 56/8552 | 69/18723 | 1.40e-09 | 3.30e-08 | 56 |
| GO:001083319 | Esophagus | ESCC | telomere maintenance via telomere lengthening | 61/8552 | 81/18723 | 5.24e-08 | 9.37e-07 | 61 |
| GO:00062612 | Esophagus | ESCC | DNA-dependent DNA replication | 100/8552 | 151/18723 | 2.61e-07 | 3.94e-06 | 100 |
| GO:000627816 | Esophagus | ESCC | RNA-dependent DNA biosynthetic process | 56/8552 | 75/18723 | 3.03e-07 | 4.30e-06 | 56 |
| GO:003220014 | Esophagus | ESCC | telomere organization | 99/8552 | 159/18723 | 1.77e-05 | 1.57e-04 | 99 |
| GO:00108337 | Liver | NAFLD | telomere maintenance via telomere lengthening | 16/1882 | 81/18723 | 6.20e-03 | 4.62e-02 | 16 |
| GO:00007237 | Liver | Cirrhotic | telomere maintenance | 58/4634 | 131/18723 | 7.93e-07 | 1.66e-05 | 58 |
| GO:00070046 | Liver | Cirrhotic | telomere maintenance via telomerase | 35/4634 | 69/18723 | 2.90e-06 | 5.16e-05 | 35 |
| GO:001083312 | Liver | Cirrhotic | telomere maintenance via telomere lengthening | 38/4634 | 81/18723 | 1.20e-05 | 1.69e-04 | 38 |
| GO:00062785 | Liver | Cirrhotic | RNA-dependent DNA biosynthetic process | 35/4634 | 75/18723 | 3.01e-05 | 3.78e-04 | 35 |
| GO:00322002 | Liver | Cirrhotic | telomere organization | 58/4634 | 159/18723 | 6.31e-04 | 4.82e-03 | 58 |
| GO:000072311 | Liver | HCC | telomere maintenance | 85/7958 | 131/18723 | 1.86e-07 | 3.40e-06 | 85 |
| GO:000700412 | Liver | HCC | telomere maintenance via telomerase | 49/7958 | 69/18723 | 1.51e-06 | 2.15e-05 | 49 |
| GO:00062601 | Liver | HCC | DNA replication | 146/7958 | 260/18723 | 5.68e-06 | 7.02e-05 | 146 |
| GO:000627811 | Liver | HCC | RNA-dependent DNA biosynthetic process | 50/7958 | 75/18723 | 2.02e-05 | 2.17e-04 | 50 |
| GO:001083322 | Liver | HCC | telomere maintenance via telomere lengthening | 52/7958 | 81/18723 | 6.59e-05 | 6.00e-04 | 52 |
| GO:00718975 | Liver | HCC | DNA biosynthetic process | 99/7958 | 180/18723 | 4.66e-04 | 3.08e-03 | 99 |
| Page: 1 2 3 4 |
| Pathway ID | Tissue | Disease Stage | Description | Gene Ratio | Bg Ratio | pvalue | p.adjust | qvalue | Count |
| hsa0342022 | Esophagus | ESCC | Nucleotide excision repair | 54/4205 | 63/8465 | 2.01e-09 | 2.17e-08 | 1.11e-08 | 54 |
| hsa034104 | Esophagus | ESCC | Base excision repair | 38/4205 | 44/8465 | 3.59e-07 | 2.62e-06 | 1.34e-06 | 38 |
| hsa030304 | Esophagus | ESCC | DNA replication | 32/4205 | 36/8465 | 7.71e-07 | 5.06e-06 | 2.59e-06 | 32 |
| hsa034304 | Esophagus | ESCC | Mismatch repair | 21/4205 | 23/8465 | 2.85e-05 | 1.35e-04 | 6.90e-05 | 21 |
| hsa0342032 | Esophagus | ESCC | Nucleotide excision repair | 54/4205 | 63/8465 | 2.01e-09 | 2.17e-08 | 1.11e-08 | 54 |
| hsa0341011 | Esophagus | ESCC | Base excision repair | 38/4205 | 44/8465 | 3.59e-07 | 2.62e-06 | 1.34e-06 | 38 |
| hsa0303011 | Esophagus | ESCC | DNA replication | 32/4205 | 36/8465 | 7.71e-07 | 5.06e-06 | 2.59e-06 | 32 |
| hsa0343011 | Esophagus | ESCC | Mismatch repair | 21/4205 | 23/8465 | 2.85e-05 | 1.35e-04 | 6.90e-05 | 21 |
| hsa03420 | Liver | Cirrhotic | Nucleotide excision repair | 29/2530 | 63/8465 | 4.81e-03 | 1.74e-02 | 1.07e-02 | 29 |
| hsa034201 | Liver | Cirrhotic | Nucleotide excision repair | 29/2530 | 63/8465 | 4.81e-03 | 1.74e-02 | 1.07e-02 | 29 |
| hsa034202 | Liver | HCC | Nucleotide excision repair | 41/4020 | 63/8465 | 3.59e-03 | 1.12e-02 | 6.22e-03 | 41 |
| hsa034203 | Liver | HCC | Nucleotide excision repair | 41/4020 | 63/8465 | 3.59e-03 | 1.12e-02 | 6.22e-03 | 41 |
| hsa034204 | Oral cavity | OSCC | Nucleotide excision repair | 49/3704 | 63/8465 | 3.48e-08 | 2.91e-07 | 1.48e-07 | 49 |
| hsa03030 | Oral cavity | OSCC | DNA replication | 31/3704 | 36/8465 | 1.70e-07 | 1.19e-06 | 6.03e-07 | 31 |
| hsa03410 | Oral cavity | OSCC | Base excision repair | 32/3704 | 44/8465 | 9.11e-05 | 3.25e-04 | 1.65e-04 | 32 |
| hsa03430 | Oral cavity | OSCC | Mismatch repair | 19/3704 | 23/8465 | 1.55e-04 | 5.34e-04 | 2.72e-04 | 19 |
| hsa0342011 | Oral cavity | OSCC | Nucleotide excision repair | 49/3704 | 63/8465 | 3.48e-08 | 2.91e-07 | 1.48e-07 | 49 |
| hsa030301 | Oral cavity | OSCC | DNA replication | 31/3704 | 36/8465 | 1.70e-07 | 1.19e-06 | 6.03e-07 | 31 |
| hsa034101 | Oral cavity | OSCC | Base excision repair | 32/3704 | 44/8465 | 9.11e-05 | 3.25e-04 | 1.65e-04 | 32 |
| hsa034301 | Oral cavity | OSCC | Mismatch repair | 19/3704 | 23/8465 | 1.55e-04 | 5.34e-04 | 2.72e-04 | 19 |
| Page: 1 2 |
Top |
Cell-cell communication analysis |
| Identification of potential cell-cell interactions between two cell types and their ligand-receptor pairs for different disease states |
| Ligand | Receptor | LRpair | Pathway | Tissue | Disease Stage |
| Page: 1 |
Top |
Single-cell gene regulatory network inference analysis |
| Find out the significant the regulons (TFs) and the target genes of each regulon across cell types for different disease states |
| TF | Cell Type | Tissue | Disease Stage | Target Gene | RSS | Regulon Activity |
| ∗The dot plots of a searched regulon are shown for all cell subpopulations in each disease state of each tissue based on the regulon specific score inferred using pySCENIC and by calculating the average expression. |
| Page: 1 |
Top |
Somatic mutation of malignant transformation related genes |
| Annotation of somatic variants for genes involved in malignant transformation |
| Hugo Symbol | Variant Class | Variant Classification | dbSNP RS | HGVSc | HGVSp | HGVSp Short | SWISSPROT | BIOTYPE | SIFT | PolyPhen | Tumor Sample Barcode | Tissue | Histology | Sex | Age | Stage | Therapy Types | Drugs | Outcome |
| RFC1 | SNV | Missense_Mutation | c.145N>T | p.Arg49Cys | p.R49C | P35251 | protein_coding | tolerated_low_confidence(0.19) | benign(0) | TCGA-A7-A26F-01 | Breast | breast invasive carcinoma | Female | <65 | I/II | Chemotherapy | taxotere | SD | |
| RFC1 | SNV | Missense_Mutation | c.1233N>G | p.Ile411Met | p.I411M | P35251 | protein_coding | tolerated(0.05) | benign(0.045) | TCGA-A8-A06U-01 | Breast | breast invasive carcinoma | Female | >=65 | I/II | Unknown | Unknown | SD | |
| RFC1 | SNV | Missense_Mutation | novel | c.453G>T | p.Lys151Asn | p.K151N | P35251 | protein_coding | tolerated(0.05) | possibly_damaging(0.859) | TCGA-AN-A046-01 | Breast | breast invasive carcinoma | Female | >=65 | I/II | Unknown | Unknown | SD |
| RFC1 | SNV | Missense_Mutation | rs767574991 | c.1837N>T | p.Arg613Cys | p.R613C | P35251 | protein_coding | deleterious(0.01) | possibly_damaging(0.786) | TCGA-AN-A0AK-01 | Breast | breast invasive carcinoma | Female | >=65 | I/II | Unknown | Unknown | SD |
| RFC1 | SNV | Missense_Mutation | c.2171N>T | p.Gly724Val | p.G724V | P35251 | protein_coding | deleterious(0) | probably_damaging(1) | TCGA-AN-A0AR-01 | Breast | breast invasive carcinoma | Female | <65 | I/II | Unknown | Unknown | SD | |
| RFC1 | SNV | Missense_Mutation | c.2705N>G | p.Lys902Arg | p.K902R | P35251 | protein_coding | tolerated(0.05) | benign(0.253) | TCGA-EW-A1PH-01 | Breast | breast invasive carcinoma | Female | <65 | I/II | Chemotherapy | cyclophosphamide | SD | |
| RFC1 | SNV | Missense_Mutation | novel | c.2471N>A | p.Arg824Gln | p.R824Q | P35251 | protein_coding | tolerated(0.46) | benign(0.001) | TCGA-LL-A73Y-01 | Breast | breast invasive carcinoma | Female | >=65 | I/II | Chemotherapy | taxotere | SD |
| RFC1 | insertion | Nonsense_Mutation | novel | c.758_759insAGTGAAATGGTGATGATTTCAGAATGCTTTTGTTTGTGGACAATGCT | p.Gln255LysfsTer3 | p.Q255Kfs*3 | P35251 | protein_coding | TCGA-AN-A0FN-01 | Breast | breast invasive carcinoma | Female | <65 | I/II | Unknown | Unknown | SD | ||
| RFC1 | deletion | Frame_Shift_Del | novel | c.1955delN | p.Pro652LeufsTer24 | p.P652Lfs*24 | P35251 | protein_coding | TCGA-EW-A2FV-01 | Breast | breast invasive carcinoma | Female | <65 | III/IV | Chemotherapy | docetaxel | SD | ||
| RFC1 | deletion | Frame_Shift_Del | novel | c.900delN | p.Lys301SerfsTer7 | p.K301Sfs*7 | P35251 | protein_coding | TCGA-EW-A2FV-01 | Breast | breast invasive carcinoma | Female | <65 | III/IV | Chemotherapy | docetaxel | SD |
| Page: 1 2 3 4 5 6 7 8 9 10 11 12 13 14 15 |
Top |
Related drugs of malignant transformation related genes |
| Identification of chemicals and drugs interact with genes involved in malignant transfromation |
| (DGIdb 4.0) |
| Entrez ID | Symbol | Category | Interaction Types | Drug Claim Name | Drug Name | PMIDs |
| 5981 | RFC1 | DNA REPAIR | PRALATREXATE | PRALATREXATE |
| Page: 1 |

Copyright 2023-Present -The University of Texas Health Science Center at Houston |