Schematic overview of the cellular and molecular mechanisms involved in the cancer progression, including the proposed cellular and molecular mechanisms in cancer cells trajectory. AT1: alveolar type 1 cells; AT2: alveolar type 2 cells; AAH: atypical adenomatous hyperplasia; AIS: adenocarcinoma in situ; MIA: minimally invasive adenocarcinoma; IA: invasive adenocarcinoma; EMT: epithelial-mesenchymal transition

Home

Download

Statistics

Help

Contact

Center for Computational Systems Medicine
leaf

Gene summary

leaf

Malignant transformation analysis

leaf

Malignant transformation related pathway analysis

leaf

Cell-cell communication analysis

leaf

Single-cell gene regulatory network inference analysis

leaf

Somatic mutation of malignant transformation related genes

leaf

Related drugs of malignant transformation related genes

Gene: REXO2

Gene summary for REXO2

check button Gene summary.

Gene informationSpeciesHuman
Gene symbol

REXO2

Gene ID

25996

Gene nameRNA exonuclease 2
Gene AliasCGI-114
Cytomap11q23.2
Gene Typeprotein-coding
GO ID

GO:0006139

UniProtAcc

Q9Y3B8


Top

Malignant transformation analysis

check button Identification of the aberrant gene expression in precancerous and cancerous lesions by comparing the gene expression of stem-like cells in diseased tissues with normal stem cells
check button Malignant transformation involving gene list.
Entrez IDSymbolReplicatesSpeciesOrganTissueAdj P-valueLog2FCMalignancy
25996REXO2AEH-subject1HumanEndometriumAEH6.04e-09-3.35e-01-0.3059
25996REXO2AEH-subject2HumanEndometriumAEH6.32e-06-3.14e-01-0.2525
25996REXO2AEH-subject3HumanEndometriumAEH3.64e-06-2.64e-01-0.2576
25996REXO2AEH-subject4HumanEndometriumAEH1.44e-04-2.40e-01-0.2657
25996REXO2AEH-subject5HumanEndometriumAEH7.18e-07-3.75e-01-0.2953
25996REXO2EEC-subject1HumanEndometriumEEC6.04e-09-3.46e-01-0.2682
25996REXO2EEC-subject2HumanEndometriumEEC4.75e-12-3.48e-01-0.2607
25996REXO2EEC-subject3HumanEndometriumEEC4.23e-25-2.70e-01-0.2525
25996REXO2EEC-subject4HumanEndometriumEEC4.42e-05-2.74e-01-0.2571
25996REXO2EEC-subject5HumanEndometriumEEC4.53e-06-3.08e-01-0.249
25996REXO2GSM6177620_NYU_UCEC1_lib1_lib1HumanEndometriumEEC2.41e-20-3.66e-01-0.1869
25996REXO2GSM6177620_NYU_UCEC1_lib2_lib2HumanEndometriumEEC3.36e-23-3.65e-01-0.1875
25996REXO2GSM6177620_NYU_UCEC1_lib3_lib3HumanEndometriumEEC1.00e-26-4.27e-01-0.1883
25996REXO2GSM6177621_NYU_UCEC2_lib1_lib1HumanEndometriumEEC7.02e-31-2.72e-01-0.1934
25996REXO2GSM6177622_NYU_UCEC3_lib1_lib1HumanEndometriumEEC2.17e-41-3.57e-01-0.1917
25996REXO2GSM6177622_NYU_UCEC3_lib2_lib2HumanEndometriumEEC3.96e-32-4.56e-01-0.1916
25996REXO2GSM6177623_NYU_UCEC3_VisHumanEndometriumEEC8.69e-04-2.42e-01-0.1269
25996REXO2LZE4THumanEsophagusESCC3.61e-093.88e-010.0811
25996REXO2LZE8THumanEsophagusESCC4.18e-039.53e-020.067
25996REXO2LZE20THumanEsophagusESCC1.29e-033.49e-010.0662
Page: 1 2 3 4 5 6 7 8 

check button Transcriptomic changes along malignancy continuum.
TissueExpression DynamicsAbbreviation
EndometriumThe image shows the transcriptomic changes along malignancy continuum.log2FC in expression of this searched gene in stem-like cells from each diseased tissue sample relative to stem-like cells in normal samples in each tissue plotted against the malignancy continuum. Samples are colored based on if they are from different disease stage.AEH: Atypical endometrial hyperplasia
EEC: Endometrioid Cancer
EsophagusThe image shows the transcriptomic changes along malignancy continuum.log2FC in expression of this searched gene in stem-like cells from each diseased tissue sample relative to stem-like cells in normal samples in each tissue plotted against the malignancy continuum. Samples are colored based on if they are from different disease stage.ESCC: Esophageal squamous cell carcinoma
HGIN: High-grade intraepithelial neoplasias
LGIN: Low-grade intraepithelial neoplasias
LiverThe image shows the transcriptomic changes along malignancy continuum.log2FC in expression of this searched gene in stem-like cells from each diseased tissue sample relative to stem-like cells in normal samples in each tissue plotted against the malignancy continuum. Samples are colored based on if they are from different disease stage.
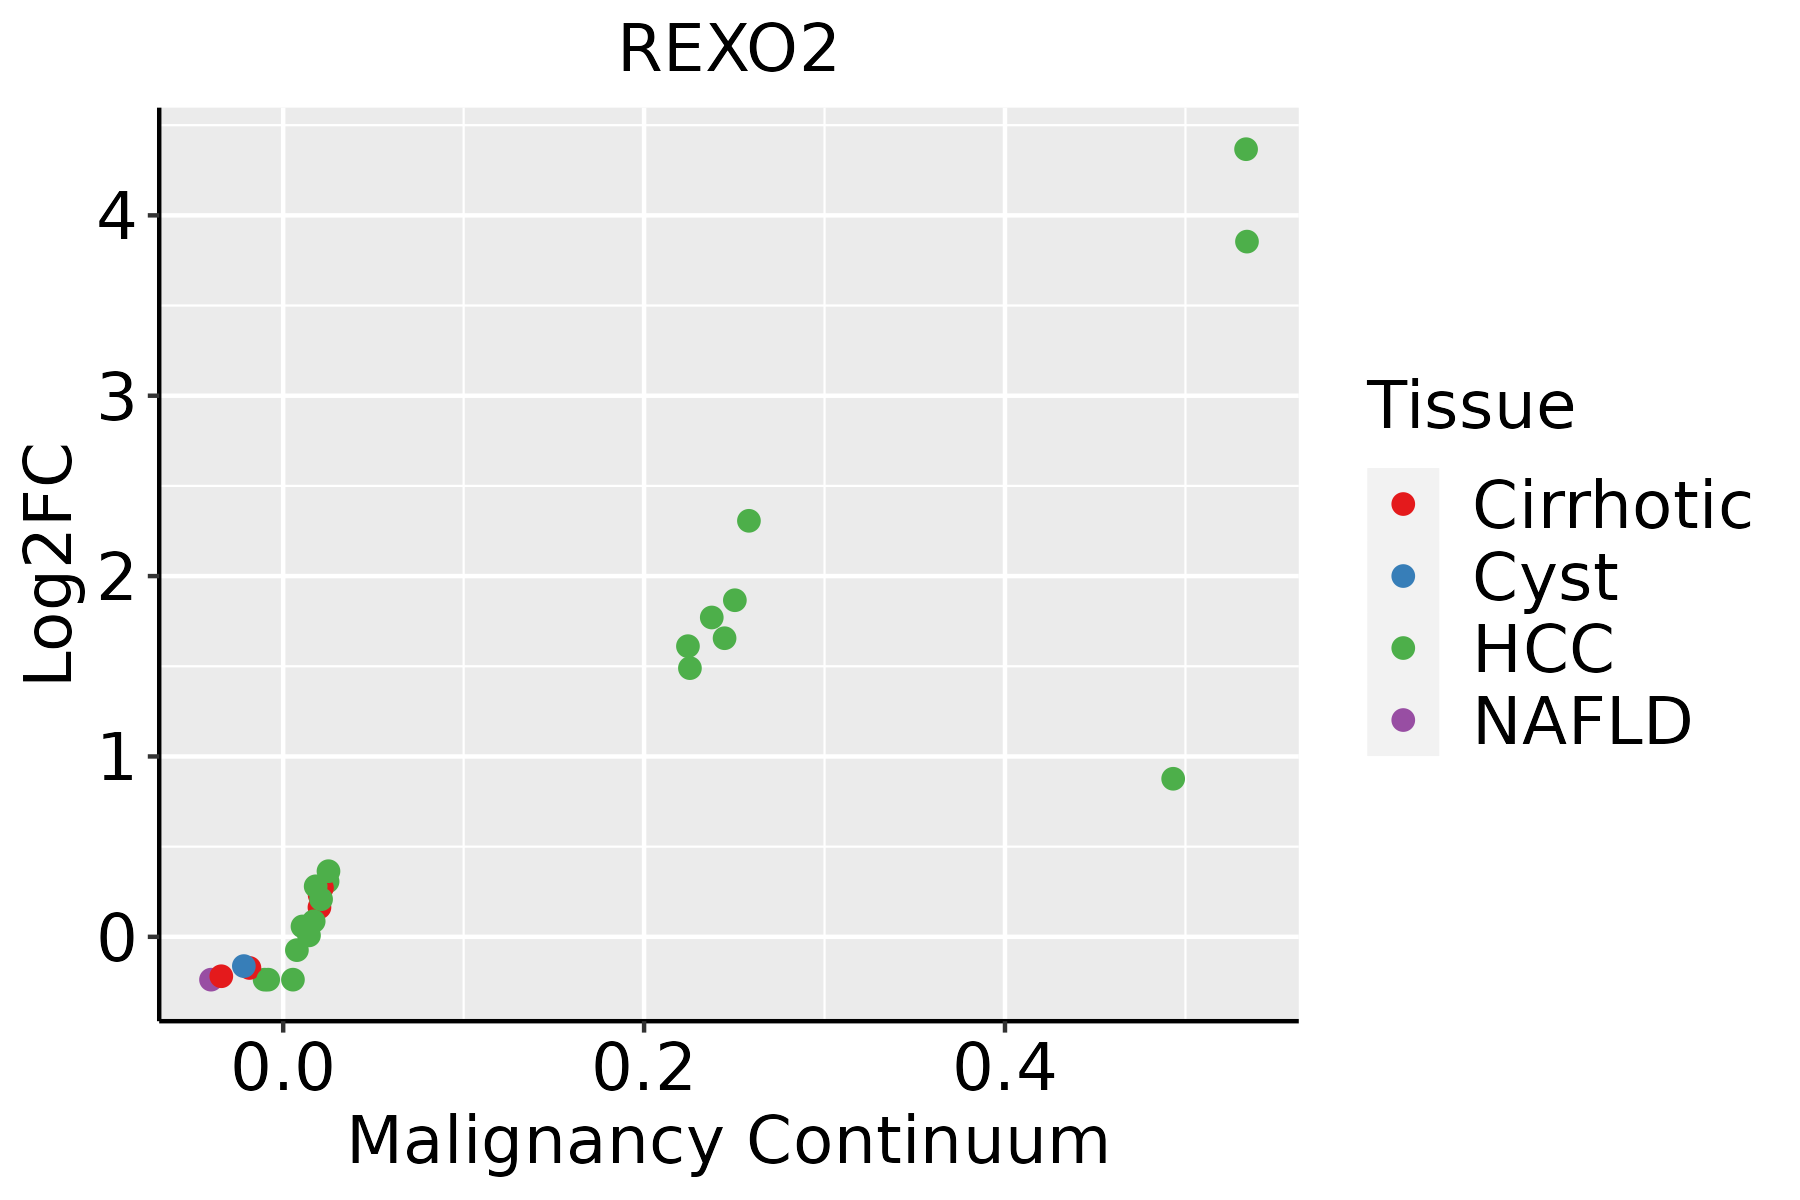
HCC: Hepatocellular carcinoma
NAFLD: Non-alcoholic fatty liver disease
Oral CavityThe image shows the transcriptomic changes along malignancy continuum.log2FC in expression of this searched gene in stem-like cells from each diseased tissue sample relative to stem-like cells in normal samples in each tissue plotted against the malignancy continuum. Samples are colored based on if they are from different disease stage.
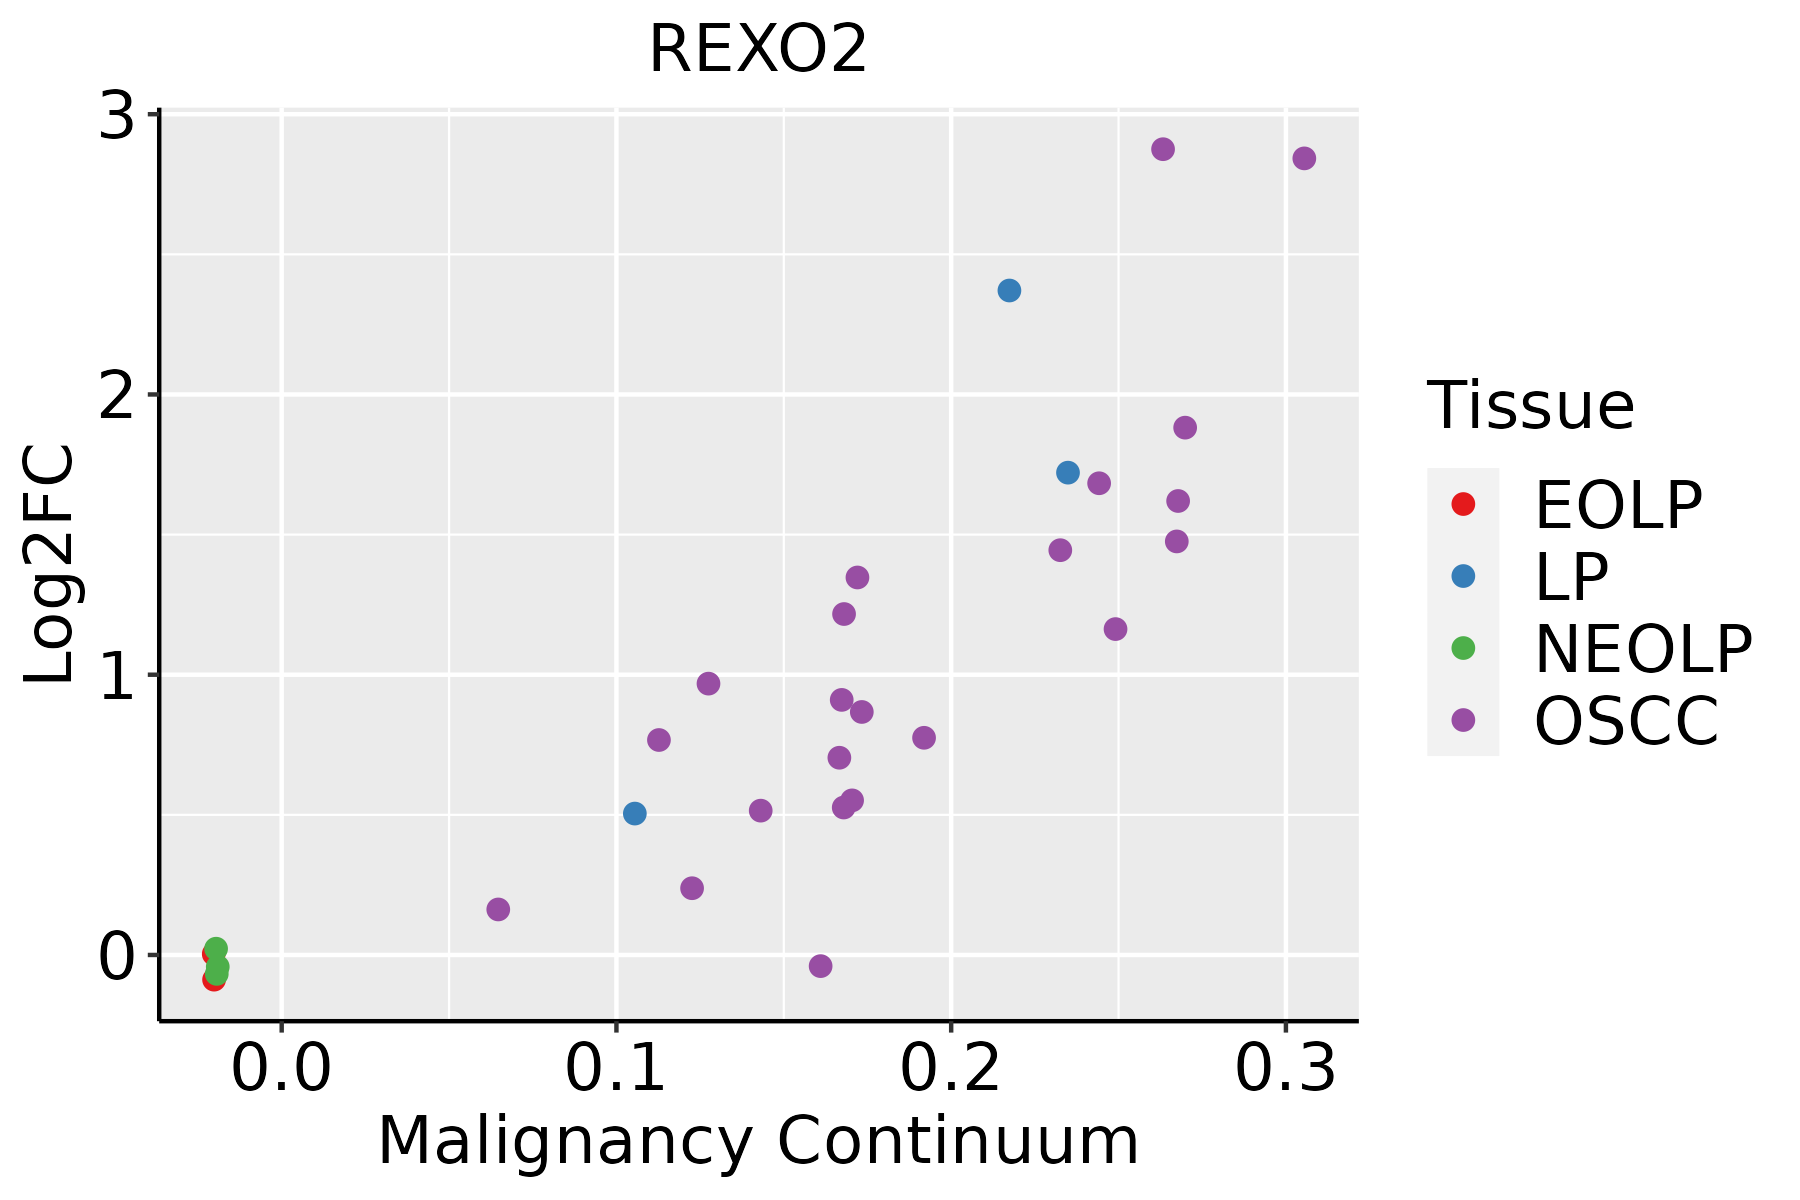
EOLP: Erosive Oral lichen planus
LP: leukoplakia
NEOLP: Non-erosive oral lichen planus
OSCC: Oral squamous cell carcinoma
ProstateThe image shows the transcriptomic changes along malignancy continuum.log2FC in expression of this searched gene in stem-like cells from each diseased tissue sample relative to stem-like cells in normal samples in each tissue plotted against the malignancy continuum. Samples are colored based on if they are from different disease stage.BPH: Benign Prostatic Hyperplasia
SkinThe image shows the transcriptomic changes along malignancy continuum.log2FC in expression of this searched gene in stem-like cells from each diseased tissue sample relative to stem-like cells in normal samples in each tissue plotted against the malignancy continuum. Samples are colored based on if they are from different disease stage.
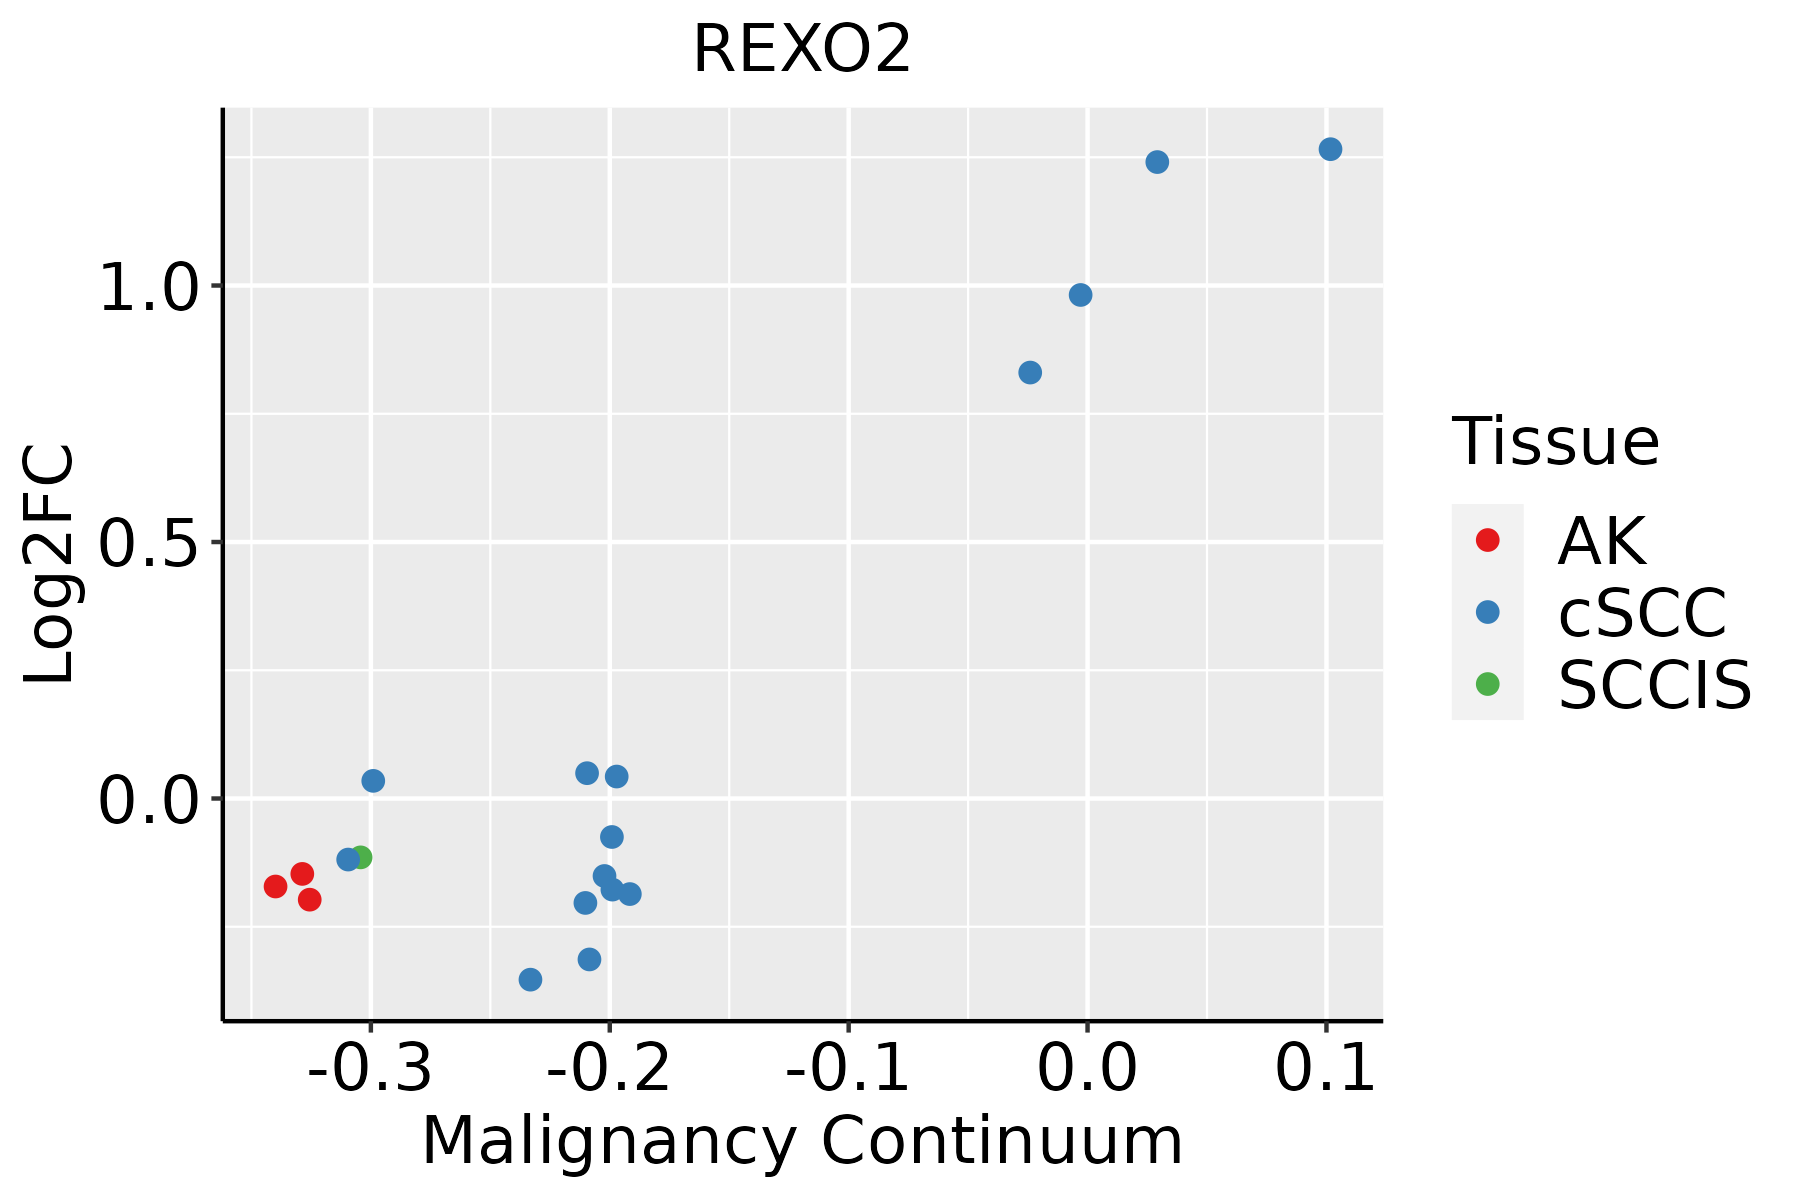
AK: Actinic keratosis
cSCC: Cutaneous squamous cell carcinoma
SCCIS:squamous cell carcinoma in situ
ThyroidThe image shows the transcriptomic changes along malignancy continuum.log2FC in expression of this searched gene in stem-like cells from each diseased tissue sample relative to stem-like cells in normal samples in each tissue plotted against the malignancy continuum. Samples are colored based on if they are from different disease stage.
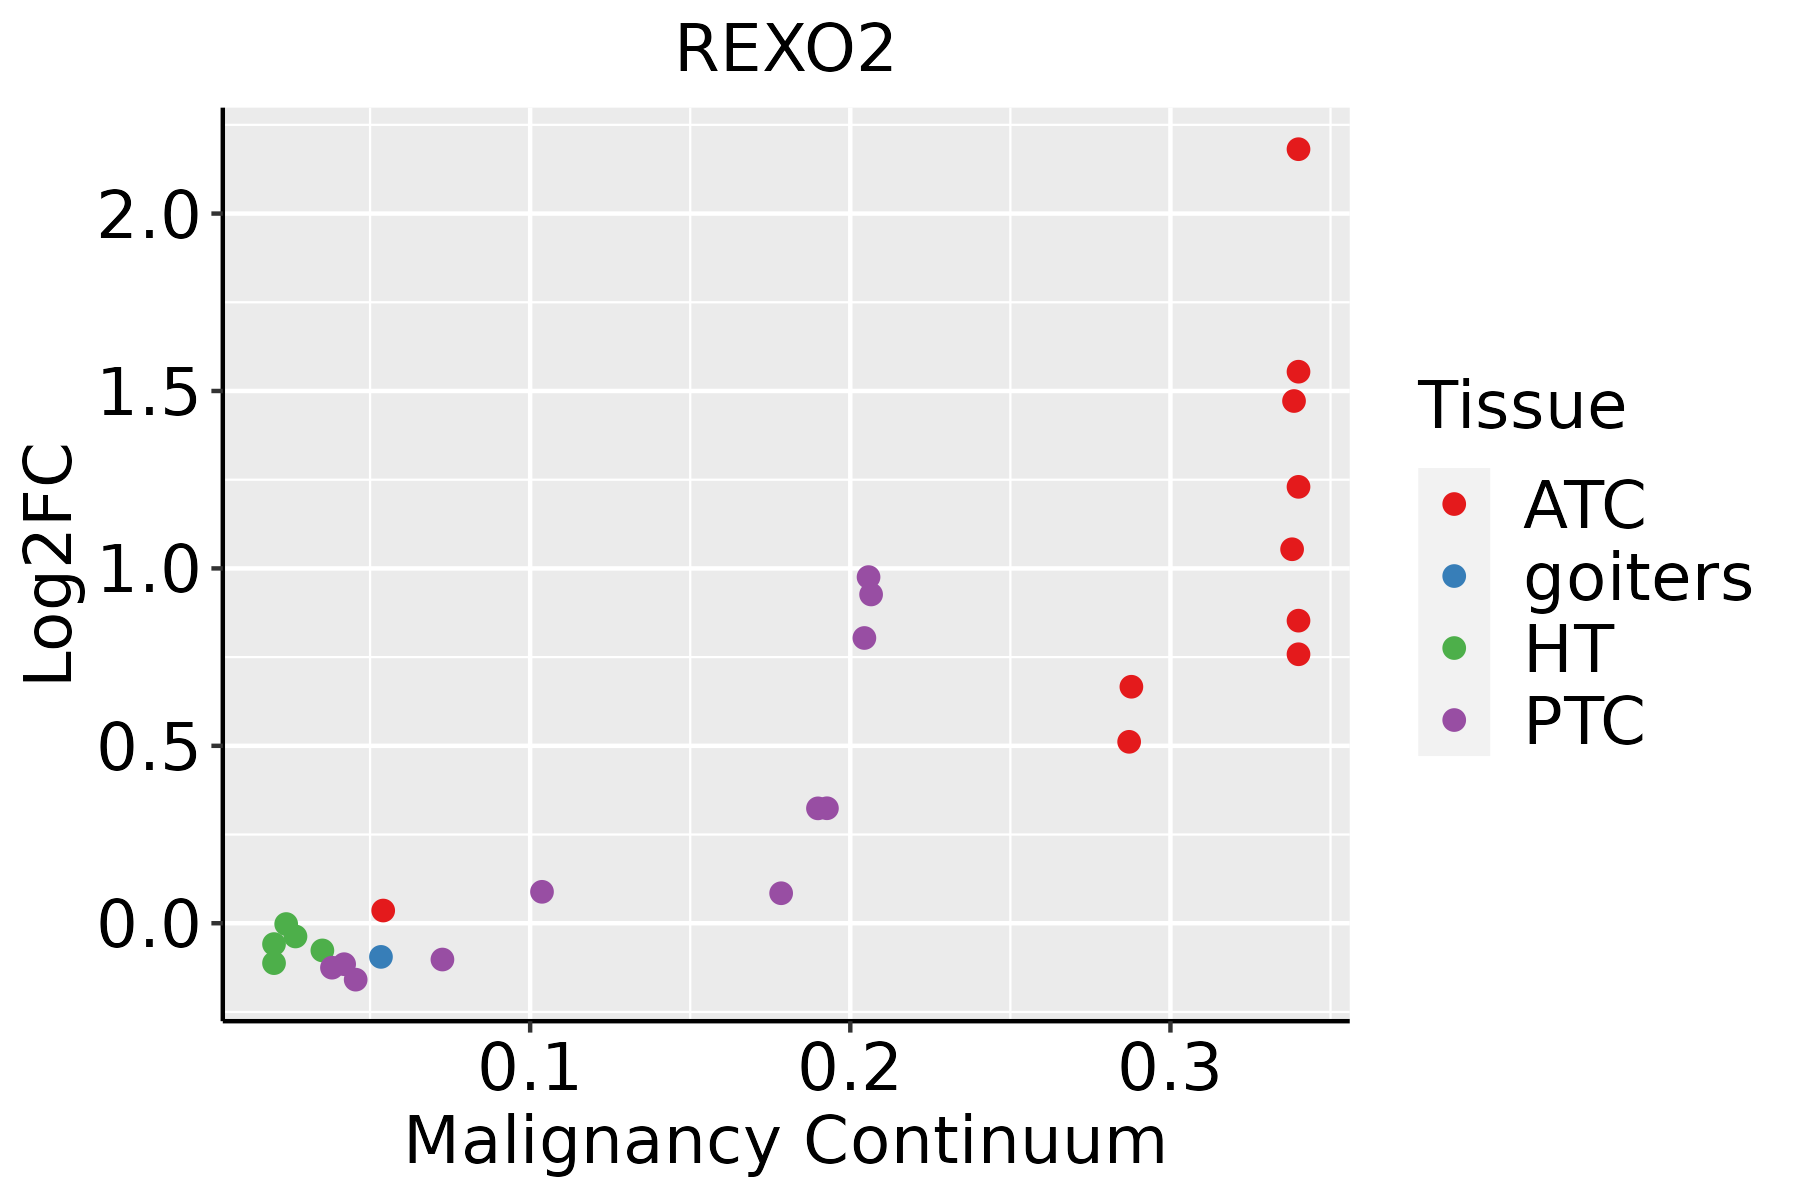
ATC: Anaplastic thyroid cancer
HT: Hashimoto's thyroiditis
PTC: Papillary thyroid cancer
∗log2FC in expression of this searched gene in stem-like cells from each diseased tissue sample relative to stem-like cells in normal samples in each tissue plotted against the malignancy continuum. Samples are colored based on if they are from different disease stage.

Top

Malignant transformation related pathway analysis

check buttonFind out the enriched GO biological processes and KEGG pathways involved in transition from healthy to precancer to cancer
check button Figure of enriched GO biological processes.
TissueDisease StageEnriched GO biological Processes
ColorectumADGO analysis - Figure of enriched GO biological processes: Top 15 enriched GO BP terms are showed in the bar plot of each disease state in each tissue. Each row represents a significant GO biological process which is colored according to the -log10(p.adjust).
ColorectumSERGO analysis - Figure of enriched GO biological processes: Top 15 enriched GO BP terms are showed in the bar plot of each disease state in each tissue. Each row represents a significant GO biological process which is colored according to the -log10(p.adjust).
ColorectumMSSGO analysis - Figure of enriched GO biological processes: Top 15 enriched GO BP terms are showed in the bar plot of each disease state in each tissue. Each row represents a significant GO biological process which is colored according to the -log10(p.adjust).
ColorectumMSI-HGO analysis - Figure of enriched GO biological processes: Top 15 enriched GO BP terms are showed in the bar plot of each disease state in each tissue. Each row represents a significant GO biological process which is colored according to the -log10(p.adjust).
ColorectumFAPGO analysis - Figure of enriched GO biological processes: Top 15 enriched GO BP terms are showed in the bar plot of each disease state in each tissue. Each row represents a significant GO biological process which is colored according to the -log10(p.adjust).
∗Top 15 enriched GO BP terms are showed in the bar plot of each disease state in each tissue. Each row represents a significant GO biological process which is colored according to the -log10(p.adjust).
Page: 1 2 3 4 5 6 7 8 9 

check button Enriched GO biological processes.
GO IDTissueDisease StageDescriptionGene RatioBg Ratiopvaluep.adjustCount
GO:000911715EndometriumAEHnucleotide metabolic process78/2100489/187238.39e-047.82e-0378
GO:000675314EndometriumAEHnucleoside phosphate metabolic process78/2100497/187231.34e-031.13e-0278
GO:000911716EndometriumEECnucleotide metabolic process80/2168489/187238.65e-047.95e-0380
GO:000675315EndometriumEECnucleoside phosphate metabolic process80/2168497/187231.39e-031.14e-0280
GO:000911720EsophagusHGINnucleotide metabolic process92/2587489/187231.11e-031.36e-0292
GO:000675320EsophagusHGINnucleoside phosphate metabolic process93/2587497/187231.25e-031.49e-0293
GO:00905013EsophagusESCCRNA phosphodiester bond hydrolysis110/8552152/187231.95e-116.81e-10110
GO:0006753110EsophagusESCCnucleoside phosphate metabolic process288/8552497/187231.80e-083.50e-07288
GO:00903053EsophagusESCCnucleic acid phosphodiester bond hydrolysis163/8552261/187233.07e-085.73e-07163
GO:0009117111EsophagusESCCnucleotide metabolic process282/8552489/187234.70e-088.50e-07282
GO:00905033EsophagusESCCRNA phosphodiester bond hydrolysis, exonucleolytic35/855242/187235.35e-077.11e-0635
GO:000675312LiverCirrhoticnucleoside phosphate metabolic process190/4634497/187231.10e-116.96e-10190
GO:000911712LiverCirrhoticnucleotide metabolic process187/4634489/187231.55e-119.63e-10187
GO:0090501LiverCirrhoticRNA phosphodiester bond hydrolysis54/4634152/187231.89e-031.19e-0254
GO:0090503LiverCirrhoticRNA phosphodiester bond hydrolysis, exonucleolytic19/463442/187233.00e-031.71e-0219
GO:000911722LiverHCCnucleotide metabolic process300/7958489/187231.61e-171.71e-15300
GO:000675322LiverHCCnucleoside phosphate metabolic process304/7958497/187231.78e-171.85e-15304
GO:00905011LiverHCCRNA phosphodiester bond hydrolysis101/7958152/187231.99e-095.63e-08101
GO:0090305LiverHCCnucleic acid phosphodiester bond hydrolysis152/7958261/187231.90e-073.46e-06152
GO:00905031LiverHCCRNA phosphodiester bond hydrolysis, exonucleolytic29/795842/187234.57e-043.04e-0329
Page: 1 2 3 

check button Enriched KEGG pathways.
Pathway IDTissueDisease StageDescriptionGene RatioBg Ratiopvaluep.adjustqvalueCount
Page: 1 

Top

Cell-cell communication analysis

check buttonIdentification of potential cell-cell interactions between two cell types and their ligand-receptor pairs for different disease states
LigandReceptorLRpairPathwayTissueDisease Stage
Page: 1 

Top

Single-cell gene regulatory network inference analysis

check buttonFind out the significant the regulons (TFs) and the target genes of each regulon across cell types for different disease states
TFCell TypeTissueDisease StageTarget GeneRSSRegulon Activity
∗The dot plots of a searched regulon are shown for all cell subpopulations in each disease state of each tissue based on the regulon specific score inferred using pySCENIC and by calculating the average expression.
Page: 1 

Top

Somatic mutation of malignant transformation related genes

check buttonAnnotation of somatic variants for genes involved in malignant transformation
Hugo SymbolVariant ClassVariant ClassificationdbSNP RSHGVScHGVSpHGVSp ShortSWISSPROTBIOTYPESIFTPolyPhenTumor Sample BarcodeTissueHistologySexAgeStageTherapy TypesDrugsOutcome
REXO2SNVMissense_Mutationc.229G>Cp.Glu77Glnp.E77QQ9Y3B8protein_codingtolerated(0.18)benign(0.023)TCGA-AC-A23H-01Breastbreast invasive carcinomaFemale>=65I/IIUnknownUnknownPD
REXO2SNVMissense_Mutationrs539159879c.632N>Ap.Arg211Glnp.R211QQ9Y3B8protein_codingtolerated(0.06)benign(0.024)TCGA-BH-A0B9-01Breastbreast invasive carcinomaFemale<65I/IIChemotherapycyclophosphamideSD
REXO2insertionFrame_Shift_Insnovelc.335dupAp.Ser113GlufsTer11p.S113Efs*11Q9Y3B8protein_codingTCGA-AC-A23H-01Breastbreast invasive carcinomaFemale>=65I/IIUnknownUnknownPD
REXO2SNVMissense_Mutationc.533N>Ap.Arg178Hisp.R178HQ9Y3B8protein_codingdeleterious(0)probably_damaging(0.984)TCGA-AZ-6601-01Colorectumcolon adenocarcinomaMale>=65I/IIUnknownUnknownPD
REXO2insertionFrame_Shift_Insnovelc.648_649insAp.Ile219AsnfsTer3p.I219Nfs*3Q9Y3B8protein_codingTCGA-CK-6746-01Colorectumcolon adenocarcinomaFemale>=65I/IIUnknownUnknownSD
REXO2SNVMissense_Mutationnovelc.177N>Tp.Gln59Hisp.Q59HQ9Y3B8protein_codingtolerated(0.67)benign(0.001)TCGA-A5-A0G2-01Endometriumuterine corpus endometrioid carcinomaFemale<65III/IVUnknownUnknownSD
REXO2SNVMissense_Mutationnovelc.34N>Tp.Arg12Trpp.R12WQ9Y3B8protein_codingdeleterious_low_confidence(0)benign(0.097)TCGA-A5-A2K5-01Endometriumuterine corpus endometrioid carcinomaFemale>=65I/IIUnknownUnknownSD
REXO2SNVMissense_Mutationnovelc.377N>Tp.Ser126Phep.S126FQ9Y3B8protein_codingdeleterious(0)probably_damaging(0.915)TCGA-B5-A11E-01Endometriumuterine corpus endometrioid carcinomaFemale<65I/IIUnknownUnknownSD
REXO2SNVMissense_Mutationrs539159879c.632G>Ap.Arg211Glnp.R211QQ9Y3B8protein_codingtolerated(0.06)benign(0.024)TCGA-D1-A103-01Endometriumuterine corpus endometrioid carcinomaFemale>=65I/IIUnknownUnknownSD
REXO2SNVMissense_Mutationc.605N>Gp.Glu202Glyp.E202GQ9Y3B8protein_codingdeleterious(0)probably_damaging(0.994)TCGA-D1-A15X-01Endometriumuterine corpus endometrioid carcinomaFemale<65I/IIUnknownUnknownSD
Page: 1 2 

Top

Related drugs of malignant transformation related genes

check buttonIdentification of chemicals and drugs interact with genes involved in malignant transfromation
(DGIdb 4.0)
Entrez IDSymbolCategoryInteraction TypesDrug Claim NameDrug NamePMIDs
Page: 1