
|
|||||
|
 | |
| |
| |
| |
| |
| |
|
Gene: REV3L |
Gene summary for REV3L |
| Gene information | Species | Human | Gene symbol | REV3L | Gene ID | 5980 |
| Gene name | REV3 like, DNA directed polymerase zeta catalytic subunit | |
| Gene Alias | POLZ | |
| Cytomap | 6q21 | |
| Gene Type | protein-coding | GO ID | GO:0000724 | UniProtAcc | O60673 |
Top |
Malignant transformation analysis |
| Identification of the aberrant gene expression in precancerous and cancerous lesions by comparing the gene expression of stem-like cells in diseased tissues with normal stem cells |
| Entrez ID | Symbol | Replicates | Species | Organ | Tissue | Adj P-value | Log2FC | Malignancy |
| 5980 | REV3L | CCI_2 | Human | Cervix | CC | 2.30e-06 | 9.43e-01 | 0.5249 |
| 5980 | REV3L | HTA11_3410_2000001011 | Human | Colorectum | AD | 4.04e-18 | -5.78e-01 | 0.0155 |
| 5980 | REV3L | HTA11_2487_2000001011 | Human | Colorectum | SER | 4.29e-06 | -5.47e-01 | -0.1808 |
| 5980 | REV3L | HTA11_3361_2000001011 | Human | Colorectum | AD | 8.05e-11 | -7.16e-01 | -0.1207 |
| 5980 | REV3L | HTA11_696_2000001011 | Human | Colorectum | AD | 1.64e-11 | -4.19e-01 | -0.1464 |
| 5980 | REV3L | HTA11_866_2000001011 | Human | Colorectum | AD | 5.30e-04 | -3.43e-01 | -0.1001 |
| 5980 | REV3L | HTA11_2992_2000001011 | Human | Colorectum | SER | 1.53e-03 | -5.60e-01 | -0.1706 |
| 5980 | REV3L | HTA11_5212_2000001011 | Human | Colorectum | AD | 3.18e-03 | -5.88e-01 | -0.2061 |
| 5980 | REV3L | HTA11_866_3004761011 | Human | Colorectum | AD | 1.80e-07 | -4.77e-01 | 0.096 |
| 5980 | REV3L | HTA11_9408_2000001011 | Human | Colorectum | AD | 4.65e-05 | -4.53e-01 | 0.0451 |
| 5980 | REV3L | HTA11_10711_2000001011 | Human | Colorectum | AD | 1.53e-04 | -4.78e-01 | 0.0338 |
| 5980 | REV3L | HTA11_7696_3000711011 | Human | Colorectum | AD | 1.02e-07 | -4.57e-01 | 0.0674 |
| 5980 | REV3L | HTA11_99999970781_79442 | Human | Colorectum | MSS | 8.00e-05 | -3.37e-01 | 0.294 |
| 5980 | REV3L | HTA11_99999965062_69753 | Human | Colorectum | MSI-H | 3.56e-05 | 8.02e-01 | 0.3487 |
| 5980 | REV3L | HTA11_99999965104_69814 | Human | Colorectum | MSS | 8.41e-04 | 5.44e-01 | 0.281 |
| 5980 | REV3L | HTA11_99999971662_82457 | Human | Colorectum | MSS | 3.90e-04 | -3.17e-01 | 0.3859 |
| 5980 | REV3L | HTA11_99999973899_84307 | Human | Colorectum | MSS | 8.42e-08 | -5.60e-01 | 0.2585 |
| 5980 | REV3L | HTA11_99999974143_84620 | Human | Colorectum | MSS | 9.71e-23 | -6.60e-01 | 0.3005 |
| 5980 | REV3L | F007 | Human | Colorectum | FAP | 1.75e-03 | -2.84e-01 | 0.1176 |
| 5980 | REV3L | A001-C-207 | Human | Colorectum | FAP | 3.39e-06 | -3.85e-01 | 0.1278 |
| Page: 1 2 3 4 5 6 7 8 9 10 11 |
| Tissue | Expression Dynamics | Abbreviation |
| Cervix | 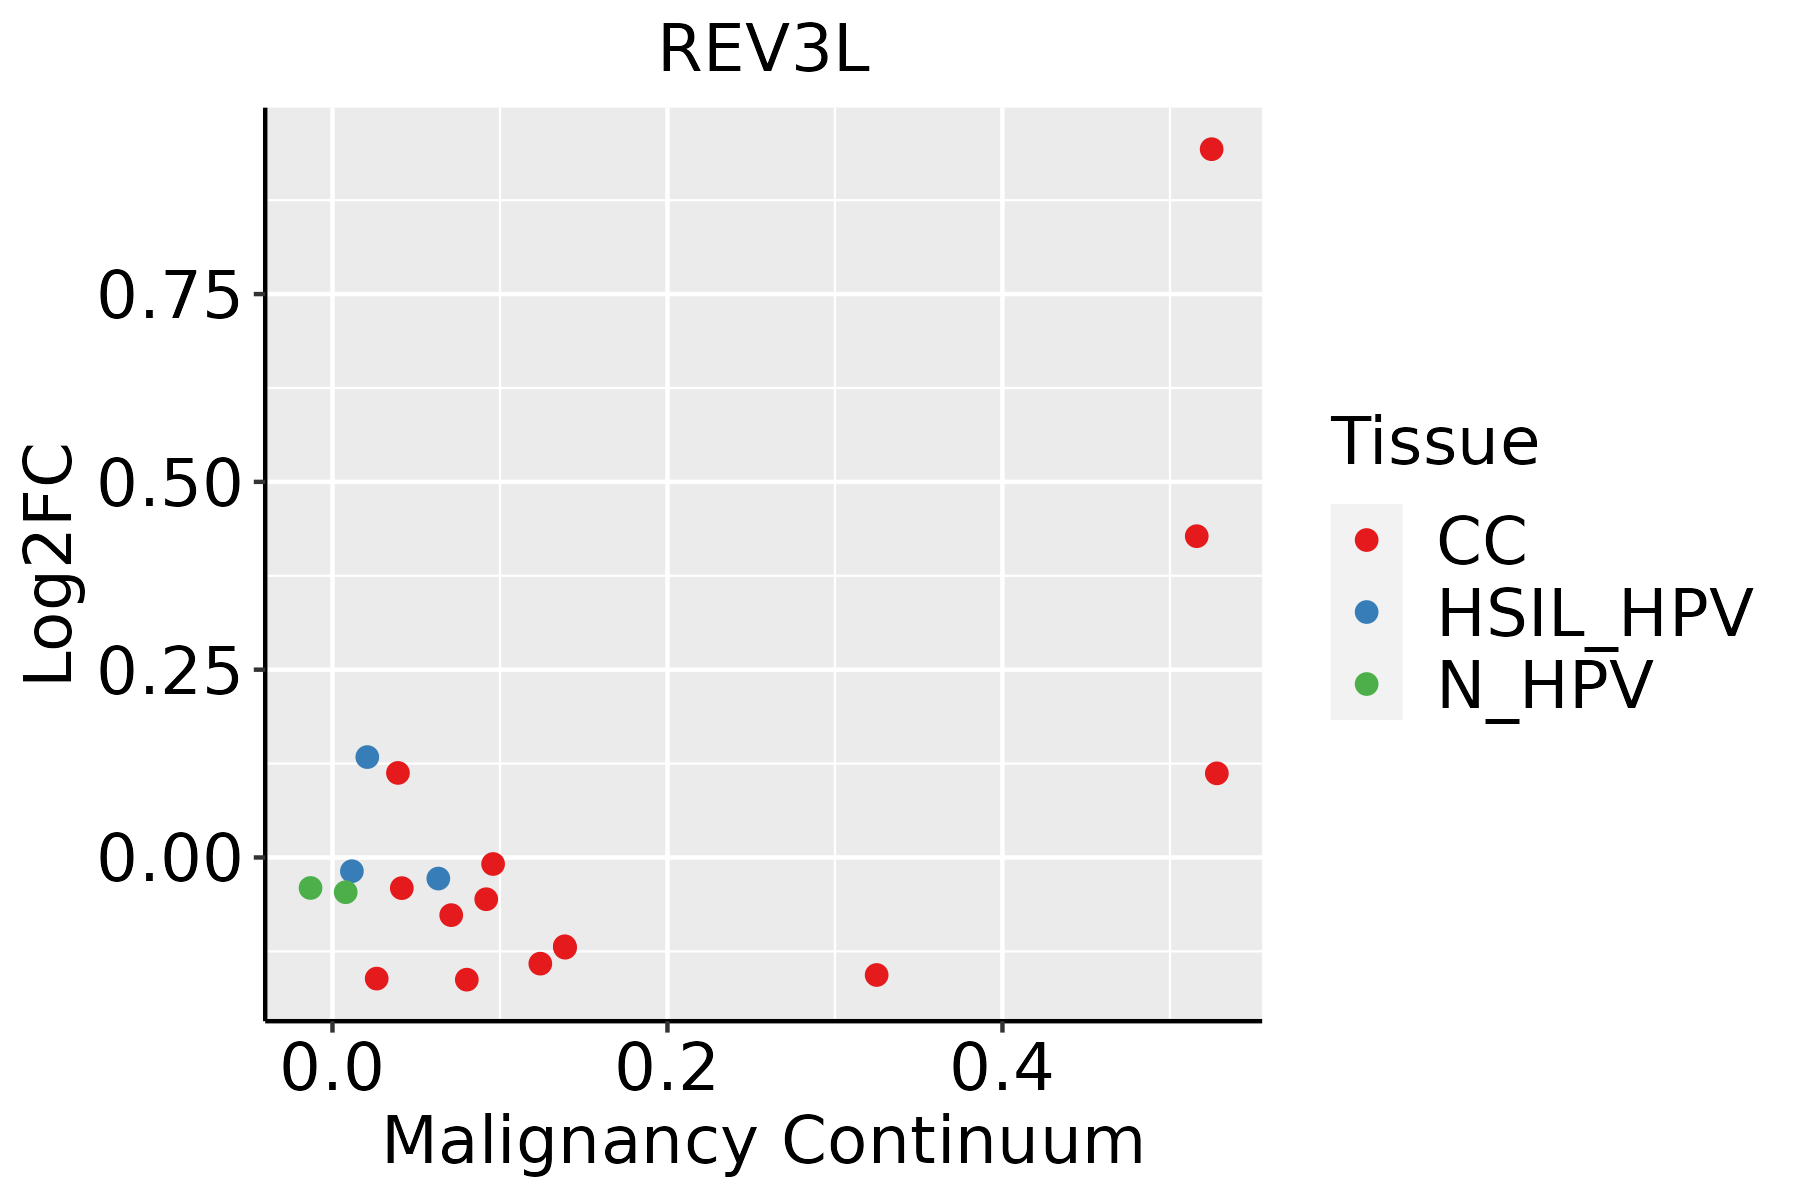 | CC: Cervix cancer |
| HSIL_HPV: HPV-infected high-grade squamous intraepithelial lesions | ||
| N_HPV: HPV-infected normal cervix | ||
| Colorectum (GSE201348) |  | FAP: Familial adenomatous polyposis |
| CRC: Colorectal cancer | ||
| Colorectum (HTA11) |  | AD: Adenomas |
| SER: Sessile serrated lesions | ||
| MSI-H: Microsatellite-high colorectal cancer | ||
| MSS: Microsatellite stable colorectal cancer | ||
| Endometrium | 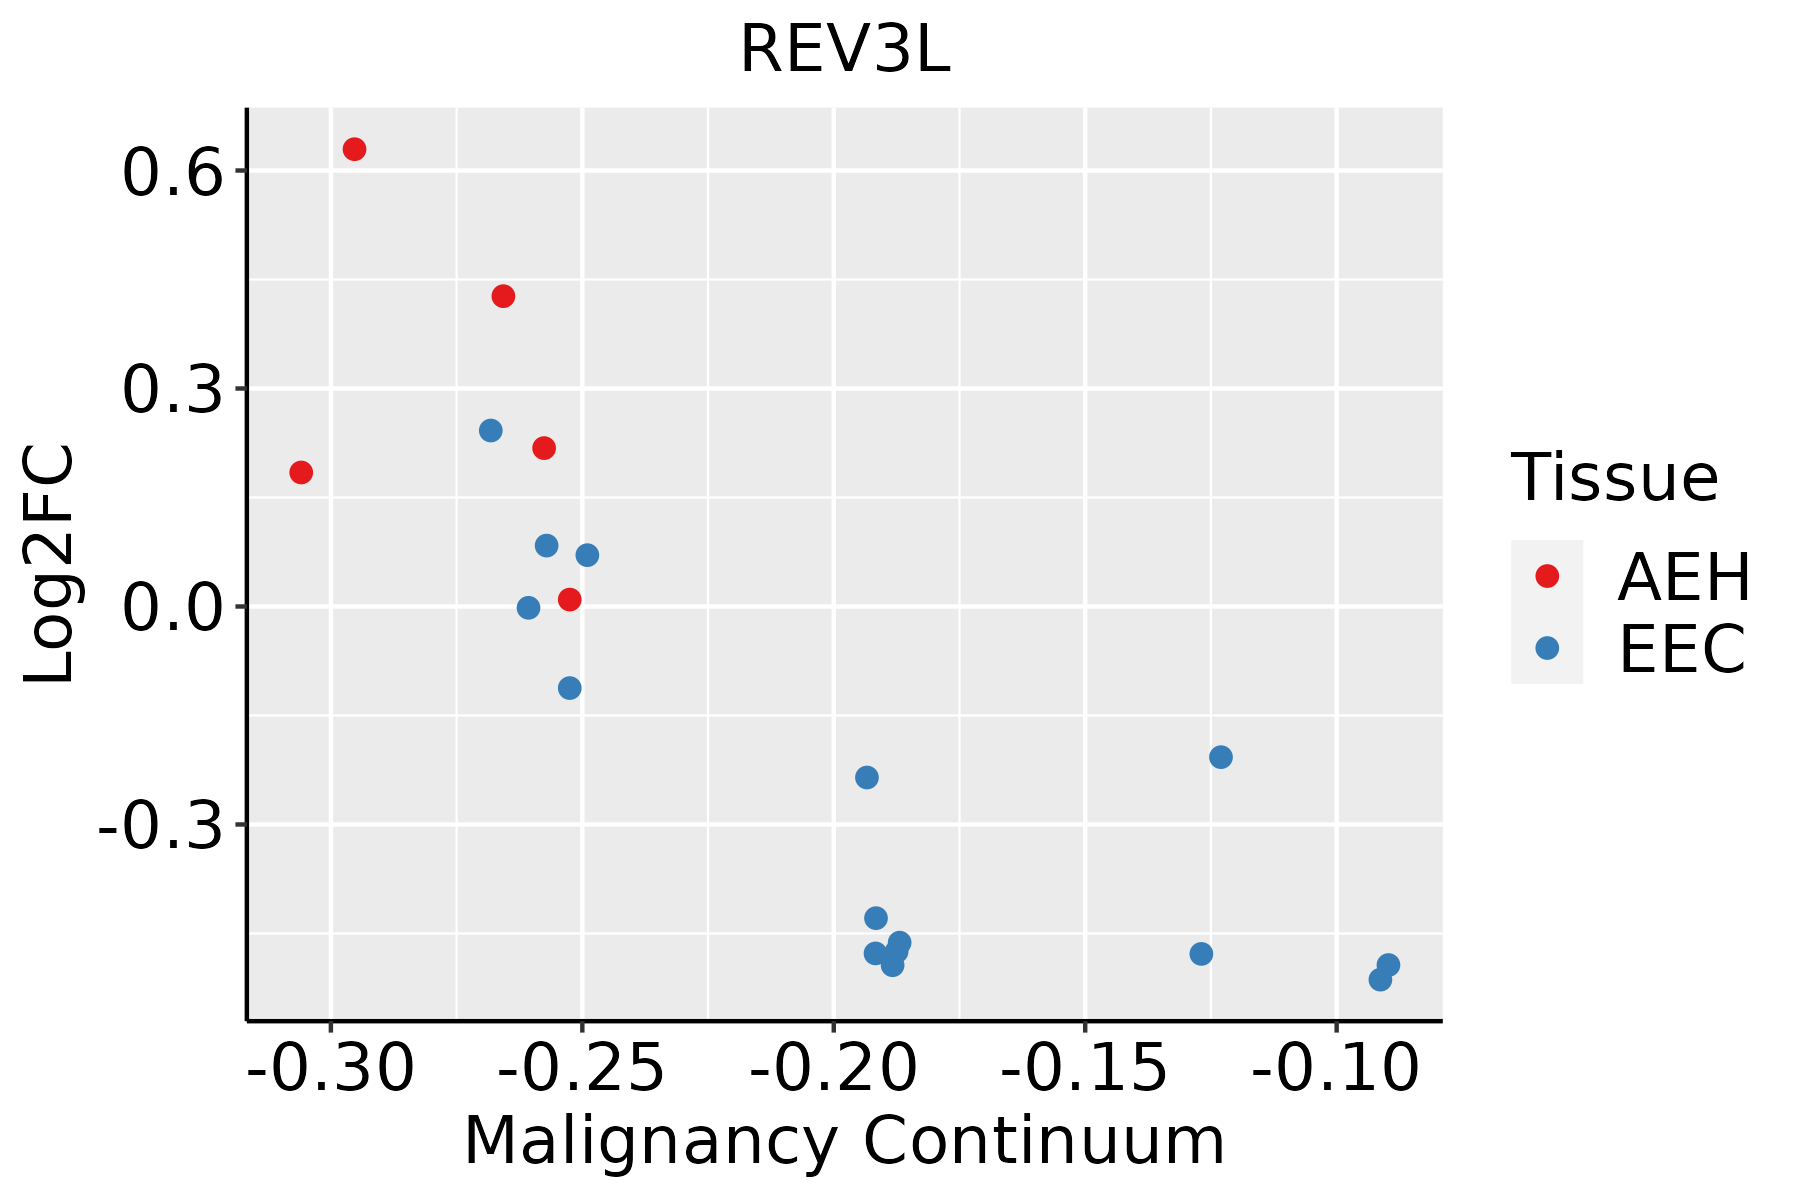 | AEH: Atypical endometrial hyperplasia |
| EEC: Endometrioid Cancer | ||
| Esophagus | 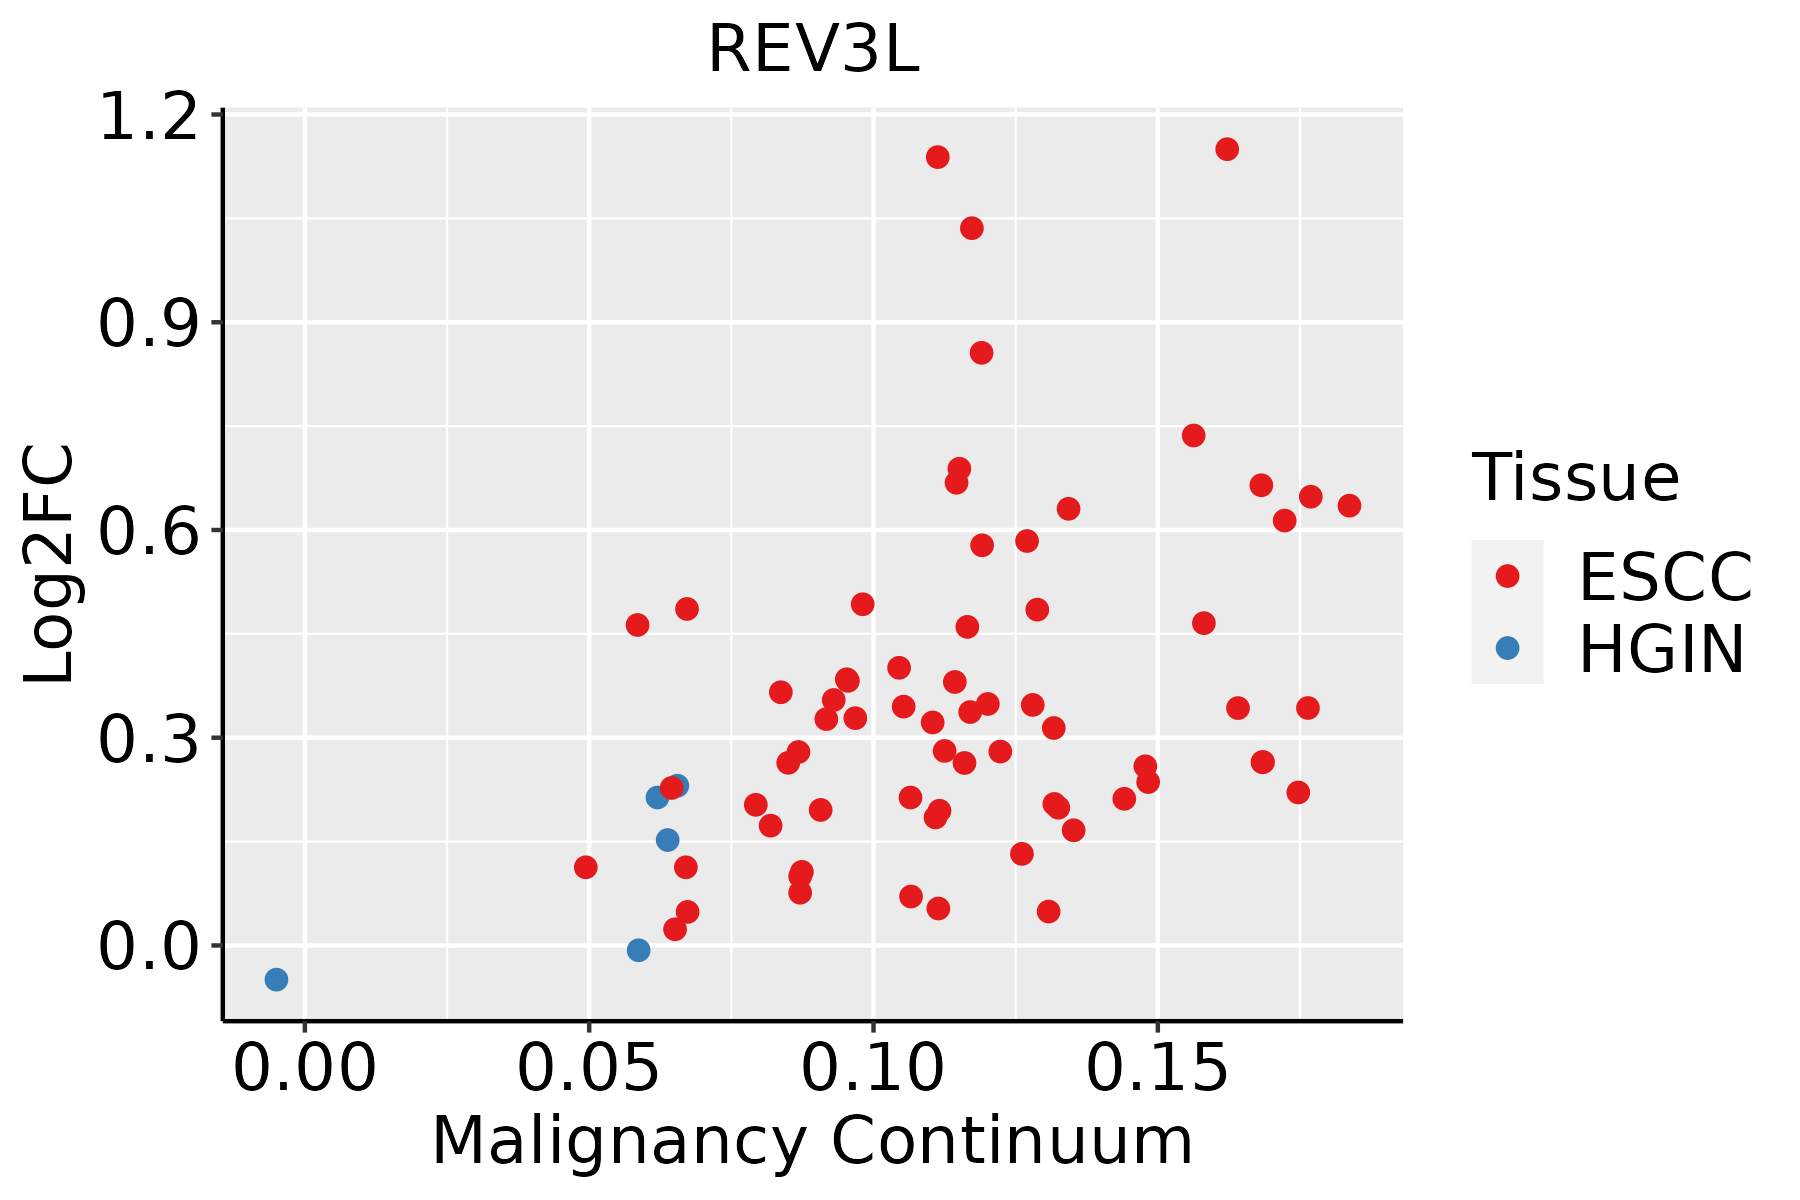 | ESCC: Esophageal squamous cell carcinoma |
| HGIN: High-grade intraepithelial neoplasias | ||
| LGIN: Low-grade intraepithelial neoplasias | ||
| Liver |  | HCC: Hepatocellular carcinoma |
| NAFLD: Non-alcoholic fatty liver disease | ||
| Lung | 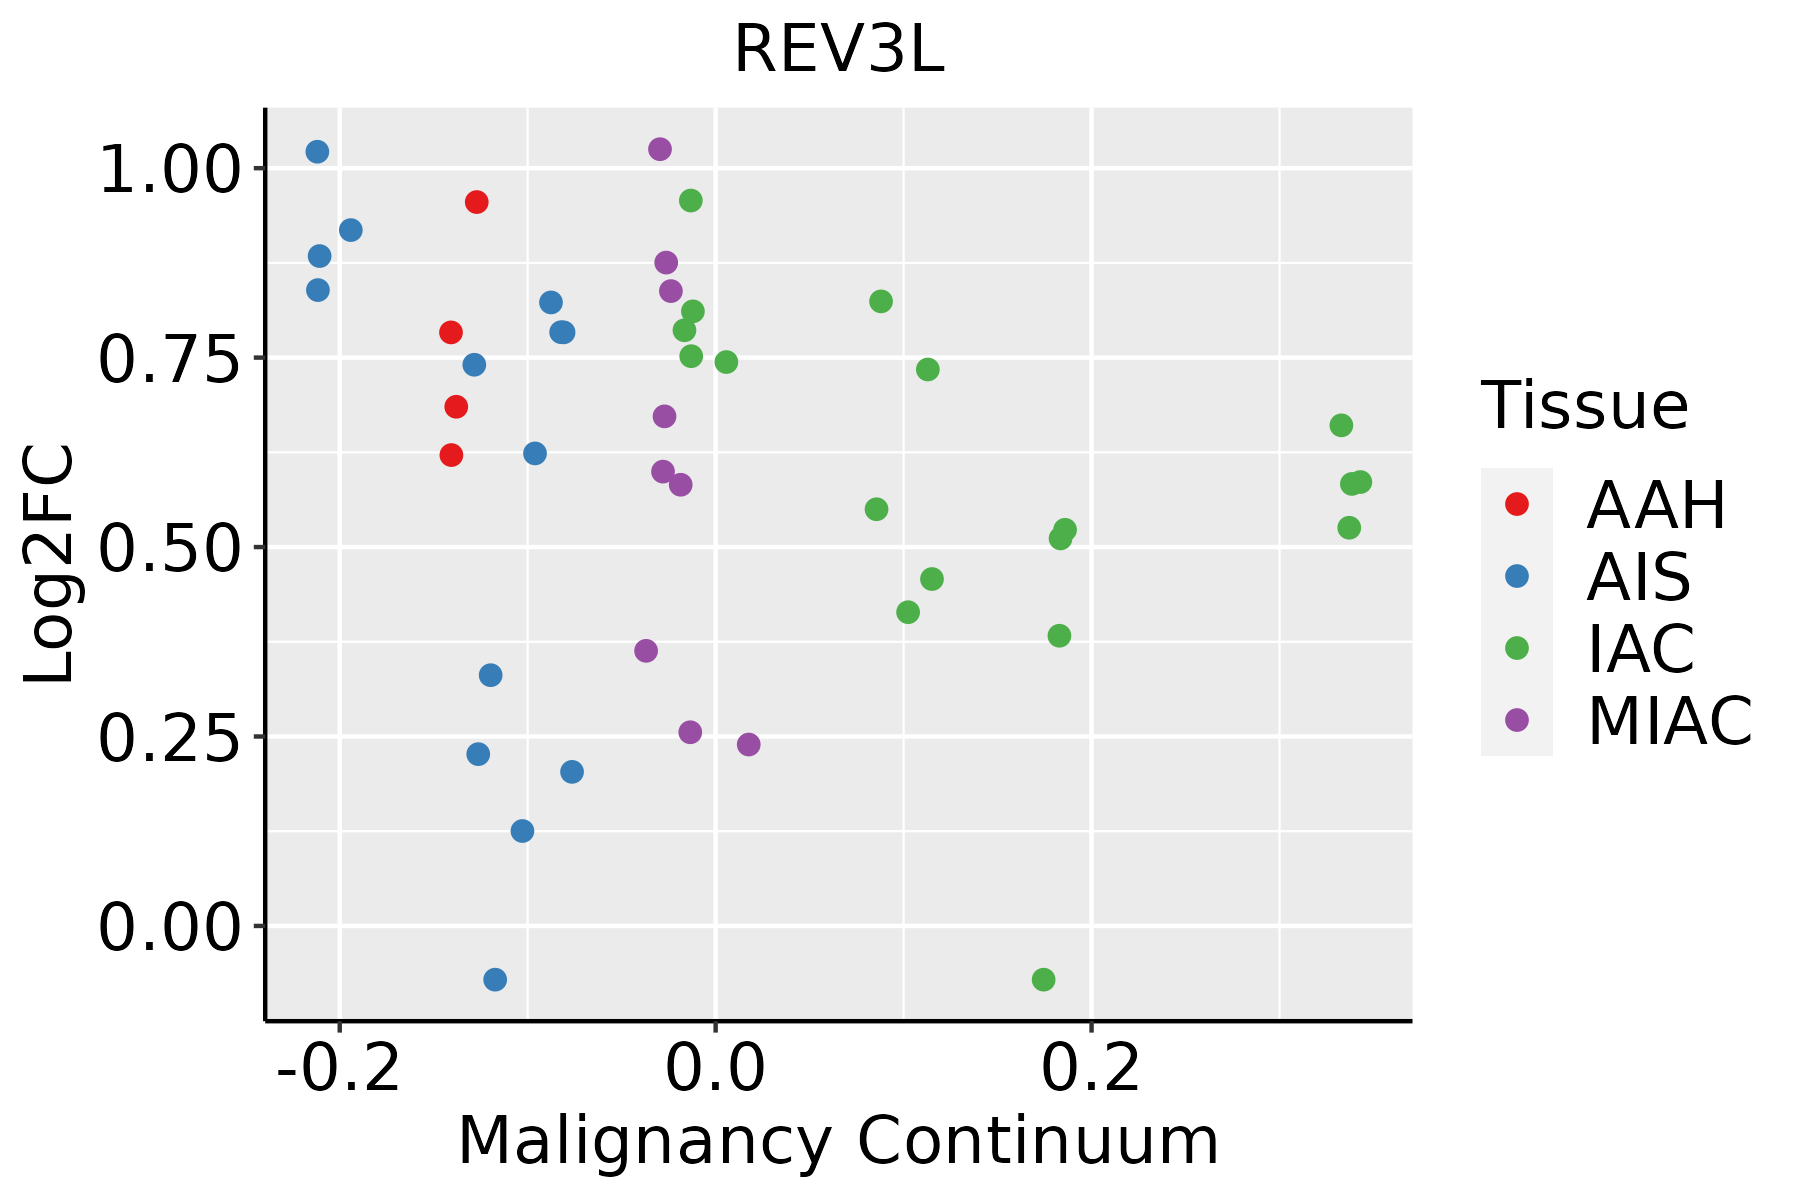 | AAH: Atypical adenomatous hyperplasia |
| AIS: Adenocarcinoma in situ | ||
| IAC: Invasive lung adenocarcinoma | ||
| MIA: Minimally invasive adenocarcinoma | ||
| Oral Cavity |  | EOLP: Erosive Oral lichen planus |
| LP: leukoplakia | ||
| NEOLP: Non-erosive oral lichen planus | ||
| OSCC: Oral squamous cell carcinoma | ||
| Prostate | 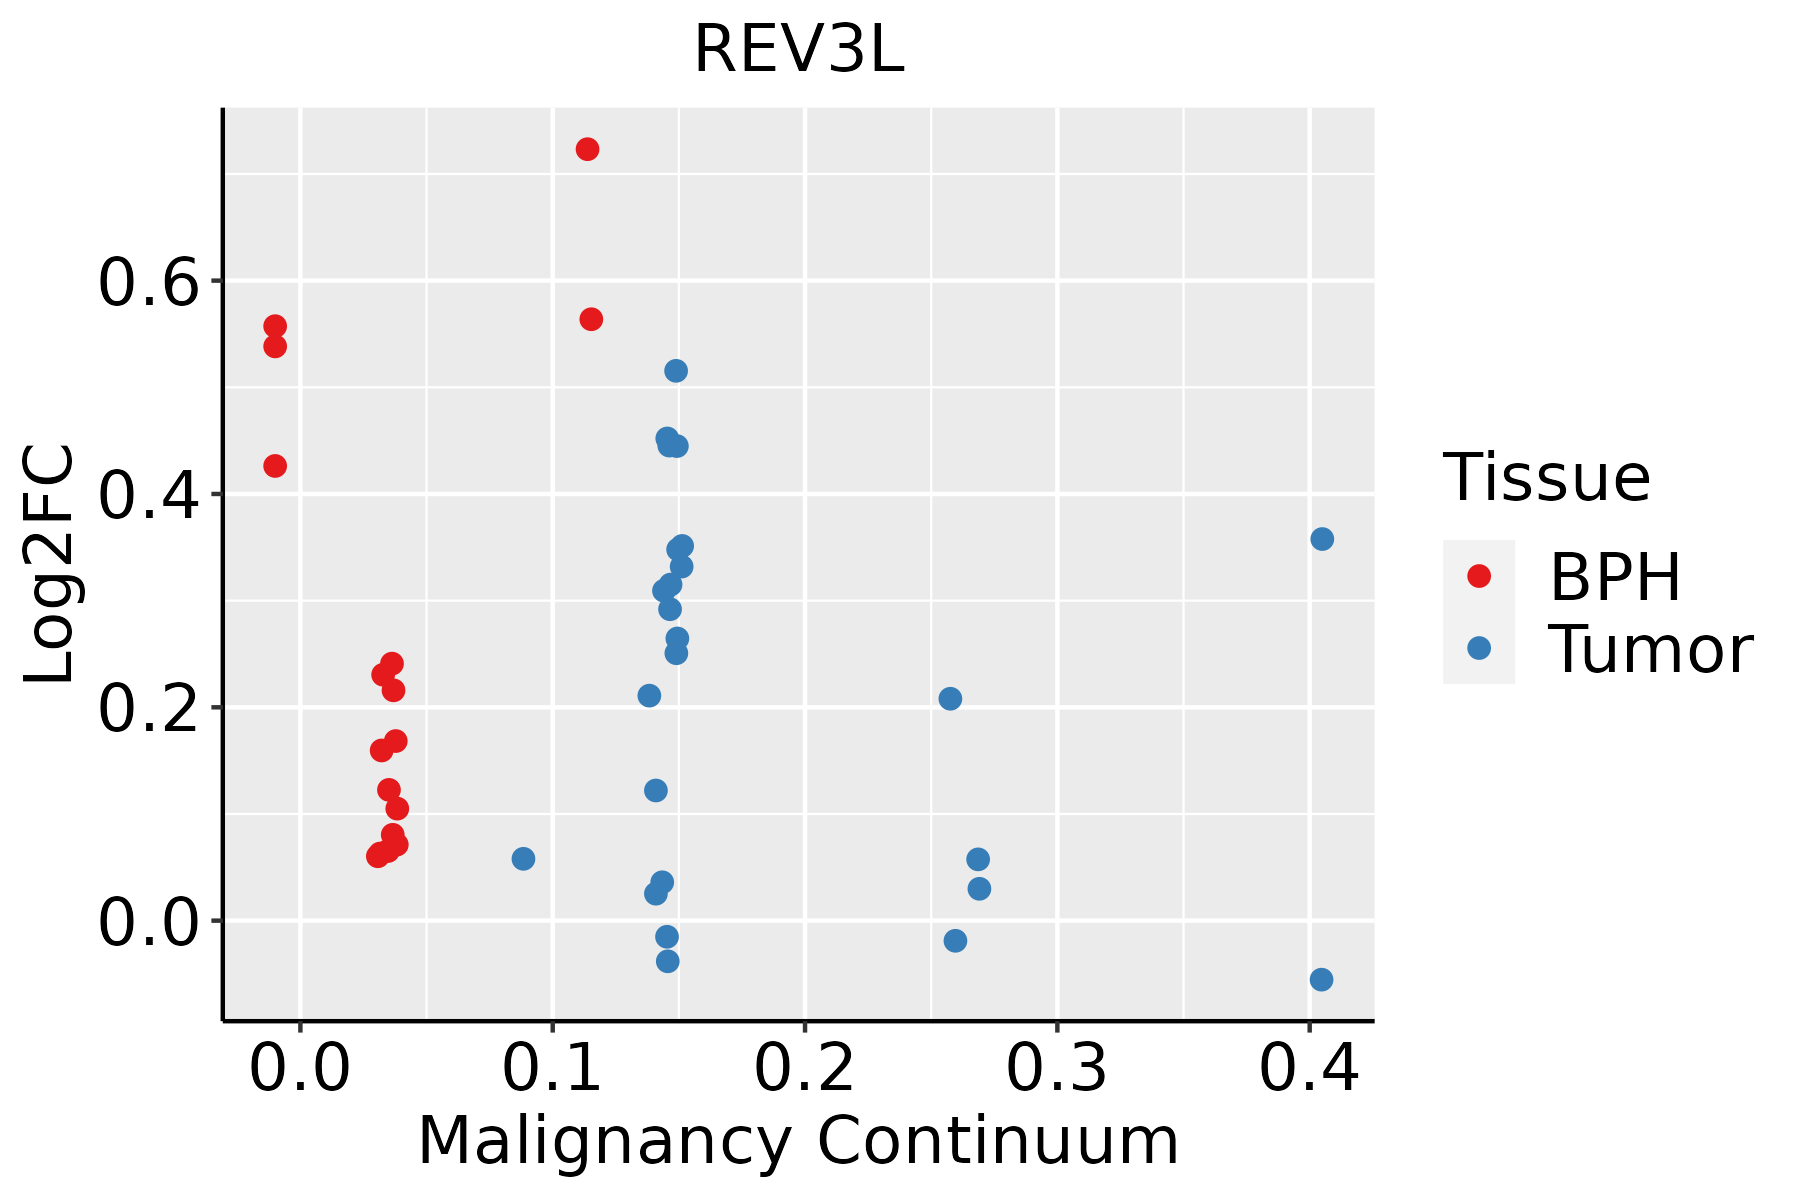 | BPH: Benign Prostatic Hyperplasia |
| Thyroid |  | ATC: Anaplastic thyroid cancer |
| HT: Hashimoto's thyroiditis | ||
| PTC: Papillary thyroid cancer |
| ∗log2FC in expression of this searched gene in stem-like cells from each diseased tissue sample relative to stem-like cells in normal samples in each tissue plotted against the malignancy continuum. Samples are colored based on if they are from different disease stage. |
Top |
Malignant transformation related pathway analysis |
| Find out the enriched GO biological processes and KEGG pathways involved in transition from healthy to precancer to cancer |
| Tissue | Disease Stage | Enriched GO biological Processes |
| Colorectum | AD |  |
| Colorectum | SER |  |
| Colorectum | MSS |  |
| Colorectum | MSI-H |  |
| Colorectum | FAP |  |
| ∗Top 15 enriched GO BP terms are showed in the bar plot of each disease state in each tissue. Each row represents a significant GO biological process which is colored according to the -log10(p.adjust). |
| Page: 1 2 3 4 5 6 7 8 9 |
| GO ID | Tissue | Disease Stage | Description | Gene Ratio | Bg Ratio | pvalue | p.adjust | Count |
| GO:00062602 | Cervix | CC | DNA replication | 48/2311 | 260/18723 | 2.70e-03 | 1.85e-02 | 48 |
| GO:0071897 | Colorectum | AD | DNA biosynthetic process | 55/3918 | 180/18723 | 1.46e-03 | 1.24e-02 | 55 |
| GO:00718971 | Colorectum | SER | DNA biosynthetic process | 43/2897 | 180/18723 | 1.99e-03 | 1.98e-02 | 43 |
| GO:00718972 | Colorectum | MSS | DNA biosynthetic process | 50/3467 | 180/18723 | 1.45e-03 | 1.35e-02 | 50 |
| GO:0006302 | Colorectum | MSS | double-strand break repair | 64/3467 | 251/18723 | 3.58e-03 | 2.65e-02 | 64 |
| GO:00718973 | Colorectum | MSI-H | DNA biosynthetic process | 26/1319 | 180/18723 | 3.73e-04 | 8.56e-03 | 26 |
| GO:0006260 | Colorectum | MSI-H | DNA replication | 31/1319 | 260/18723 | 2.83e-03 | 3.63e-02 | 31 |
| GO:00718977 | Endometrium | AEH | DNA biosynthetic process | 37/2100 | 180/18723 | 1.87e-04 | 2.39e-03 | 37 |
| GO:007189713 | Endometrium | EEC | DNA biosynthetic process | 39/2168 | 180/18723 | 7.68e-05 | 1.11e-03 | 39 |
| GO:007189710 | Esophagus | HGIN | DNA biosynthetic process | 44/2587 | 180/18723 | 8.97e-05 | 1.96e-03 | 44 |
| GO:00062604 | Esophagus | ESCC | DNA replication | 181/8552 | 260/18723 | 3.55e-15 | 2.05e-13 | 181 |
| GO:007189716 | Esophagus | ESCC | DNA biosynthetic process | 127/8552 | 180/18723 | 1.04e-11 | 3.85e-10 | 127 |
| GO:00062612 | Esophagus | ESCC | DNA-dependent DNA replication | 100/8552 | 151/18723 | 2.61e-07 | 3.94e-06 | 100 |
| GO:00063024 | Esophagus | ESCC | double-strand break repair | 152/8552 | 251/18723 | 1.33e-06 | 1.62e-05 | 152 |
| GO:00063012 | Esophagus | ESCC | postreplication repair | 26/8552 | 31/18723 | 1.32e-05 | 1.21e-04 | 26 |
| GO:00063101 | Esophagus | ESCC | DNA recombination | 168/8552 | 305/18723 | 5.58e-04 | 3.05e-03 | 168 |
| GO:0019985 | Esophagus | ESCC | translesion synthesis | 17/8552 | 21/18723 | 1.03e-03 | 5.19e-03 | 17 |
| GO:00007241 | Esophagus | ESCC | double-strand break repair via homologous recombination | 79/8552 | 138/18723 | 4.05e-03 | 1.62e-02 | 79 |
| GO:00007251 | Esophagus | ESCC | recombinational repair | 80/8552 | 140/18723 | 4.10e-03 | 1.63e-02 | 80 |
| GO:0006301 | Liver | Cirrhotic | postreplication repair | 15/4634 | 31/18723 | 3.68e-03 | 2.02e-02 | 15 |
| Page: 1 2 3 |
| Pathway ID | Tissue | Disease Stage | Description | Gene Ratio | Bg Ratio | pvalue | p.adjust | qvalue | Count |
| hsa01524 | Colorectum | MSS | Platinum drug resistance | 25/1875 | 73/8465 | 1.17e-02 | 3.99e-02 | 2.44e-02 | 25 |
| hsa015241 | Colorectum | MSS | Platinum drug resistance | 25/1875 | 73/8465 | 1.17e-02 | 3.99e-02 | 2.44e-02 | 25 |
| hsa015247 | Esophagus | ESCC | Platinum drug resistance | 56/4205 | 73/8465 | 1.85e-06 | 1.13e-05 | 5.78e-06 | 56 |
| hsa0152414 | Esophagus | ESCC | Platinum drug resistance | 56/4205 | 73/8465 | 1.85e-06 | 1.13e-05 | 5.78e-06 | 56 |
| hsa015244 | Liver | Cirrhotic | Platinum drug resistance | 34/2530 | 73/8465 | 1.86e-03 | 8.37e-03 | 5.16e-03 | 34 |
| hsa0152411 | Liver | Cirrhotic | Platinum drug resistance | 34/2530 | 73/8465 | 1.86e-03 | 8.37e-03 | 5.16e-03 | 34 |
| hsa015242 | Liver | HCC | Platinum drug resistance | 52/4020 | 73/8465 | 3.14e-05 | 1.88e-04 | 1.04e-04 | 52 |
| hsa015243 | Liver | HCC | Platinum drug resistance | 52/4020 | 73/8465 | 3.14e-05 | 1.88e-04 | 1.04e-04 | 52 |
| hsa015246 | Oral cavity | OSCC | Platinum drug resistance | 51/3704 | 73/8465 | 5.41e-06 | 2.75e-05 | 1.40e-05 | 51 |
| hsa0152413 | Oral cavity | OSCC | Platinum drug resistance | 51/3704 | 73/8465 | 5.41e-06 | 2.75e-05 | 1.40e-05 | 51 |
| hsa0152422 | Oral cavity | EOLP | Platinum drug resistance | 18/1218 | 73/8465 | 1.35e-02 | 3.53e-02 | 2.08e-02 | 18 |
| hsa0152432 | Oral cavity | EOLP | Platinum drug resistance | 18/1218 | 73/8465 | 1.35e-02 | 3.53e-02 | 2.08e-02 | 18 |
| hsa015245 | Prostate | BPH | Platinum drug resistance | 24/1718 | 73/8465 | 7.78e-03 | 2.49e-02 | 1.54e-02 | 24 |
| hsa0152412 | Prostate | BPH | Platinum drug resistance | 24/1718 | 73/8465 | 7.78e-03 | 2.49e-02 | 1.54e-02 | 24 |
| hsa0152421 | Prostate | Tumor | Platinum drug resistance | 25/1791 | 73/8465 | 6.47e-03 | 2.16e-02 | 1.34e-02 | 25 |
| hsa0152431 | Prostate | Tumor | Platinum drug resistance | 25/1791 | 73/8465 | 6.47e-03 | 2.16e-02 | 1.34e-02 | 25 |
| Page: 1 |
Top |
Cell-cell communication analysis |
| Identification of potential cell-cell interactions between two cell types and their ligand-receptor pairs for different disease states |
| Ligand | Receptor | LRpair | Pathway | Tissue | Disease Stage |
| Page: 1 |
Top |
Single-cell gene regulatory network inference analysis |
| Find out the significant the regulons (TFs) and the target genes of each regulon across cell types for different disease states |
| TF | Cell Type | Tissue | Disease Stage | Target Gene | RSS | Regulon Activity |
| ∗The dot plots of a searched regulon are shown for all cell subpopulations in each disease state of each tissue based on the regulon specific score inferred using pySCENIC and by calculating the average expression. |
| Page: 1 |
Top |
Somatic mutation of malignant transformation related genes |
| Annotation of somatic variants for genes involved in malignant transformation |
| Hugo Symbol | Variant Class | Variant Classification | dbSNP RS | HGVSc | HGVSp | HGVSp Short | SWISSPROT | BIOTYPE | SIFT | PolyPhen | Tumor Sample Barcode | Tissue | Histology | Sex | Age | Stage | Therapy Types | Drugs | Outcome |
| REV3L | SNV | Missense_Mutation | c.2407N>T | p.Val803Phe | p.V803F | O60673 | protein_coding | deleterious(0) | probably_damaging(0.916) | TCGA-A8-A0A4-01 | Breast | breast invasive carcinoma | Female | >=65 | I/II | Hormone Therapy | tamoxiphen | CR | |
| REV3L | SNV | Missense_Mutation | c.4492G>A | p.Glu1498Lys | p.E1498K | O60673 | protein_coding | deleterious_low_confidence(0.01) | benign(0.197) | TCGA-AC-A23H-01 | Breast | breast invasive carcinoma | Female | >=65 | I/II | Unknown | Unknown | PD | |
| REV3L | SNV | Missense_Mutation | c.3224C>T | p.Ser1075Phe | p.S1075F | O60673 | protein_coding | deleterious(0.04) | benign(0.269) | TCGA-AC-A23H-01 | Breast | breast invasive carcinoma | Female | >=65 | I/II | Unknown | Unknown | PD | |
| REV3L | SNV | Missense_Mutation | c.6729N>T | p.Arg2243Ser | p.R2243S | O60673 | protein_coding | deleterious(0) | benign(0.342) | TCGA-AC-A2FG-01 | Breast | breast invasive carcinoma | Female | >=65 | I/II | Hormone Therapy | arimidex | CR | |
| REV3L | SNV | Missense_Mutation | rs763651116 | c.5618G>A | p.Arg1873Gln | p.R1873Q | O60673 | protein_coding | deleterious(0.02) | possibly_damaging(0.815) | TCGA-AN-A046-01 | Breast | breast invasive carcinoma | Female | >=65 | I/II | Unknown | Unknown | SD |
| REV3L | SNV | Missense_Mutation | novel | c.2570T>G | p.Phe857Cys | p.F857C | O60673 | protein_coding | tolerated(0.19) | benign(0) | TCGA-AN-A046-01 | Breast | breast invasive carcinoma | Female | >=65 | I/II | Unknown | Unknown | SD |
| REV3L | SNV | Missense_Mutation | c.4311N>T | p.Lys1437Asn | p.K1437N | O60673 | protein_coding | deleterious_low_confidence(0.01) | probably_damaging(0.994) | TCGA-AN-A0AK-01 | Breast | breast invasive carcinoma | Female | >=65 | I/II | Unknown | Unknown | SD | |
| REV3L | SNV | Missense_Mutation | c.1337N>T | p.Pro446Leu | p.P446L | O60673 | protein_coding | tolerated(0.66) | benign(0) | TCGA-AN-A0FF-01 | Breast | breast invasive carcinoma | Female | <65 | I/II | Unknown | Unknown | SD | |
| REV3L | SNV | Missense_Mutation | c.4574C>G | p.Ser1525Cys | p.S1525C | O60673 | protein_coding | deleterious(0) | probably_damaging(0.997) | TCGA-AR-A24H-01 | Breast | breast invasive carcinoma | Female | >=65 | I/II | Hormone Therapy | tamoxiphen | SD | |
| REV3L | SNV | Missense_Mutation | novel | c.7634N>C | p.Arg2545Thr | p.R2545T | O60673 | protein_coding | deleterious(0.01) | probably_damaging(0.989) | TCGA-B6-A0X1-01 | Breast | breast invasive carcinoma | Female | <65 | I/II | Unknown | Unknown | PD |
| Page: 1 2 3 4 5 6 7 8 9 10 11 12 13 14 15 16 17 18 19 20 21 22 23 24 25 26 27 28 29 30 31 32 33 34 35 36 |
Top |
Related drugs of malignant transformation related genes |
| Identification of chemicals and drugs interact with genes involved in malignant transfromation |
| (DGIdb 4.0) |
| Entrez ID | Symbol | Category | Interaction Types | Drug Claim Name | Drug Name | PMIDs |
| 5980 | REV3L | DRUGGABLE GENOME, DNA DIRECTED RNA POLYMERASE | fluorouracil | FLUOROURACIL | ||
| 5980 | REV3L | DRUGGABLE GENOME, DNA DIRECTED RNA POLYMERASE | cisplatin | CISPLATIN | ||
| 5980 | REV3L | DRUGGABLE GENOME, DNA DIRECTED RNA POLYMERASE | capecitabine | CAPECITABINE |
| Page: 1 |

Copyright 2023-Present -The University of Texas Health Science Center at Houston |