
|
|||||
|
 | |
| |
| |
| |
| |
| |
|
Gene: REV1 |
Gene summary for REV1 |
| Gene information | Species | Human | Gene symbol | REV1 | Gene ID | 51455 |
| Gene name | REV1 DNA directed polymerase | |
| Gene Alias | AIBP80 | |
| Cytomap | 2q11.2 | |
| Gene Type | protein-coding | GO ID | GO:0000731 | UniProtAcc | Q9UBZ9 |
Top |
Malignant transformation analysis |
| Identification of the aberrant gene expression in precancerous and cancerous lesions by comparing the gene expression of stem-like cells in diseased tissues with normal stem cells |
| Entrez ID | Symbol | Replicates | Species | Organ | Tissue | Adj P-value | Log2FC | Malignancy |
| 51455 | REV1 | HTA11_3410_2000001011 | Human | Colorectum | AD | 7.07e-20 | -6.00e-01 | 0.0155 |
| 51455 | REV1 | HTA11_2487_2000001011 | Human | Colorectum | SER | 4.68e-08 | -4.86e-01 | -0.1808 |
| 51455 | REV1 | HTA11_3361_2000001011 | Human | Colorectum | AD | 4.07e-05 | -4.98e-01 | -0.1207 |
| 51455 | REV1 | HTA11_83_2000001011 | Human | Colorectum | SER | 4.65e-05 | -4.73e-01 | -0.1526 |
| 51455 | REV1 | HTA11_696_2000001011 | Human | Colorectum | AD | 8.26e-05 | -4.00e-01 | -0.1464 |
| 51455 | REV1 | HTA11_866_2000001011 | Human | Colorectum | AD | 2.94e-04 | -3.63e-01 | -0.1001 |
| 51455 | REV1 | HTA11_5212_2000001011 | Human | Colorectum | AD | 2.01e-02 | -4.85e-01 | -0.2061 |
| 51455 | REV1 | HTA11_546_2000001011 | Human | Colorectum | AD | 2.51e-02 | -3.97e-01 | -0.0842 |
| 51455 | REV1 | HTA11_7862_2000001011 | Human | Colorectum | AD | 4.55e-05 | -6.22e-01 | -0.0179 |
| 51455 | REV1 | HTA11_866_3004761011 | Human | Colorectum | AD | 3.81e-16 | -5.84e-01 | 0.096 |
| 51455 | REV1 | HTA11_9408_2000001011 | Human | Colorectum | AD | 4.28e-02 | -7.02e-01 | 0.0451 |
| 51455 | REV1 | HTA11_8622_2000001021 | Human | Colorectum | SER | 2.91e-02 | -5.39e-01 | 0.0528 |
| 51455 | REV1 | HTA11_10623_2000001011 | Human | Colorectum | AD | 1.51e-02 | -4.99e-01 | -0.0177 |
| 51455 | REV1 | HTA11_10711_2000001011 | Human | Colorectum | AD | 2.07e-03 | -4.07e-01 | 0.0338 |
| 51455 | REV1 | HTA11_7696_3000711011 | Human | Colorectum | AD | 3.06e-16 | -4.99e-01 | 0.0674 |
| 51455 | REV1 | HTA11_6818_2000001021 | Human | Colorectum | AD | 2.69e-06 | -5.02e-01 | 0.0588 |
| 51455 | REV1 | HTA11_99999970781_79442 | Human | Colorectum | MSS | 1.28e-11 | -4.50e-01 | 0.294 |
| 51455 | REV1 | HTA11_99999971662_82457 | Human | Colorectum | MSS | 6.61e-11 | -4.72e-01 | 0.3859 |
| 51455 | REV1 | HTA11_99999973899_84307 | Human | Colorectum | MSS | 1.16e-02 | -4.75e-01 | 0.2585 |
| 51455 | REV1 | HTA11_99999974143_84620 | Human | Colorectum | MSS | 5.73e-12 | -4.84e-01 | 0.3005 |
| Page: 1 2 3 4 5 6 7 8 |
| Tissue | Expression Dynamics | Abbreviation |
| Colorectum (GSE201348) |  | FAP: Familial adenomatous polyposis |
| CRC: Colorectal cancer | ||
| Colorectum (HTA11) |  | AD: Adenomas |
| SER: Sessile serrated lesions | ||
| MSI-H: Microsatellite-high colorectal cancer | ||
| MSS: Microsatellite stable colorectal cancer | ||
| Esophagus |  | ESCC: Esophageal squamous cell carcinoma |
| HGIN: High-grade intraepithelial neoplasias | ||
| LGIN: Low-grade intraepithelial neoplasias | ||
| Lung | 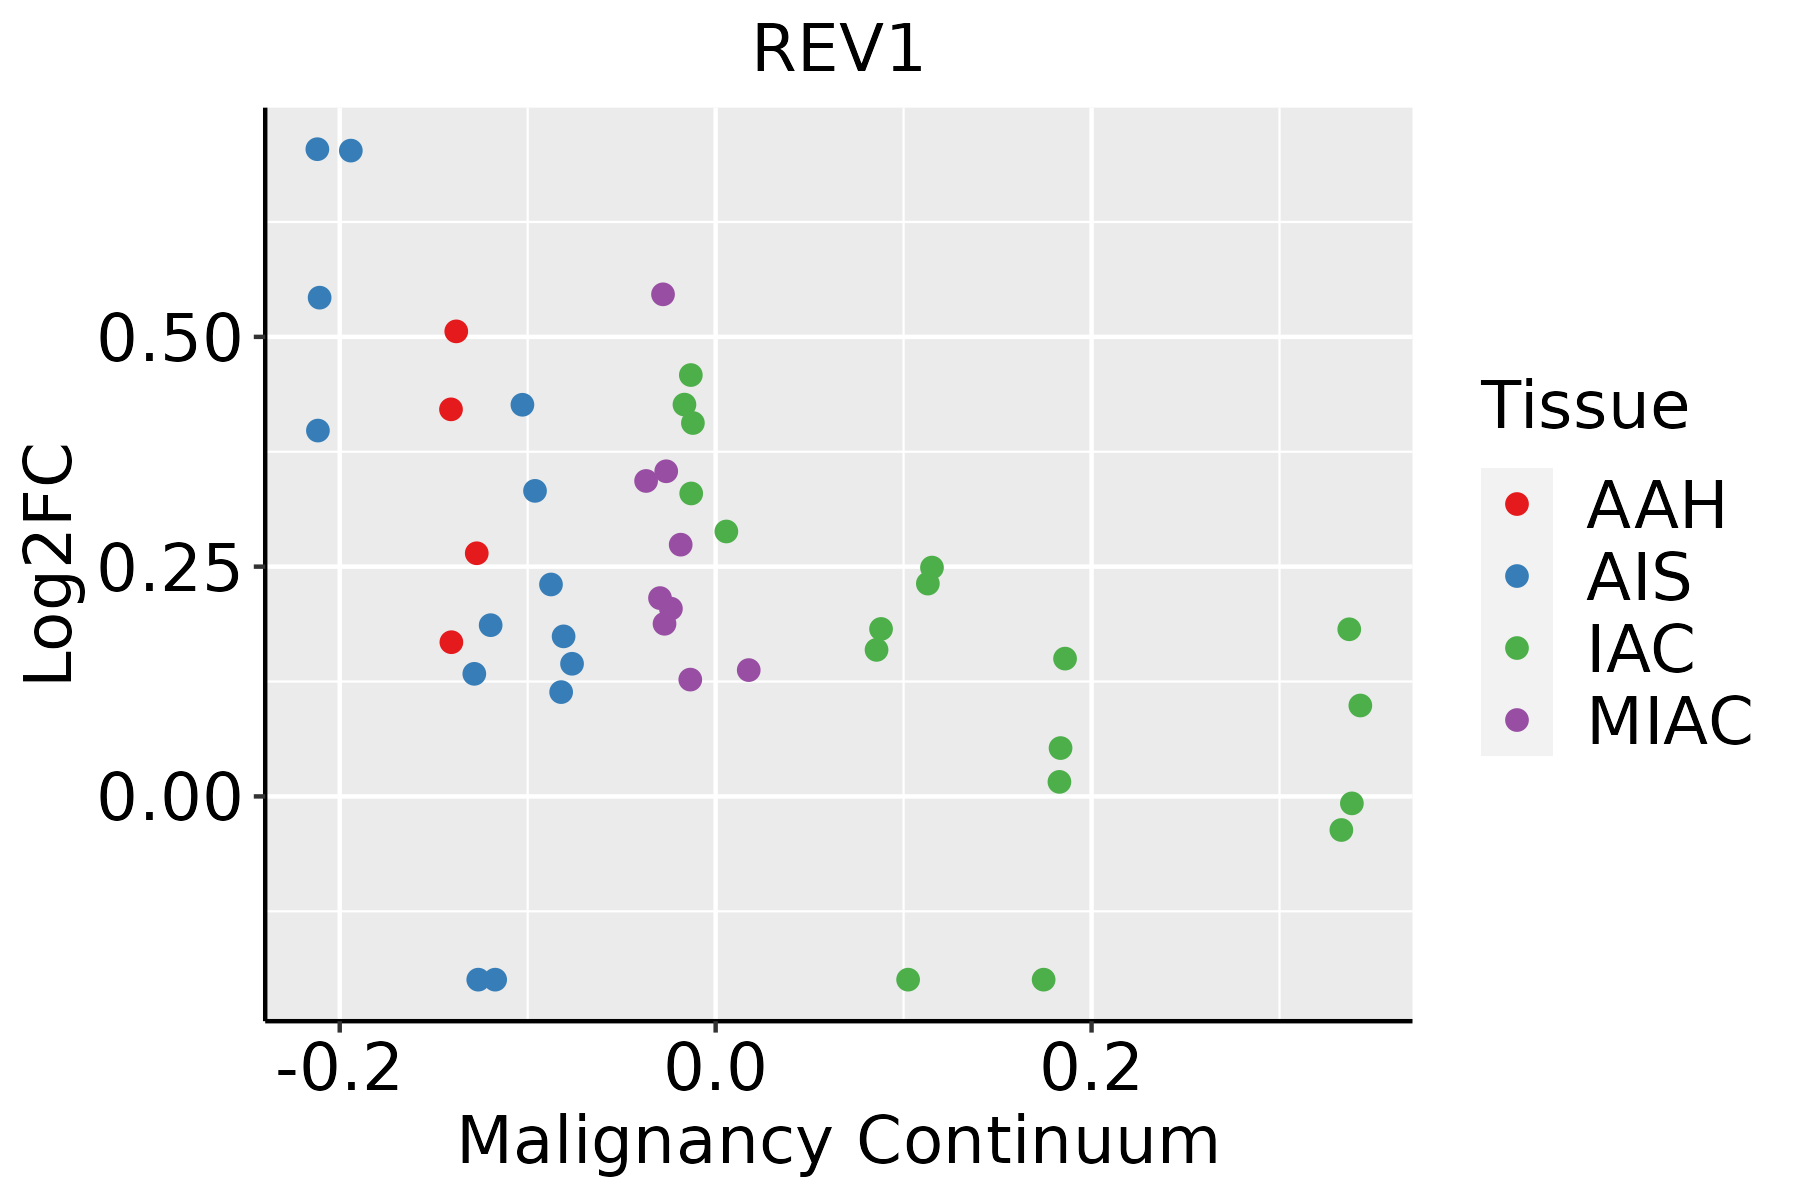 | AAH: Atypical adenomatous hyperplasia |
| AIS: Adenocarcinoma in situ | ||
| IAC: Invasive lung adenocarcinoma | ||
| MIA: Minimally invasive adenocarcinoma | ||
| Oral Cavity |  | EOLP: Erosive Oral lichen planus |
| LP: leukoplakia | ||
| NEOLP: Non-erosive oral lichen planus | ||
| OSCC: Oral squamous cell carcinoma | ||
| Skin |  | AK: Actinic keratosis |
| cSCC: Cutaneous squamous cell carcinoma | ||
| SCCIS:squamous cell carcinoma in situ | ||
| Thyroid | 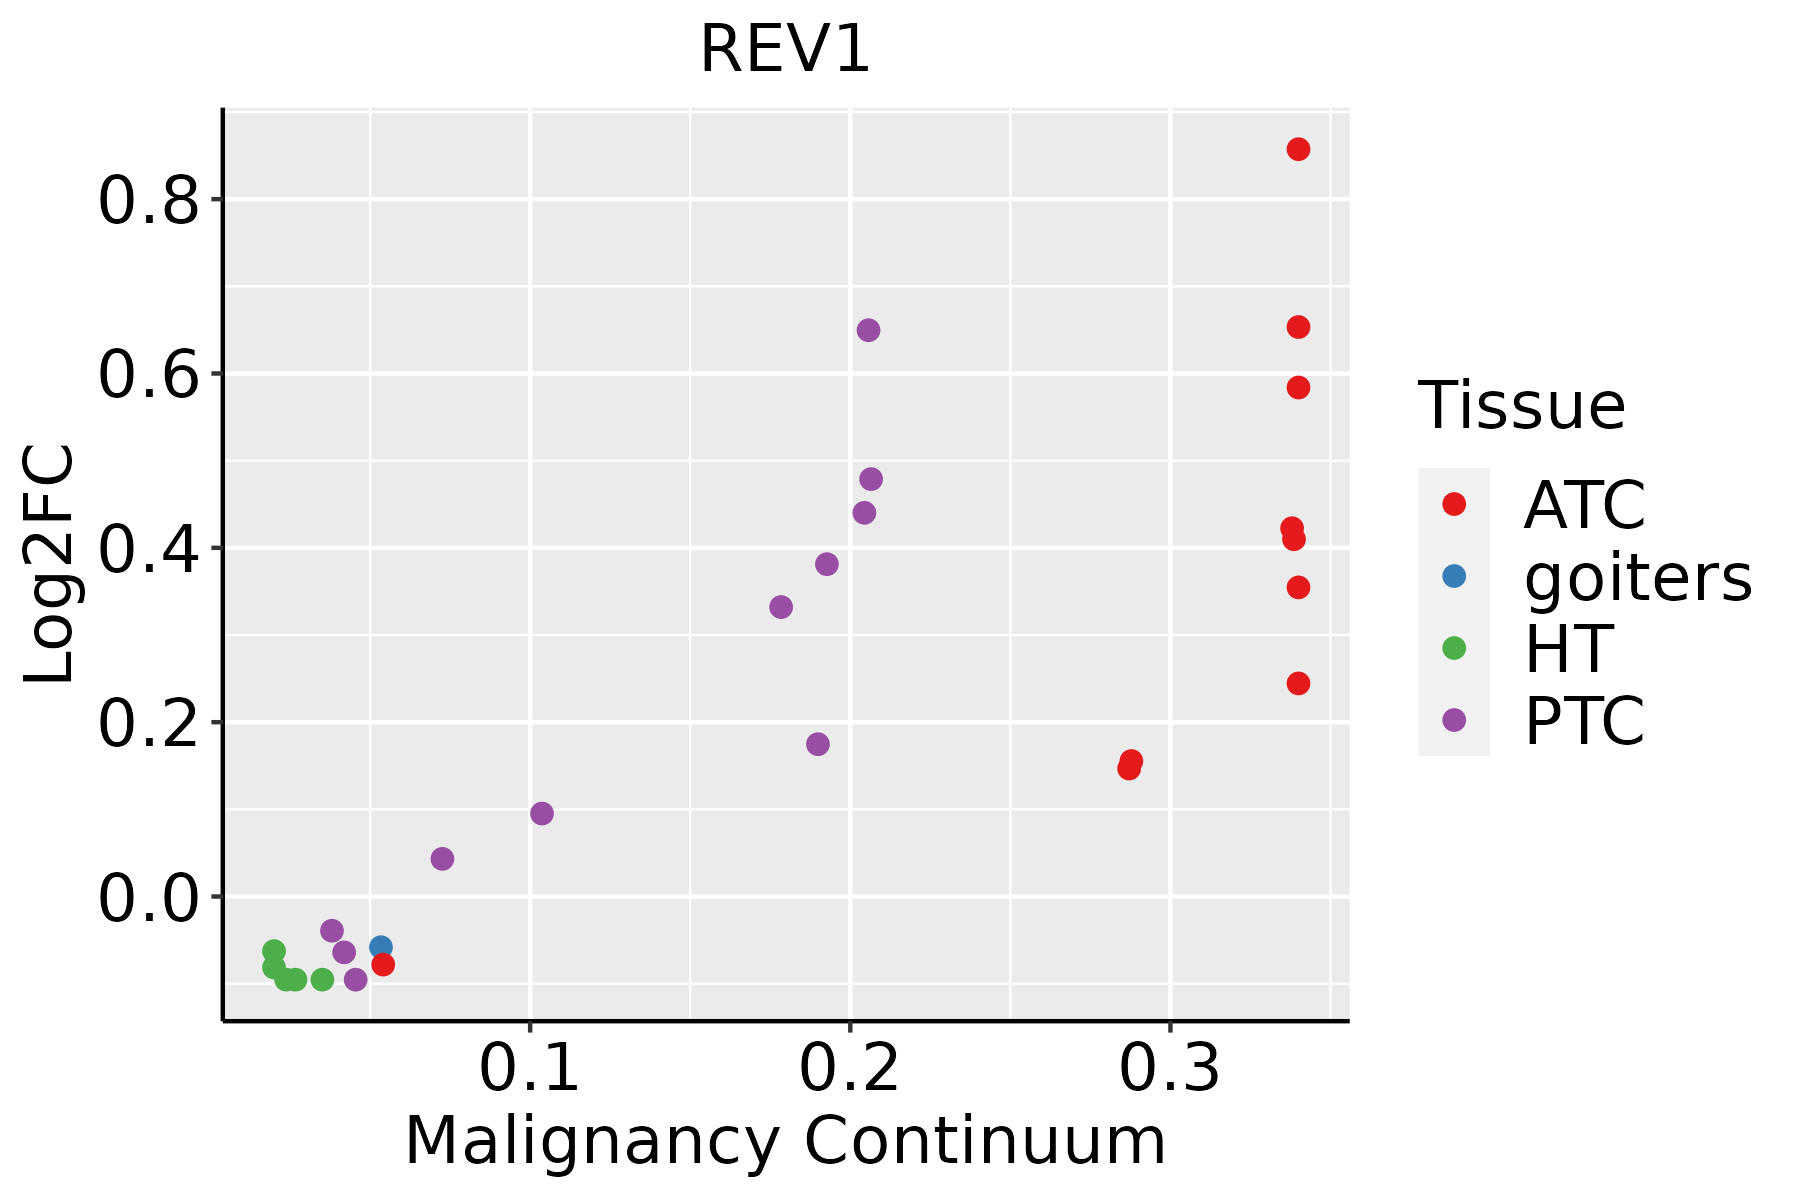 | ATC: Anaplastic thyroid cancer |
| HT: Hashimoto's thyroiditis | ||
| PTC: Papillary thyroid cancer |
| ∗log2FC in expression of this searched gene in stem-like cells from each diseased tissue sample relative to stem-like cells in normal samples in each tissue plotted against the malignancy continuum. Samples are colored based on if they are from different disease stage. |
Top |
Malignant transformation related pathway analysis |
| Find out the enriched GO biological processes and KEGG pathways involved in transition from healthy to precancer to cancer |
| Tissue | Disease Stage | Enriched GO biological Processes |
| Colorectum | AD |  |
| Colorectum | SER |  |
| Colorectum | MSS |  |
| Colorectum | MSI-H |  |
| Colorectum | FAP |  |
| ∗Top 15 enriched GO BP terms are showed in the bar plot of each disease state in each tissue. Each row represents a significant GO biological process which is colored according to the -log10(p.adjust). |
| Page: 1 2 3 4 5 6 7 8 9 |
| GO ID | Tissue | Disease Stage | Description | Gene Ratio | Bg Ratio | pvalue | p.adjust | Count |
| GO:0071897 | Colorectum | AD | DNA biosynthetic process | 55/3918 | 180/18723 | 1.46e-03 | 1.24e-02 | 55 |
| GO:00718971 | Colorectum | SER | DNA biosynthetic process | 43/2897 | 180/18723 | 1.99e-03 | 1.98e-02 | 43 |
| GO:00718972 | Colorectum | MSS | DNA biosynthetic process | 50/3467 | 180/18723 | 1.45e-03 | 1.35e-02 | 50 |
| GO:000941113 | Esophagus | ESCC | response to UV | 115/8552 | 149/18723 | 3.29e-15 | 1.93e-13 | 115 |
| GO:00062604 | Esophagus | ESCC | DNA replication | 181/8552 | 260/18723 | 3.55e-15 | 2.05e-13 | 181 |
| GO:007189716 | Esophagus | ESCC | DNA biosynthetic process | 127/8552 | 180/18723 | 1.04e-11 | 3.85e-10 | 127 |
| GO:000931419 | Esophagus | ESCC | response to radiation | 277/8552 | 456/18723 | 4.42e-11 | 1.43e-09 | 277 |
| GO:00063012 | Esophagus | ESCC | postreplication repair | 26/8552 | 31/18723 | 1.32e-05 | 1.21e-04 | 26 |
| GO:000941611 | Esophagus | ESCC | response to light stimulus | 183/8552 | 320/18723 | 2.03e-05 | 1.76e-04 | 183 |
| GO:0019985 | Esophagus | ESCC | translesion synthesis | 17/8552 | 21/18723 | 1.03e-03 | 5.19e-03 | 17 |
| GO:00093147 | Lung | IAC | response to radiation | 77/2061 | 456/18723 | 8.59e-05 | 1.74e-03 | 77 |
| GO:000931411 | Lung | AIS | response to radiation | 71/1849 | 456/18723 | 7.33e-05 | 1.91e-03 | 71 |
| GO:00094162 | Lung | AIS | response to light stimulus | 47/1849 | 320/18723 | 3.72e-03 | 3.48e-02 | 47 |
| GO:00062603 | Oral cavity | OSCC | DNA replication | 159/7305 | 260/18723 | 3.25e-13 | 1.59e-11 | 159 |
| GO:00094114 | Oral cavity | OSCC | response to UV | 99/7305 | 149/18723 | 1.01e-11 | 3.70e-10 | 99 |
| GO:000931416 | Oral cavity | OSCC | response to radiation | 241/7305 | 456/18723 | 9.76e-10 | 2.40e-08 | 241 |
| GO:00718979 | Oral cavity | OSCC | DNA biosynthetic process | 106/7305 | 180/18723 | 4.86e-08 | 8.95e-07 | 106 |
| GO:00094164 | Oral cavity | OSCC | response to light stimulus | 159/7305 | 320/18723 | 5.98e-05 | 4.92e-04 | 159 |
| GO:00063011 | Oral cavity | OSCC | postreplication repair | 20/7305 | 31/18723 | 3.57e-03 | 1.49e-02 | 20 |
| GO:000941112 | Oral cavity | LP | response to UV | 63/4623 | 149/18723 | 1.74e-06 | 4.05e-05 | 63 |
| Page: 1 2 3 |
| Pathway ID | Tissue | Disease Stage | Description | Gene Ratio | Bg Ratio | pvalue | p.adjust | qvalue | Count |
| Page: 1 |
Top |
Cell-cell communication analysis |
| Identification of potential cell-cell interactions between two cell types and their ligand-receptor pairs for different disease states |
| Ligand | Receptor | LRpair | Pathway | Tissue | Disease Stage |
| Page: 1 |
Top |
Single-cell gene regulatory network inference analysis |
| Find out the significant the regulons (TFs) and the target genes of each regulon across cell types for different disease states |
| TF | Cell Type | Tissue | Disease Stage | Target Gene | RSS | Regulon Activity |
| ∗The dot plots of a searched regulon are shown for all cell subpopulations in each disease state of each tissue based on the regulon specific score inferred using pySCENIC and by calculating the average expression. |
| Page: 1 |
Top |
Somatic mutation of malignant transformation related genes |
| Annotation of somatic variants for genes involved in malignant transformation |
| Hugo Symbol | Variant Class | Variant Classification | dbSNP RS | HGVSc | HGVSp | HGVSp Short | SWISSPROT | BIOTYPE | SIFT | PolyPhen | Tumor Sample Barcode | Tissue | Histology | Sex | Age | Stage | Therapy Types | Drugs | Outcome |
| REV1 | SNV | Missense_Mutation | c.3368N>A | p.Pro1123His | p.P1123H | Q9UBZ9 | protein_coding | tolerated(0.14) | benign(0.315) | TCGA-A8-A09Z-01 | Breast | breast invasive carcinoma | Female | >=65 | I/II | Unknown | Unknown | SD | |
| REV1 | SNV | Missense_Mutation | c.3382N>G | p.Leu1128Val | p.L1128V | Q9UBZ9 | protein_coding | tolerated(0.32) | benign(0.039) | TCGA-AO-A0JD-01 | Breast | breast invasive carcinoma | Female | <65 | III/IV | Chemotherapy | cyclophosphamide | SD | |
| REV1 | SNV | Missense_Mutation | c.2005N>A | p.Gly669Arg | p.G669R | Q9UBZ9 | protein_coding | deleterious(0) | possibly_damaging(0.844) | TCGA-BH-A0HF-01 | Breast | breast invasive carcinoma | Female | >=65 | I/II | Hormone Therapy | arimidex | SD | |
| REV1 | SNV | Missense_Mutation | c.731C>T | p.Pro244Leu | p.P244L | Q9UBZ9 | protein_coding | tolerated(0.06) | benign(0.343) | TCGA-BH-A18G-01 | Breast | breast invasive carcinoma | Female | >=65 | I/II | Unknown | Unknown | SD | |
| REV1 | SNV | Missense_Mutation | novel | c.451G>A | p.Glu151Lys | p.E151K | Q9UBZ9 | protein_coding | tolerated(0.12) | benign(0.063) | TCGA-LL-A73Y-01 | Breast | breast invasive carcinoma | Female | >=65 | I/II | Chemotherapy | taxotere | SD |
| REV1 | insertion | In_Frame_Ins | novel | c.630_631insCTGTGGTGGGCTCCACCCAGTTCGAGTTTCCGGGCTGTTTTGATT | p.Arg210_Lys211insLeuTrpTrpAlaProProSerSerSerPheArgAlaValLeuIle | p.R210_K211insLWWAPPSSSFRAVLI | Q9UBZ9 | protein_coding | TCGA-A2-A0CP-01 | Breast | breast invasive carcinoma | Female | <65 | I/II | Chemotherapy | cytoxan | SD | ||
| REV1 | insertion | Nonsense_Mutation | novel | c.517_518insTGTGATGCAGTCTTGAATGAGAAT | p.Lys173delinsMetTerCysSerLeuGluTerGluTer | p.K173delinsM*CSLE*E* | Q9UBZ9 | protein_coding | TCGA-BH-A0BA-01 | Breast | breast invasive carcinoma | Female | <65 | III/IV | Chemotherapy | cytoxan | SD | ||
| REV1 | insertion | Nonsense_Mutation | novel | c.3049_3050insTTTTGCTTCCCTGAGGTATTTGCAAAT | p.Asp1017delinsValLeuLeuProTerGlyIleCysLysTyr | p.D1017delinsVLLP*GICKY | Q9UBZ9 | protein_coding | TCGA-BH-A0WA-01 | Breast | breast invasive carcinoma | Female | >=65 | I/II | Unknown | Unknown | SD | ||
| REV1 | deletion | Frame_Shift_Del | novel | c.3128delG | p.Gly1043AlafsTer22 | p.G1043Afs*22 | Q9UBZ9 | protein_coding | TCGA-D8-A27V-01 | Breast | breast invasive carcinoma | Female | <65 | I/II | Hormone Therapy | tamoxiphen | SD | ||
| REV1 | deletion | Frame_Shift_Del | c.3235delN | p.Thr1079ProfsTer12 | p.T1079Pfs*12 | Q9UBZ9 | protein_coding | TCGA-EW-A1IZ-01 | Breast | breast invasive carcinoma | Female | <65 | III/IV | Chemotherapy | taxotere | SD |
| Page: 1 2 3 4 5 6 7 8 9 10 11 12 13 |
Top |
Related drugs of malignant transformation related genes |
| Identification of chemicals and drugs interact with genes involved in malignant transfromation |
| (DGIdb 4.0) |
| Entrez ID | Symbol | Category | Interaction Types | Drug Claim Name | Drug Name | PMIDs |
| 51455 | REV1 | NA | cisplatin | CISPLATIN |
| Page: 1 |

Copyright 2023-Present -The University of Texas Health Science Center at Houston |