
|
|||||
|
 | |
| |
| |
| |
| |
| |
|
Gene: RETREG3 |
Gene summary for RETREG3 |
| Gene information | Species | Human | Gene symbol | RETREG3 | Gene ID | 162427 |
| Gene name | reticulophagy regulator family member 3 | |
| Gene Alias | FAM134C | |
| Cytomap | 17q21.2 | |
| Gene Type | protein-coding | GO ID | GO:0006914 | UniProtAcc | Q86VR2 |
Top |
Malignant transformation analysis |
| Identification of the aberrant gene expression in precancerous and cancerous lesions by comparing the gene expression of stem-like cells in diseased tissues with normal stem cells |
| Entrez ID | Symbol | Replicates | Species | Organ | Tissue | Adj P-value | Log2FC | Malignancy |
| 162427 | RETREG3 | HTA11_2487_2000001011 | Human | Colorectum | SER | 1.63e-02 | 4.42e-01 | -0.1808 |
| 162427 | RETREG3 | HTA11_1938_2000001011 | Human | Colorectum | AD | 3.30e-08 | 6.52e-01 | -0.0811 |
| 162427 | RETREG3 | HTA11_347_2000001011 | Human | Colorectum | AD | 5.60e-07 | 4.32e-01 | -0.1954 |
| 162427 | RETREG3 | HTA11_696_2000001011 | Human | Colorectum | AD | 1.87e-11 | 4.89e-01 | -0.1464 |
| 162427 | RETREG3 | HTA11_866_2000001011 | Human | Colorectum | AD | 2.15e-03 | 3.83e-01 | -0.1001 |
| 162427 | RETREG3 | HTA11_1391_2000001011 | Human | Colorectum | AD | 5.52e-11 | 6.36e-01 | -0.059 |
| 162427 | RETREG3 | HTA11_866_3004761011 | Human | Colorectum | AD | 2.04e-04 | 4.31e-01 | 0.096 |
| 162427 | RETREG3 | HTA11_7696_3000711011 | Human | Colorectum | AD | 2.27e-02 | 3.17e-01 | 0.0674 |
| 162427 | RETREG3 | HTA11_99999970781_79442 | Human | Colorectum | MSS | 7.82e-13 | -2.87e-01 | 0.294 |
| 162427 | RETREG3 | HTA11_99999965104_69814 | Human | Colorectum | MSS | 2.40e-04 | -2.87e-01 | 0.281 |
| 162427 | RETREG3 | HTA11_99999971662_82457 | Human | Colorectum | MSS | 7.82e-13 | -2.87e-01 | 0.3859 |
| 162427 | RETREG3 | HTA11_99999973899_84307 | Human | Colorectum | MSS | 7.78e-03 | -2.87e-01 | 0.2585 |
| 162427 | RETREG3 | HTA11_99999974143_84620 | Human | Colorectum | MSS | 7.82e-13 | -2.87e-01 | 0.3005 |
| 162427 | RETREG3 | A015-C-203 | Human | Colorectum | FAP | 9.21e-06 | -6.46e-02 | -0.1294 |
| 162427 | RETREG3 | A001-C-108 | Human | Colorectum | FAP | 1.64e-03 | -7.07e-02 | -0.0272 |
| 162427 | RETREG3 | A002-C-205 | Human | Colorectum | FAP | 9.63e-07 | -2.11e-01 | -0.1236 |
| 162427 | RETREG3 | A015-C-006 | Human | Colorectum | FAP | 4.52e-04 | -1.54e-01 | -0.0994 |
| 162427 | RETREG3 | A002-C-114 | Human | Colorectum | FAP | 4.11e-04 | -1.41e-01 | -0.1561 |
| 162427 | RETREG3 | A015-C-104 | Human | Colorectum | FAP | 6.83e-07 | -9.93e-02 | -0.1899 |
| 162427 | RETREG3 | A002-C-016 | Human | Colorectum | FAP | 6.10e-03 | -1.12e-01 | 0.0521 |
| Page: 1 2 |
| Tissue | Expression Dynamics | Abbreviation |
| Colorectum (GSE201348) |  | FAP: Familial adenomatous polyposis |
| CRC: Colorectal cancer | ||
| Colorectum (HTA11) |  | AD: Adenomas |
| SER: Sessile serrated lesions | ||
| MSI-H: Microsatellite-high colorectal cancer | ||
| MSS: Microsatellite stable colorectal cancer | ||
| Liver | 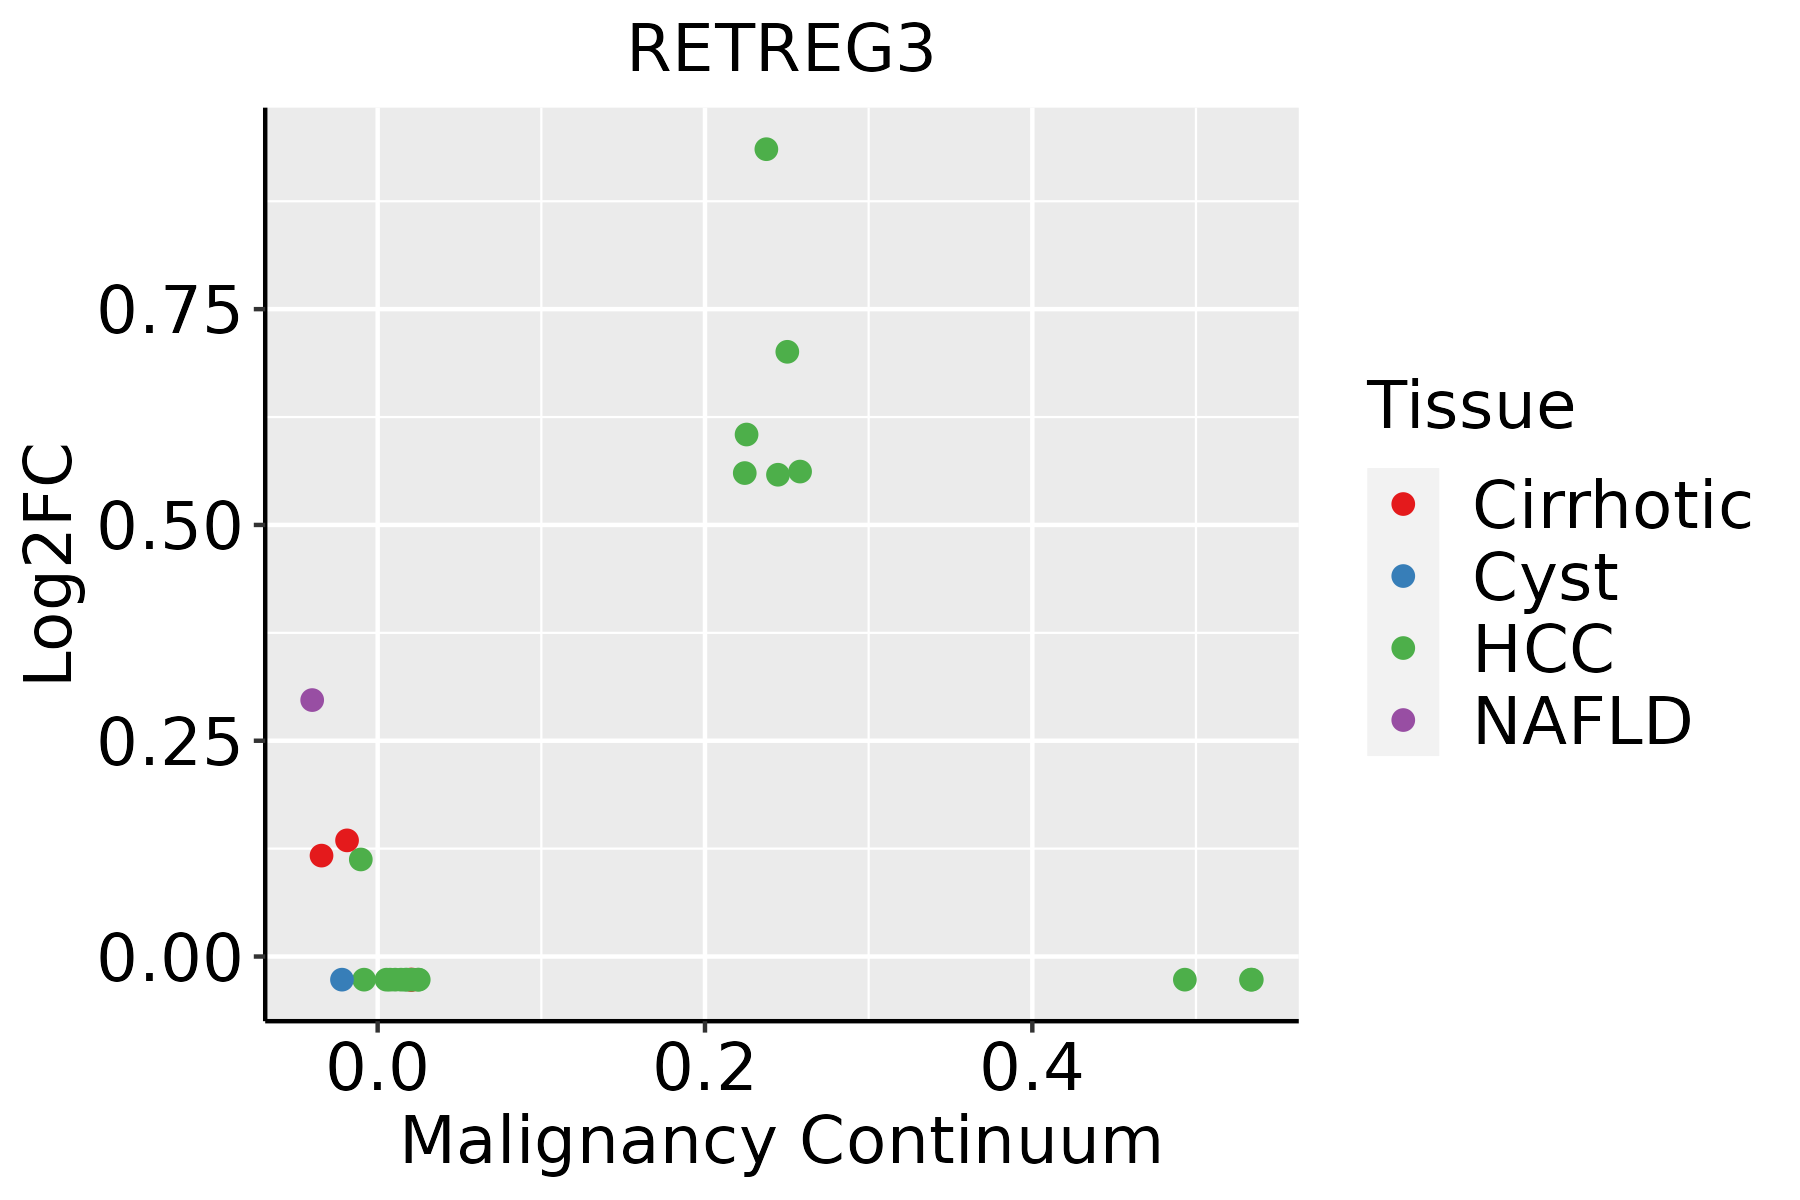 | HCC: Hepatocellular carcinoma |
| NAFLD: Non-alcoholic fatty liver disease |
| ∗log2FC in expression of this searched gene in stem-like cells from each diseased tissue sample relative to stem-like cells in normal samples in each tissue plotted against the malignancy continuum. Samples are colored based on if they are from different disease stage. |
Top |
Malignant transformation related pathway analysis |
| Find out the enriched GO biological processes and KEGG pathways involved in transition from healthy to precancer to cancer |
| Tissue | Disease Stage | Enriched GO biological Processes |
| Colorectum | AD |  |
| Colorectum | SER |  |
| Colorectum | MSS |  |
| Colorectum | MSI-H |  |
| Colorectum | FAP |  |
| ∗Top 15 enriched GO BP terms are showed in the bar plot of each disease state in each tissue. Each row represents a significant GO biological process which is colored according to the -log10(p.adjust). |
| Page: 1 2 3 4 5 6 7 8 9 |
| GO ID | Tissue | Disease Stage | Description | Gene Ratio | Bg Ratio | pvalue | p.adjust | Count |
| GO:0022411 | Colorectum | AD | cellular component disassembly | 147/3918 | 443/18723 | 8.53e-10 | 6.76e-08 | 147 |
| GO:0016236 | Colorectum | AD | macroautophagy | 103/3918 | 291/18723 | 6.76e-09 | 4.15e-07 | 103 |
| GO:1903008 | Colorectum | AD | organelle disassembly | 46/3918 | 114/18723 | 1.81e-06 | 5.48e-05 | 46 |
| GO:0010975 | Colorectum | AD | regulation of neuron projection development | 129/3918 | 445/18723 | 2.88e-05 | 5.37e-04 | 129 |
| GO:0061912 | Colorectum | AD | selective autophagy | 29/3918 | 68/18723 | 4.20e-05 | 7.39e-04 | 29 |
| GO:0031346 | Colorectum | AD | positive regulation of cell projection organization | 104/3918 | 353/18723 | 8.26e-05 | 1.30e-03 | 104 |
| GO:00224111 | Colorectum | SER | cellular component disassembly | 114/2897 | 443/18723 | 1.17e-08 | 9.59e-07 | 114 |
| GO:00162361 | Colorectum | SER | macroautophagy | 79/2897 | 291/18723 | 1.97e-07 | 1.10e-05 | 79 |
| GO:19030081 | Colorectum | SER | organelle disassembly | 36/2897 | 114/18723 | 1.22e-05 | 3.89e-04 | 36 |
| GO:00619121 | Colorectum | SER | selective autophagy | 24/2897 | 68/18723 | 4.60e-05 | 1.15e-03 | 24 |
| GO:00109751 | Colorectum | SER | regulation of neuron projection development | 92/2897 | 445/18723 | 1.85e-03 | 1.89e-02 | 92 |
| GO:00313461 | Colorectum | SER | positive regulation of cell projection organization | 75/2897 | 353/18723 | 2.22e-03 | 2.14e-02 | 75 |
| GO:00224112 | Colorectum | MSS | cellular component disassembly | 130/3467 | 443/18723 | 1.44e-08 | 8.46e-07 | 130 |
| GO:00162362 | Colorectum | MSS | macroautophagy | 93/3467 | 291/18723 | 2.08e-08 | 1.17e-06 | 93 |
| GO:19030082 | Colorectum | MSS | organelle disassembly | 42/3467 | 114/18723 | 2.98e-06 | 8.91e-05 | 42 |
| GO:00313462 | Colorectum | MSS | positive regulation of cell projection organization | 96/3467 | 353/18723 | 3.44e-05 | 6.70e-04 | 96 |
| GO:00619122 | Colorectum | MSS | selective autophagy | 27/3467 | 68/18723 | 3.68e-05 | 7.09e-04 | 27 |
| GO:00109752 | Colorectum | MSS | regulation of neuron projection development | 115/3467 | 445/18723 | 6.91e-05 | 1.20e-03 | 115 |
| GO:00109753 | Colorectum | FAP | regulation of neuron projection development | 102/2622 | 445/18723 | 2.04e-07 | 1.24e-05 | 102 |
| GO:00313463 | Colorectum | FAP | positive regulation of cell projection organization | 82/2622 | 353/18723 | 1.78e-06 | 7.35e-05 | 82 |
| Page: 1 2 |
| Pathway ID | Tissue | Disease Stage | Description | Gene Ratio | Bg Ratio | pvalue | p.adjust | qvalue | Count |
| Page: 1 |
Top |
Cell-cell communication analysis |
| Identification of potential cell-cell interactions between two cell types and their ligand-receptor pairs for different disease states |
| Ligand | Receptor | LRpair | Pathway | Tissue | Disease Stage |
| Page: 1 |
Top |
Single-cell gene regulatory network inference analysis |
| Find out the significant the regulons (TFs) and the target genes of each regulon across cell types for different disease states |
| TF | Cell Type | Tissue | Disease Stage | Target Gene | RSS | Regulon Activity |
| ∗The dot plots of a searched regulon are shown for all cell subpopulations in each disease state of each tissue based on the regulon specific score inferred using pySCENIC and by calculating the average expression. |
| Page: 1 |
Top |
Somatic mutation of malignant transformation related genes |
| Annotation of somatic variants for genes involved in malignant transformation |
| Hugo Symbol | Variant Class | Variant Classification | dbSNP RS | HGVSc | HGVSp | HGVSp Short | SWISSPROT | BIOTYPE | SIFT | PolyPhen | Tumor Sample Barcode | Tissue | Histology | Sex | Age | Stage | Therapy Types | Drugs | Outcome |
| Page: 1 |
Top |
Related drugs of malignant transformation related genes |
| Identification of chemicals and drugs interact with genes involved in malignant transfromation |
| (DGIdb 4.0) |
| Entrez ID | Symbol | Category | Interaction Types | Drug Claim Name | Drug Name | PMIDs |
| Page: 1 |

Copyright 2023-Present -The University of Texas Health Science Center at Houston |