
|
|||||
|
 | |
| |
| |
| |
| |
| |
|
Gene: RERE |
Gene summary for RERE |
| Gene information | Species | Human | Gene symbol | RERE | Gene ID | 473 |
| Gene name | arginine-glutamic acid dipeptide repeats | |
| Gene Alias | ARG | |
| Cytomap | 1p36.23 | |
| Gene Type | protein-coding | GO ID | GO:0000902 | UniProtAcc | A0A024R4E9 |
Top |
Malignant transformation analysis |
| Identification of the aberrant gene expression in precancerous and cancerous lesions by comparing the gene expression of stem-like cells in diseased tissues with normal stem cells |
| Entrez ID | Symbol | Replicates | Species | Organ | Tissue | Adj P-value | Log2FC | Malignancy |
| 473 | RERE | CA_HPV_2 | Human | Cervix | CC | 3.49e-03 | 2.89e-01 | 0.0391 |
| 473 | RERE | CCI_1 | Human | Cervix | CC | 3.31e-13 | 1.48e+00 | 0.528 |
| 473 | RERE | CCI_2 | Human | Cervix | CC | 5.98e-19 | 2.55e+00 | 0.5249 |
| 473 | RERE | CCI_3 | Human | Cervix | CC | 2.74e-22 | 1.41e+00 | 0.516 |
| 473 | RERE | Tumor | Human | Cervix | CC | 2.28e-02 | -2.23e-01 | 0.1241 |
| 473 | RERE | H2 | Human | Cervix | HSIL_HPV | 4.44e-05 | 3.17e-01 | 0.0632 |
| 473 | RERE | HTA11_1938_2000001011 | Human | Colorectum | AD | 2.61e-13 | 7.26e-01 | -0.0811 |
| 473 | RERE | HTA11_347_2000001011 | Human | Colorectum | AD | 2.19e-18 | 7.49e-01 | -0.1954 |
| 473 | RERE | HTA11_411_2000001011 | Human | Colorectum | SER | 9.65e-06 | 7.23e-01 | -0.2602 |
| 473 | RERE | HTA11_1391_2000001011 | Human | Colorectum | AD | 1.82e-06 | 6.41e-01 | -0.059 |
| 473 | RERE | HTA11_5216_2000001011 | Human | Colorectum | SER | 1.57e-05 | -4.32e-01 | -0.1462 |
| 473 | RERE | HTA11_546_2000001011 | Human | Colorectum | AD | 3.26e-02 | 4.86e-01 | -0.0842 |
| 473 | RERE | HTA11_99999965062_69753 | Human | Colorectum | MSI-H | 4.27e-18 | 1.05e+00 | 0.3487 |
| 473 | RERE | HTA11_99999965104_69814 | Human | Colorectum | MSS | 1.07e-19 | 9.40e-01 | 0.281 |
| 473 | RERE | HTA11_99999971662_82457 | Human | Colorectum | MSS | 7.20e-05 | 7.76e-01 | 0.3859 |
| 473 | RERE | A015-C-203 | Human | Colorectum | FAP | 9.24e-27 | -3.26e-01 | -0.1294 |
| 473 | RERE | A015-C-204 | Human | Colorectum | FAP | 2.69e-03 | -2.10e-01 | -0.0228 |
| 473 | RERE | A014-C-040 | Human | Colorectum | FAP | 4.30e-07 | -2.64e-01 | -0.1184 |
| 473 | RERE | A002-C-201 | Human | Colorectum | FAP | 6.22e-08 | -1.81e-01 | 0.0324 |
| 473 | RERE | A001-C-119 | Human | Colorectum | FAP | 1.13e-07 | 1.78e-01 | -0.1557 |
| Page: 1 2 3 4 5 6 7 8 9 10 11 12 13 |
| Tissue | Expression Dynamics | Abbreviation |
| Cervix | 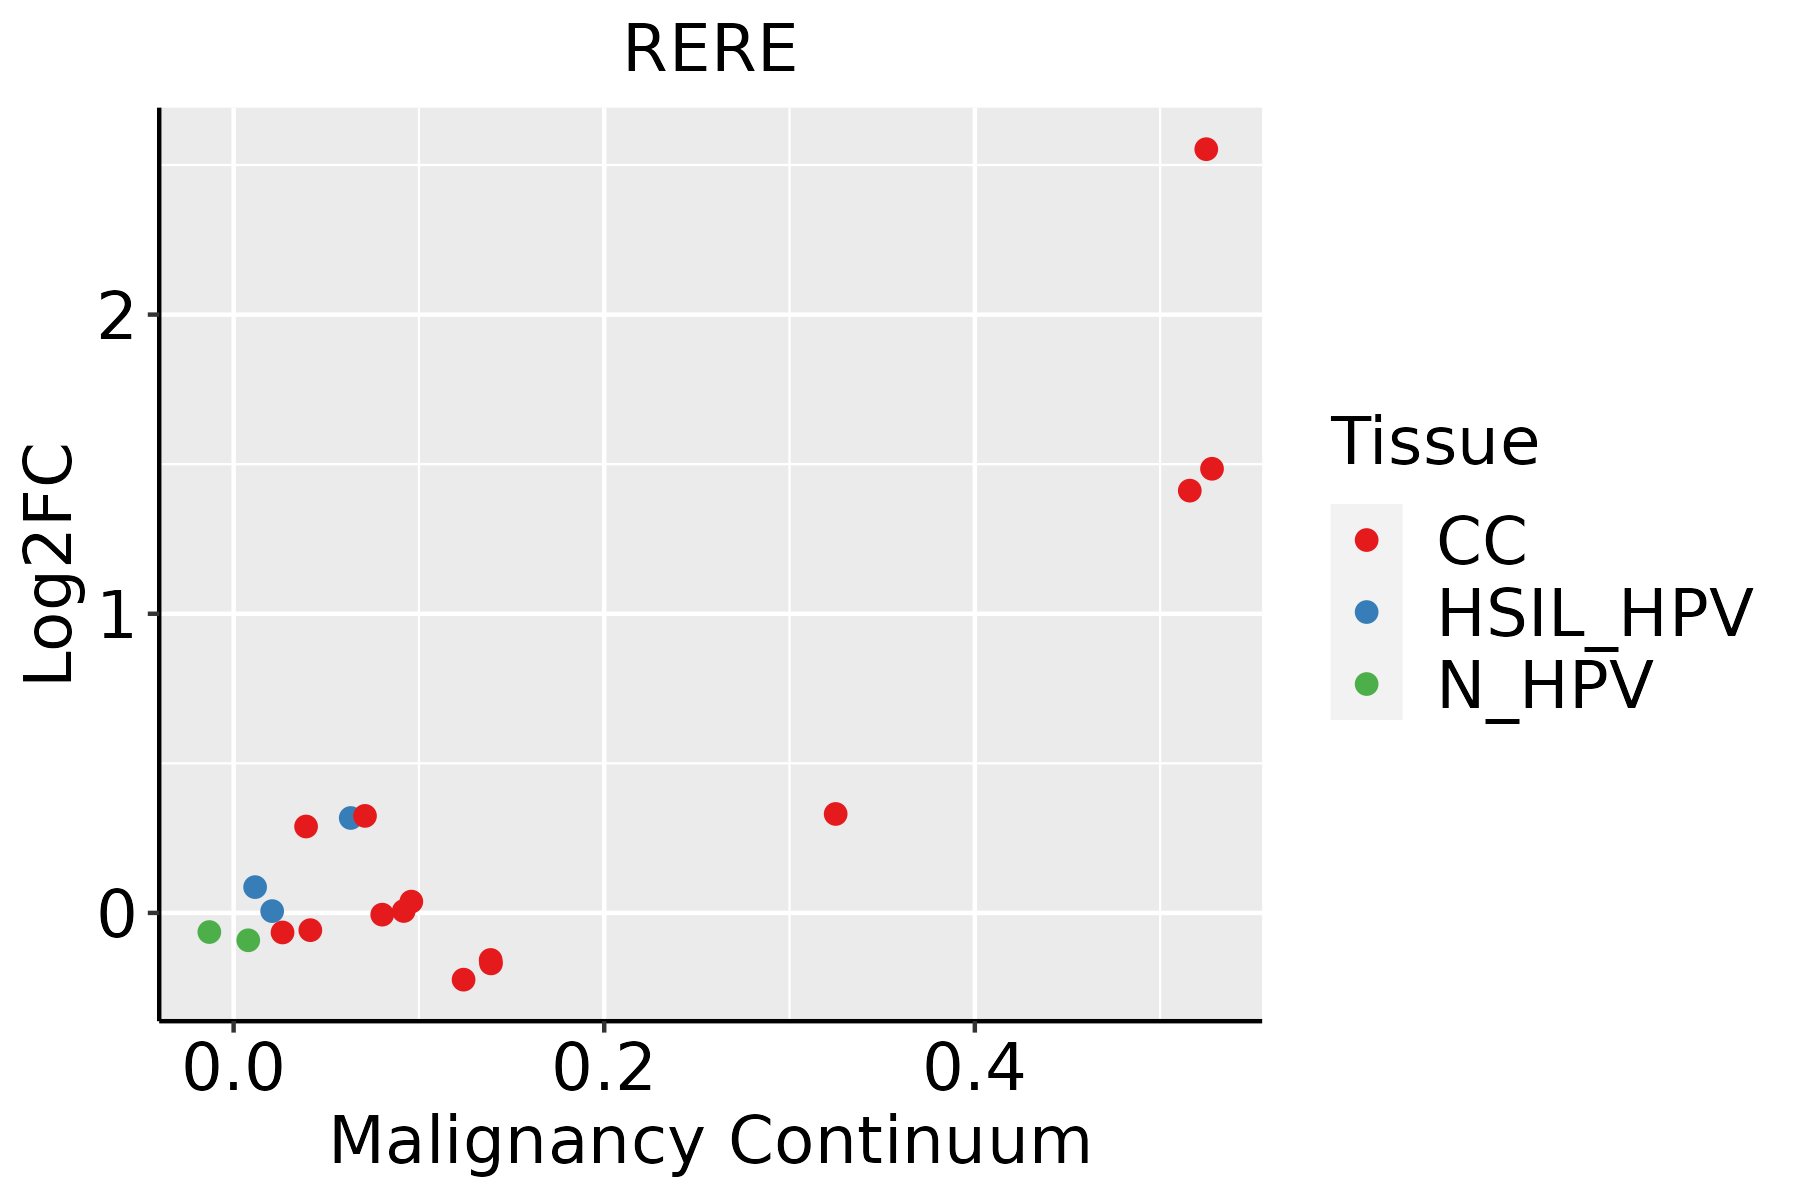 | CC: Cervix cancer |
| HSIL_HPV: HPV-infected high-grade squamous intraepithelial lesions | ||
| N_HPV: HPV-infected normal cervix | ||
| Colorectum (GSE201348) |  | FAP: Familial adenomatous polyposis |
| CRC: Colorectal cancer | ||
| Colorectum (HTA11) |  | AD: Adenomas |
| SER: Sessile serrated lesions | ||
| MSI-H: Microsatellite-high colorectal cancer | ||
| MSS: Microsatellite stable colorectal cancer | ||
| Endometrium | 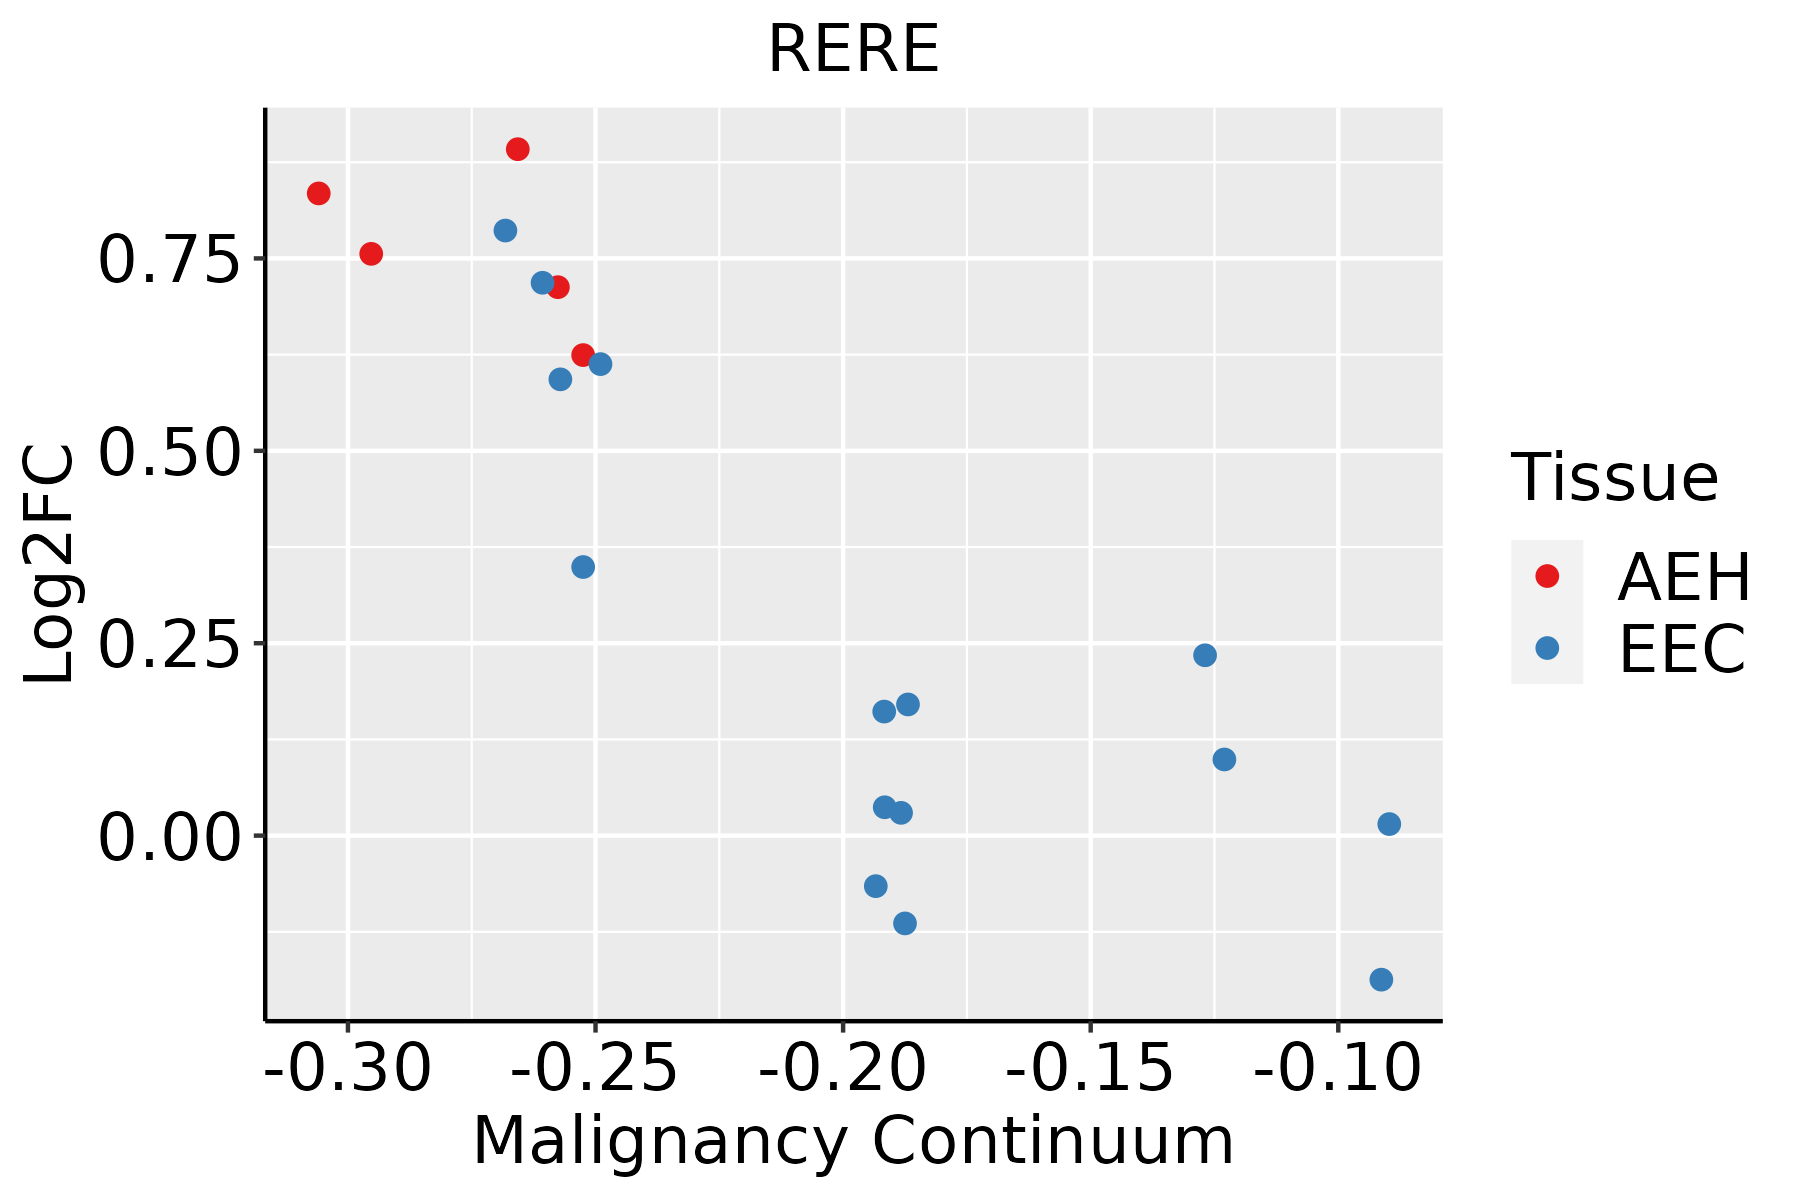 | AEH: Atypical endometrial hyperplasia |
| EEC: Endometrioid Cancer | ||
| Esophagus | 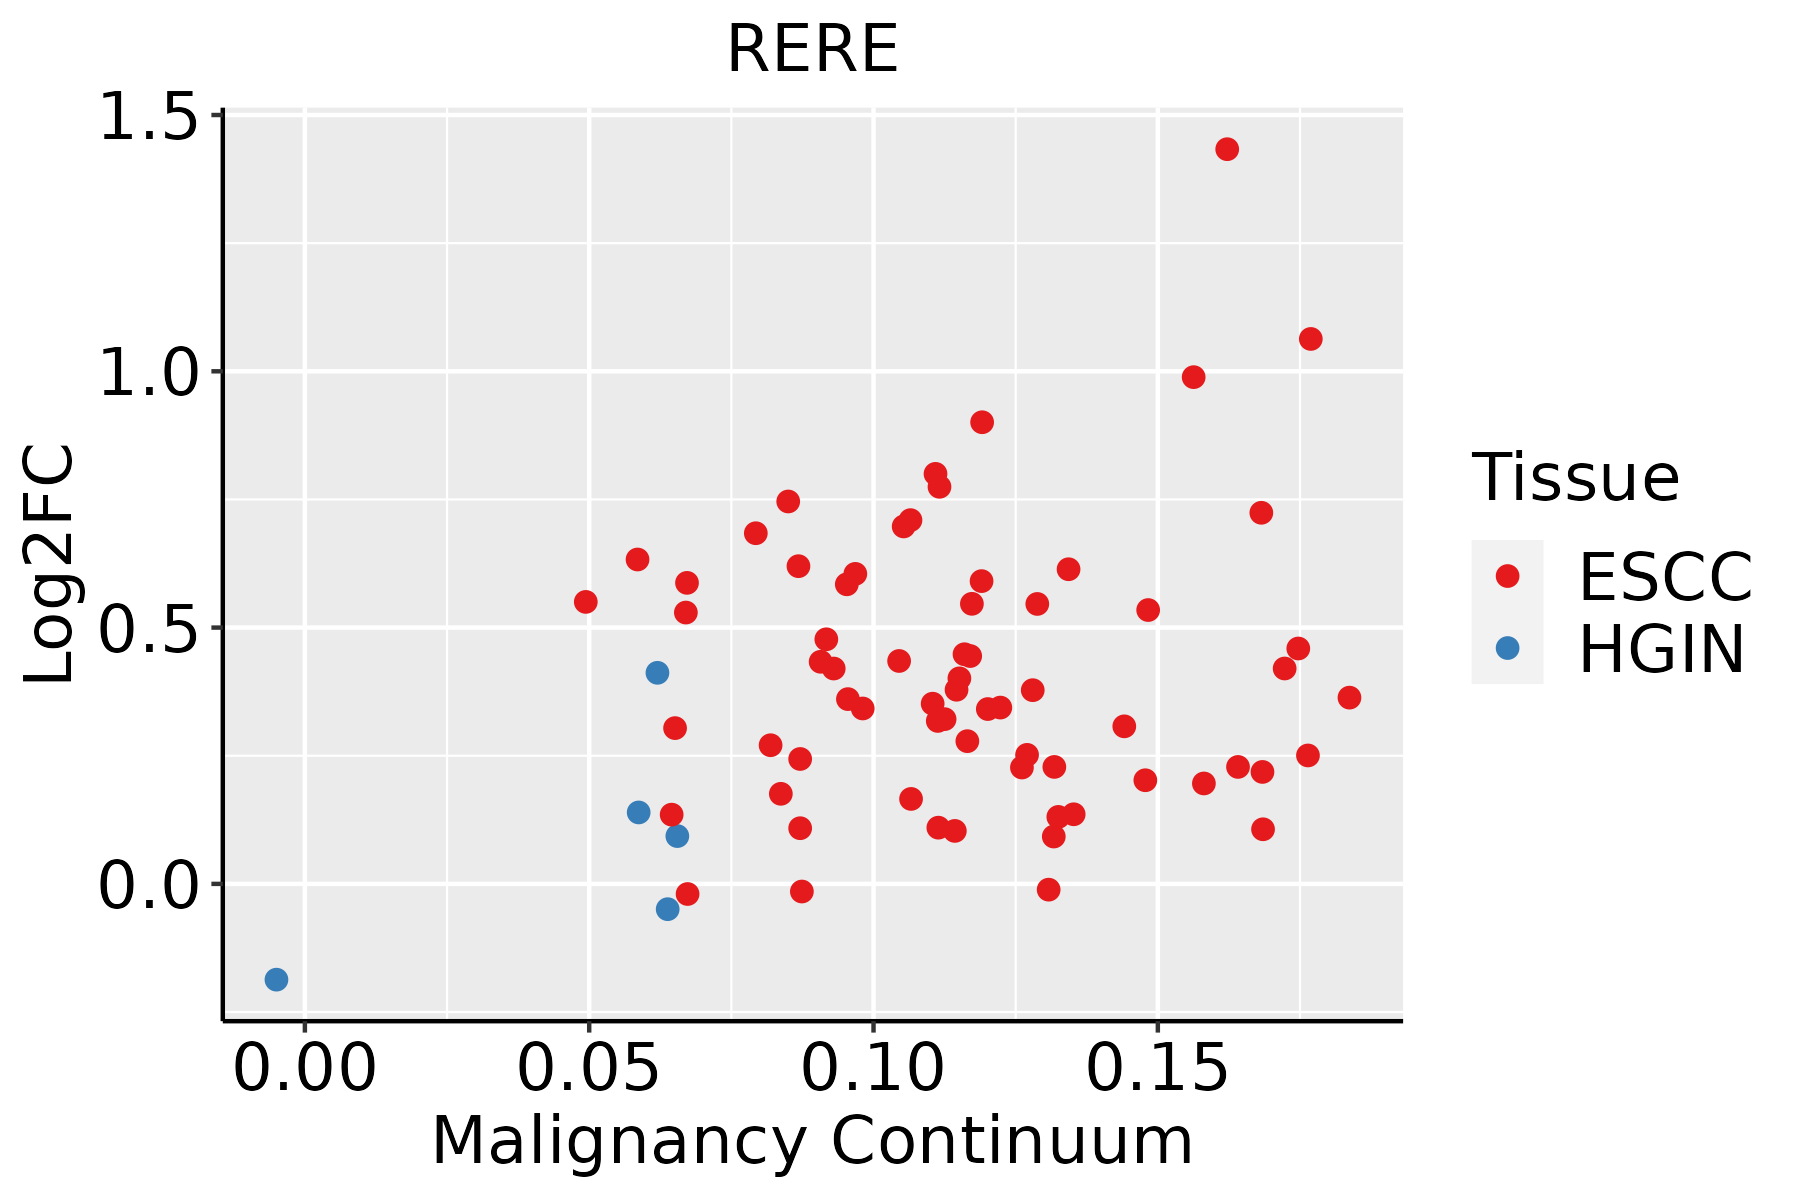 | ESCC: Esophageal squamous cell carcinoma |
| HGIN: High-grade intraepithelial neoplasias | ||
| LGIN: Low-grade intraepithelial neoplasias | ||
| GC | 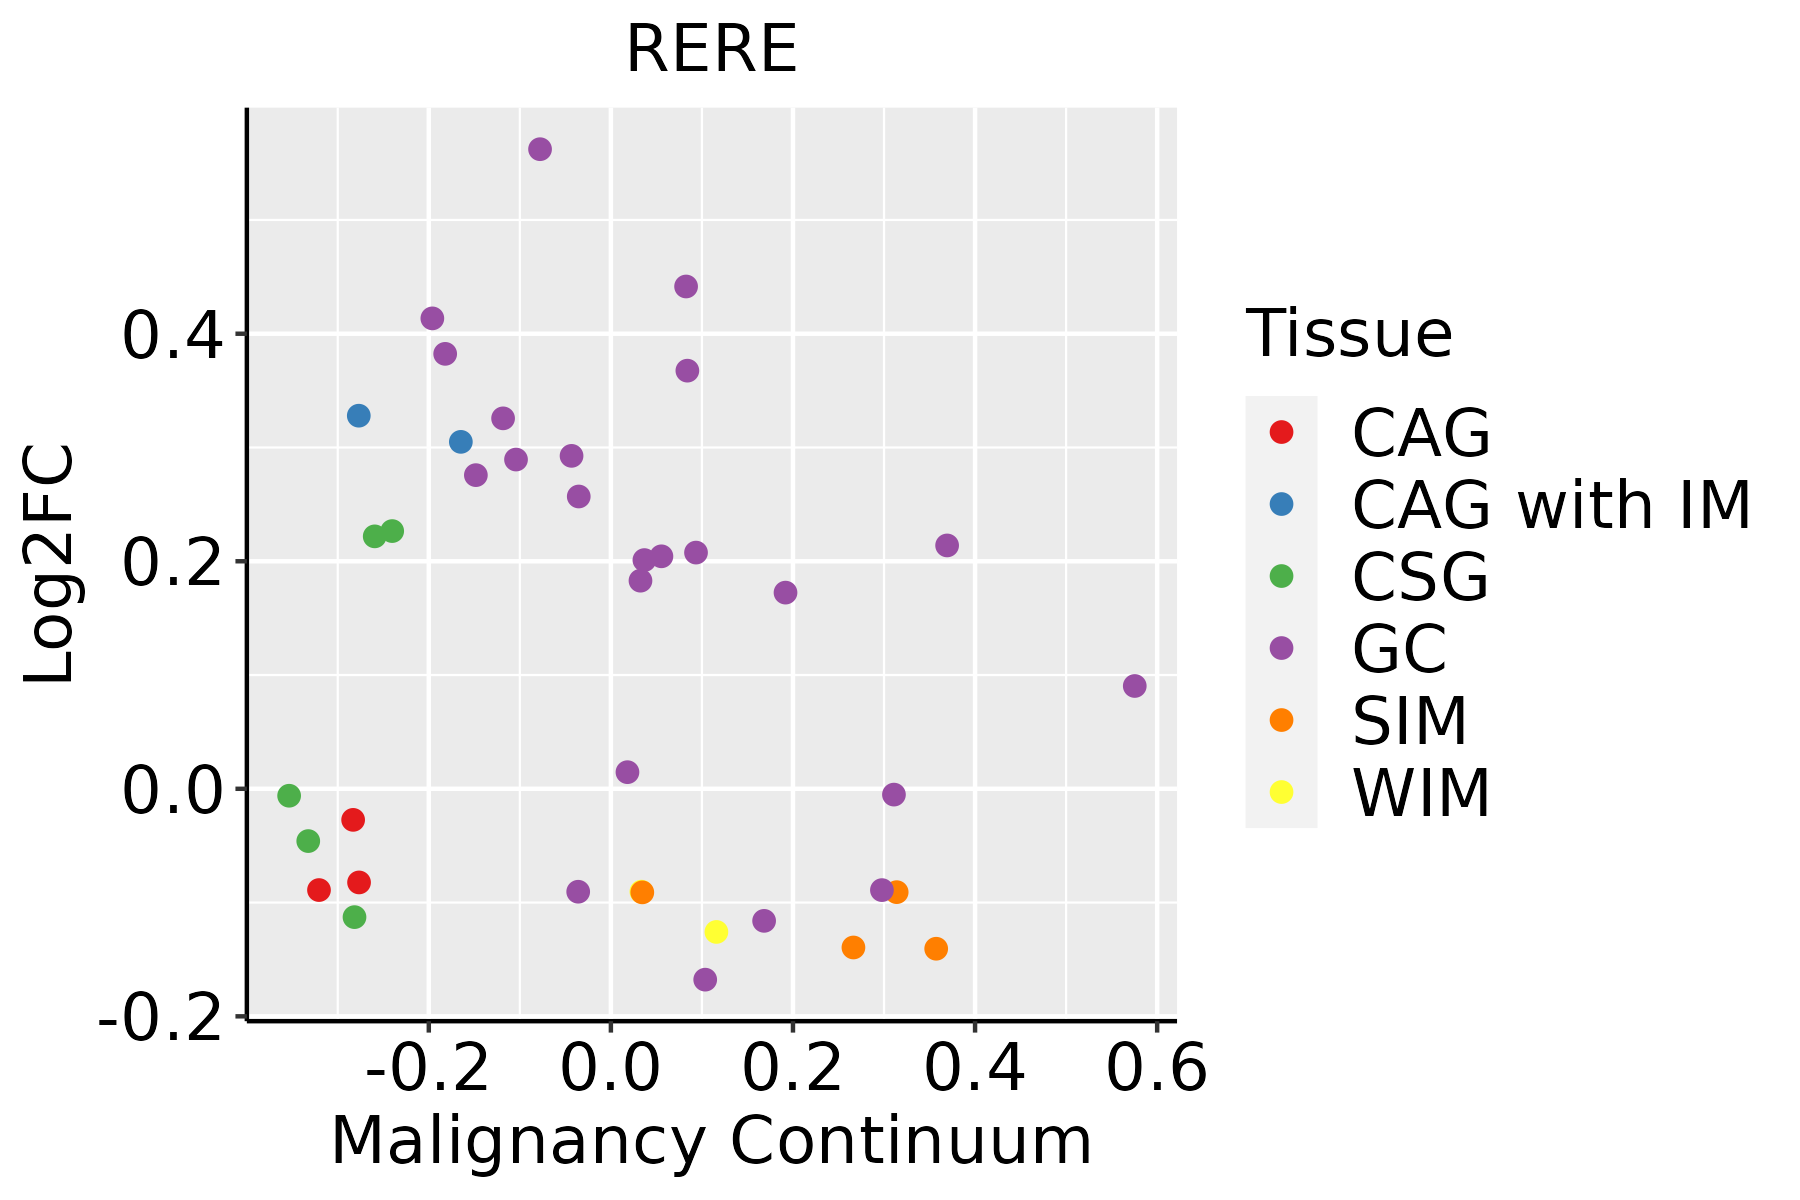 | CAG: Chronic atrophic gastritis |
| CAG with IM: Chronic atrophic gastritis with intestinal metaplasia | ||
| CSG: Chronic superficial gastritis | ||
| GC: Gastric cancer | ||
| SIM: Severe intestinal metaplasia | ||
| WIM: Wild intestinal metaplasia | ||
| Liver | 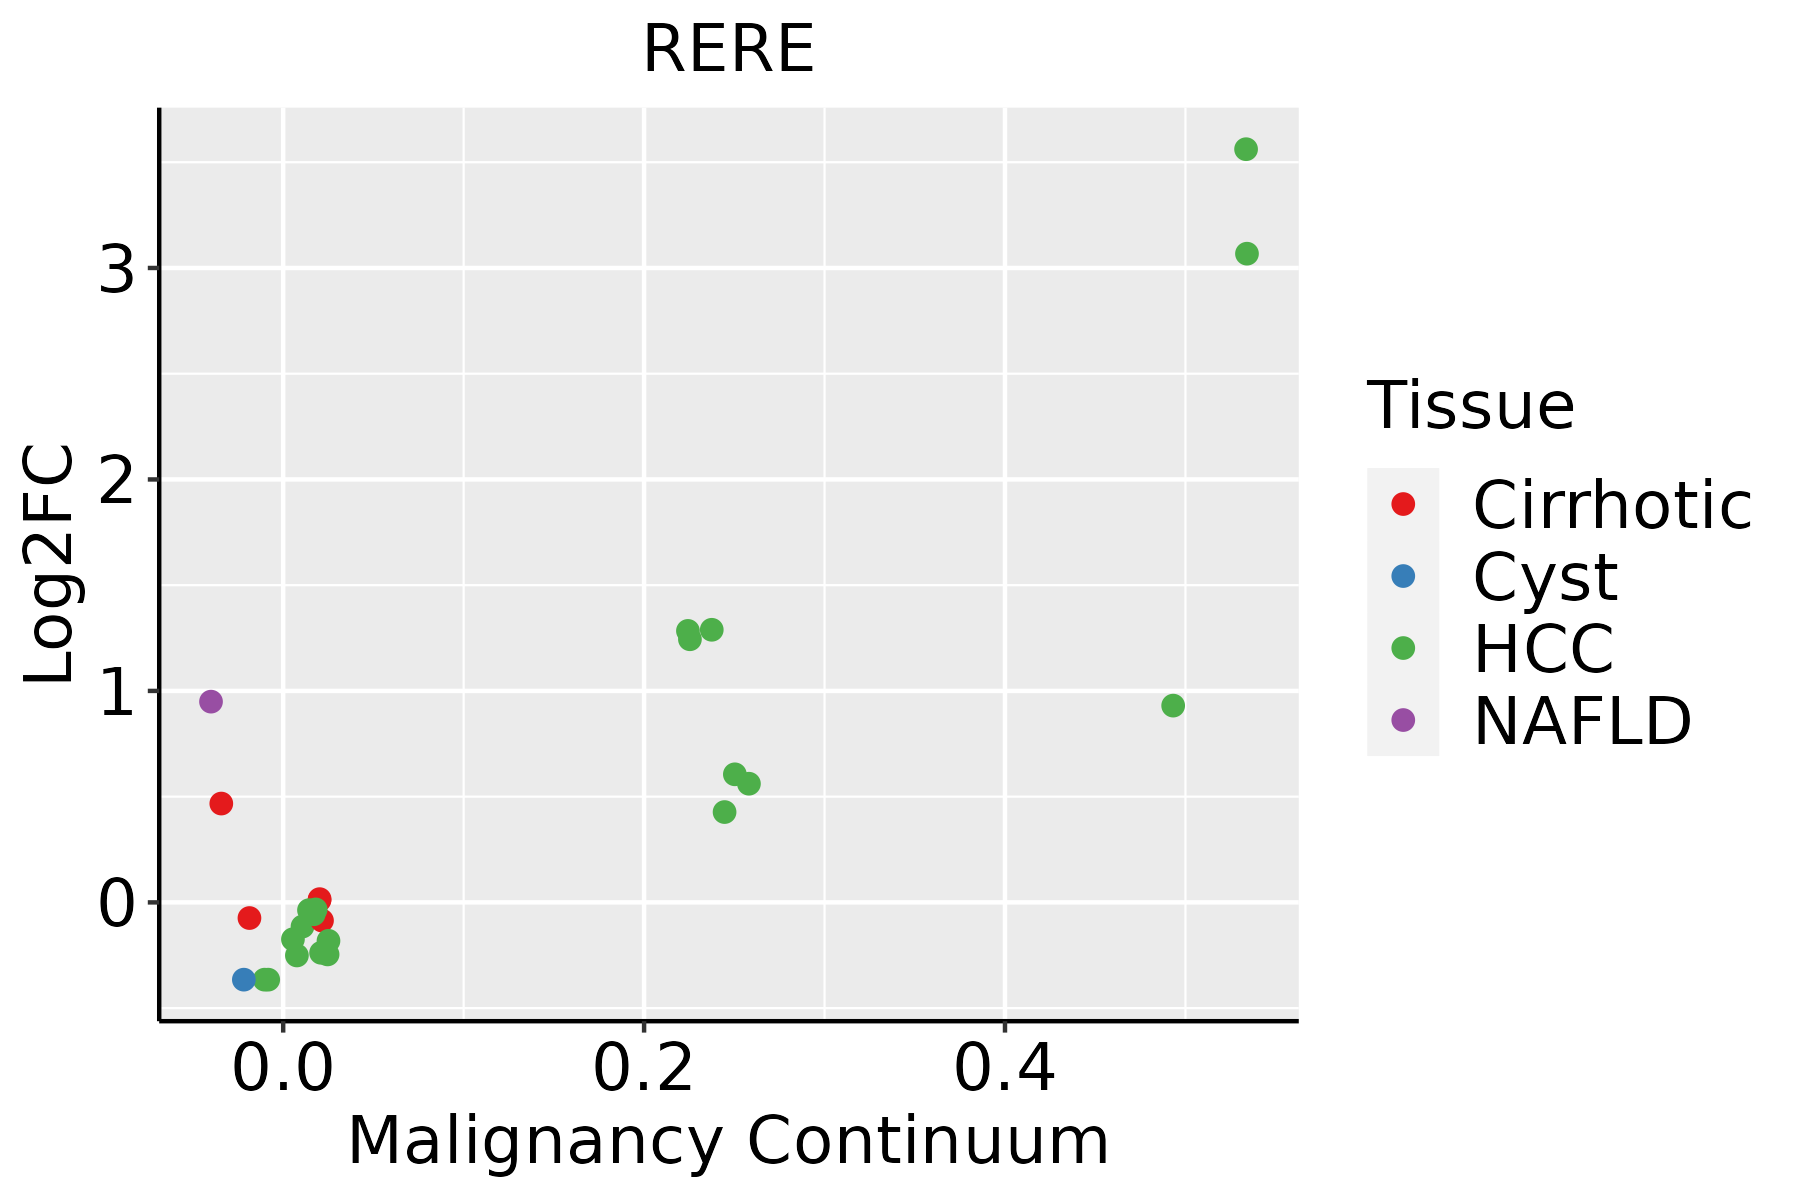 | HCC: Hepatocellular carcinoma |
| NAFLD: Non-alcoholic fatty liver disease | ||
| Lung | 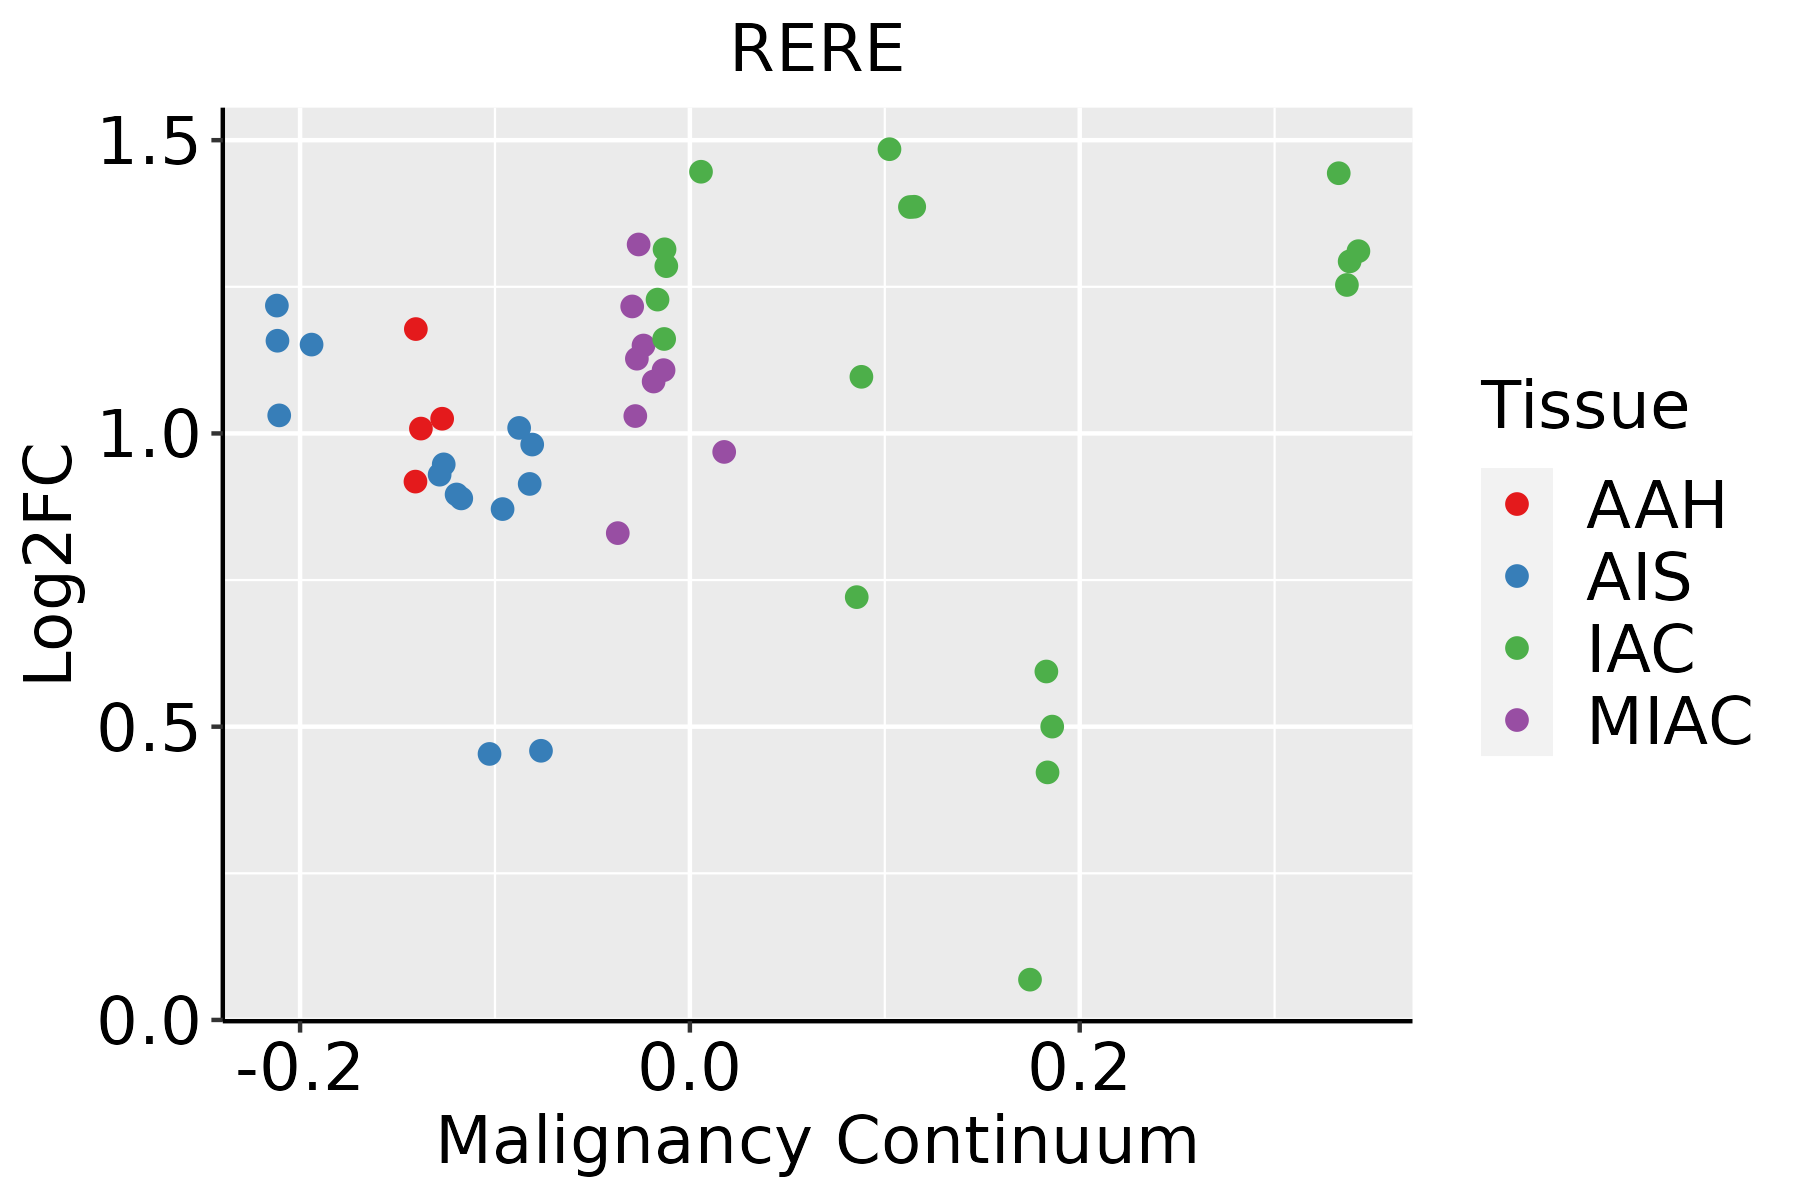 | AAH: Atypical adenomatous hyperplasia |
| AIS: Adenocarcinoma in situ | ||
| IAC: Invasive lung adenocarcinoma | ||
| MIA: Minimally invasive adenocarcinoma | ||
| Oral Cavity | 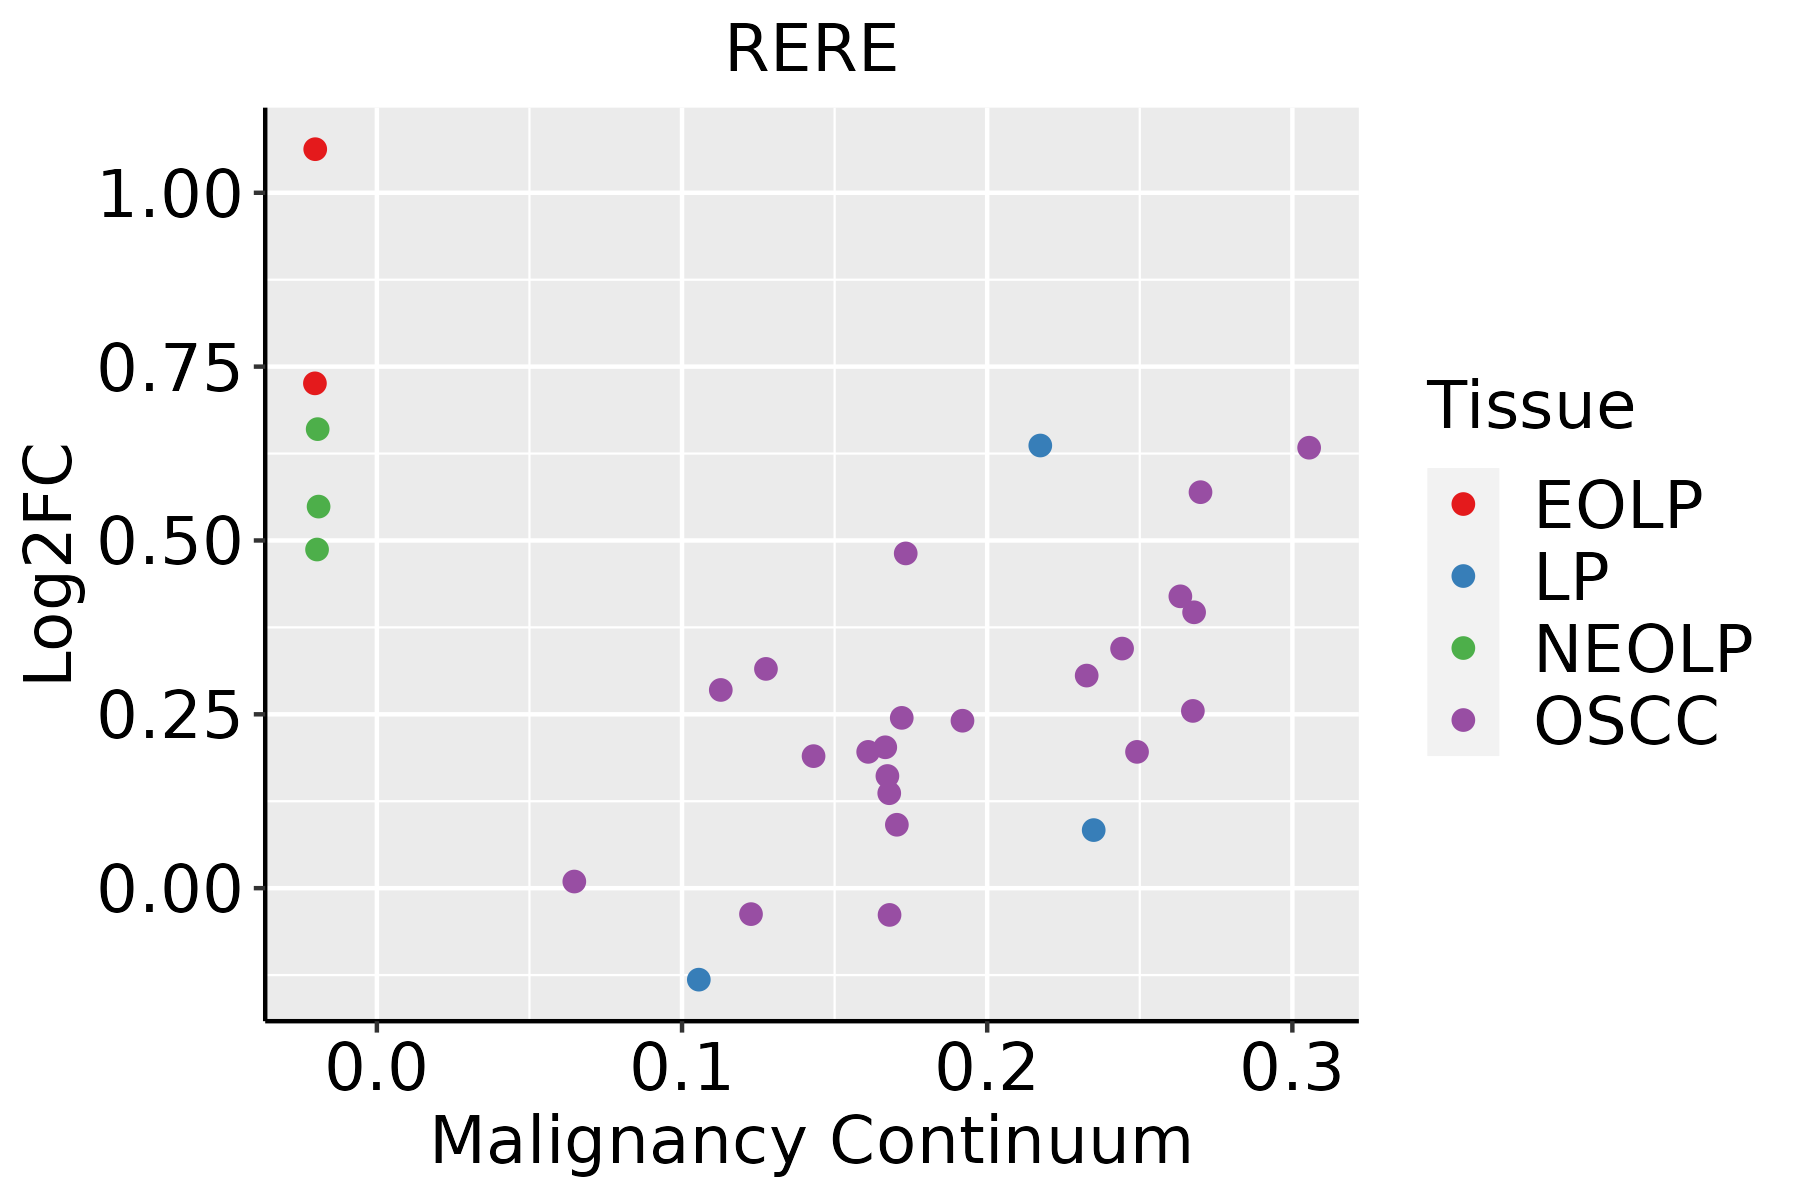 | EOLP: Erosive Oral lichen planus |
| LP: leukoplakia | ||
| NEOLP: Non-erosive oral lichen planus | ||
| OSCC: Oral squamous cell carcinoma | ||
| Prostate | 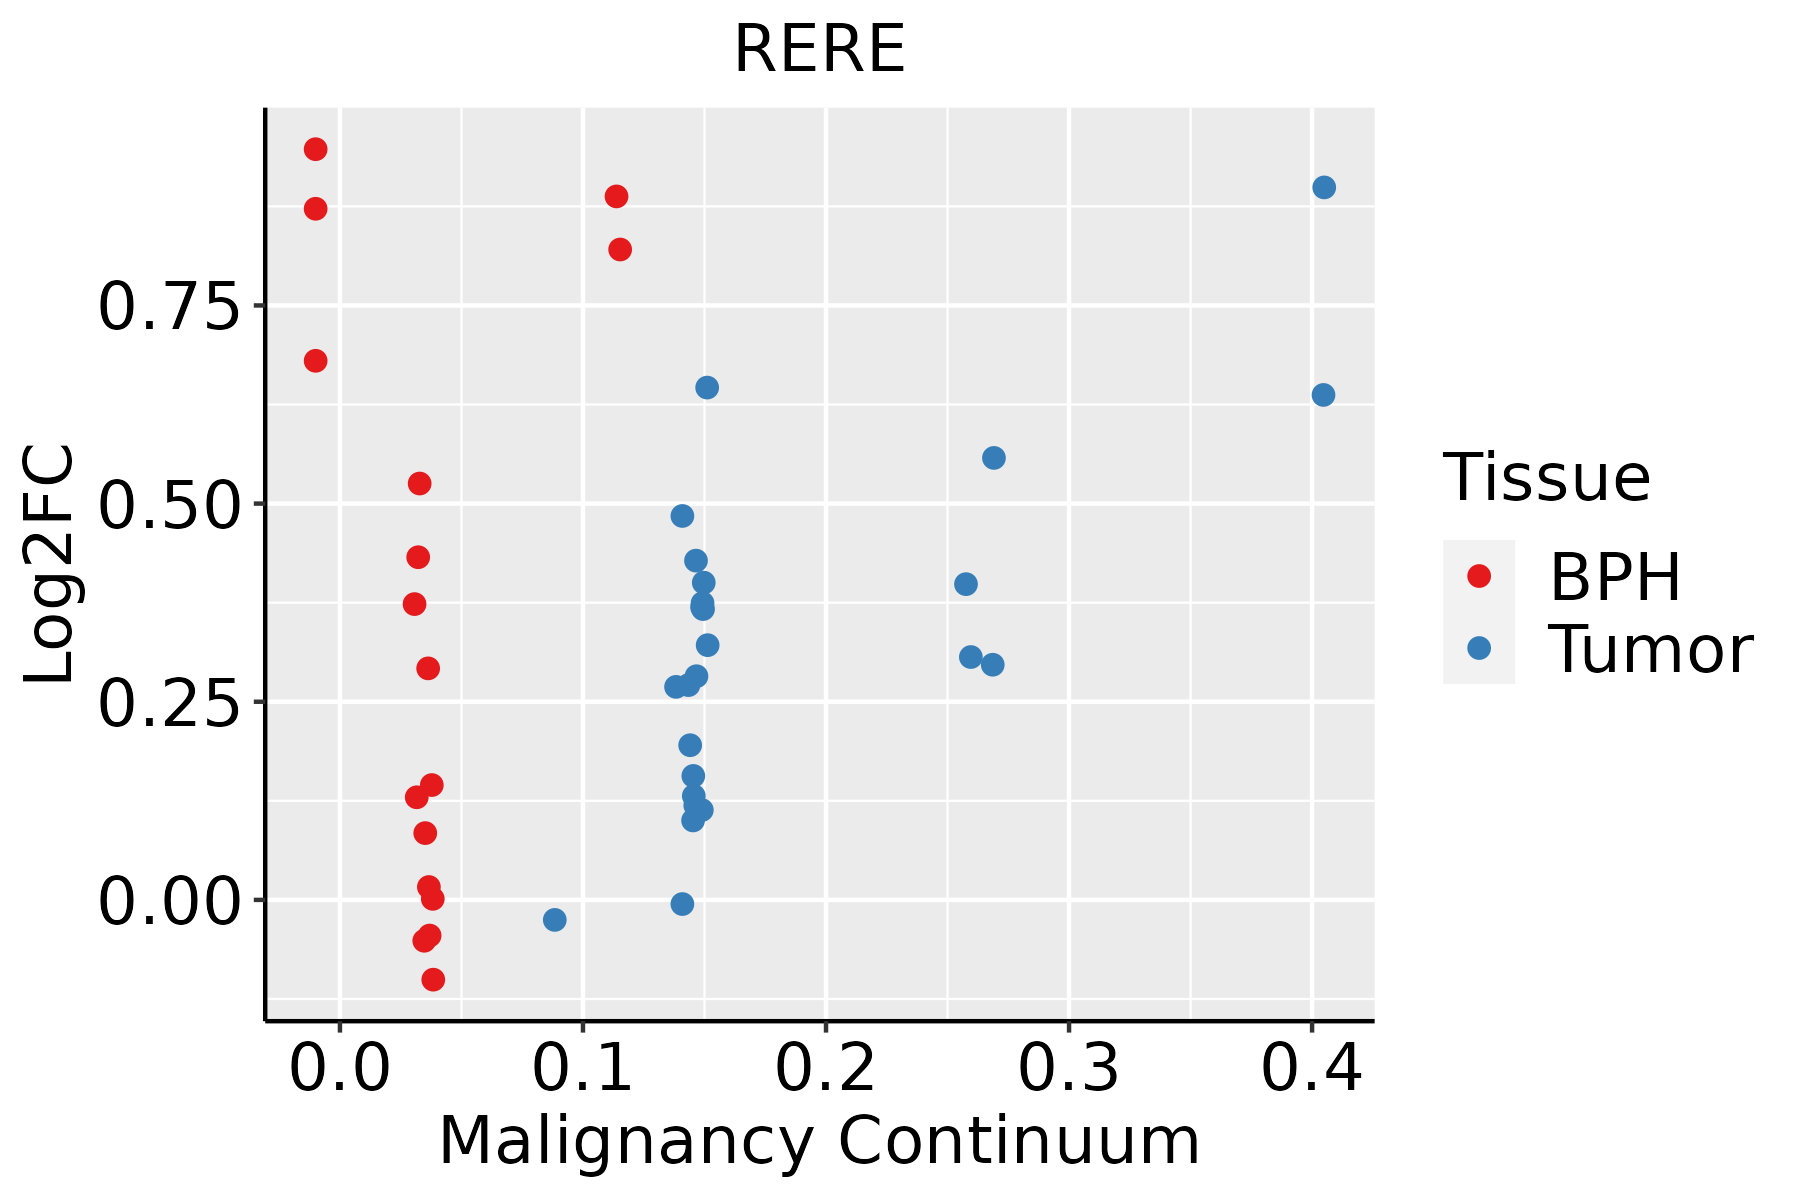 | BPH: Benign Prostatic Hyperplasia |
| Skin |  | AK: Actinic keratosis |
| cSCC: Cutaneous squamous cell carcinoma | ||
| SCCIS:squamous cell carcinoma in situ | ||
| Thyroid | 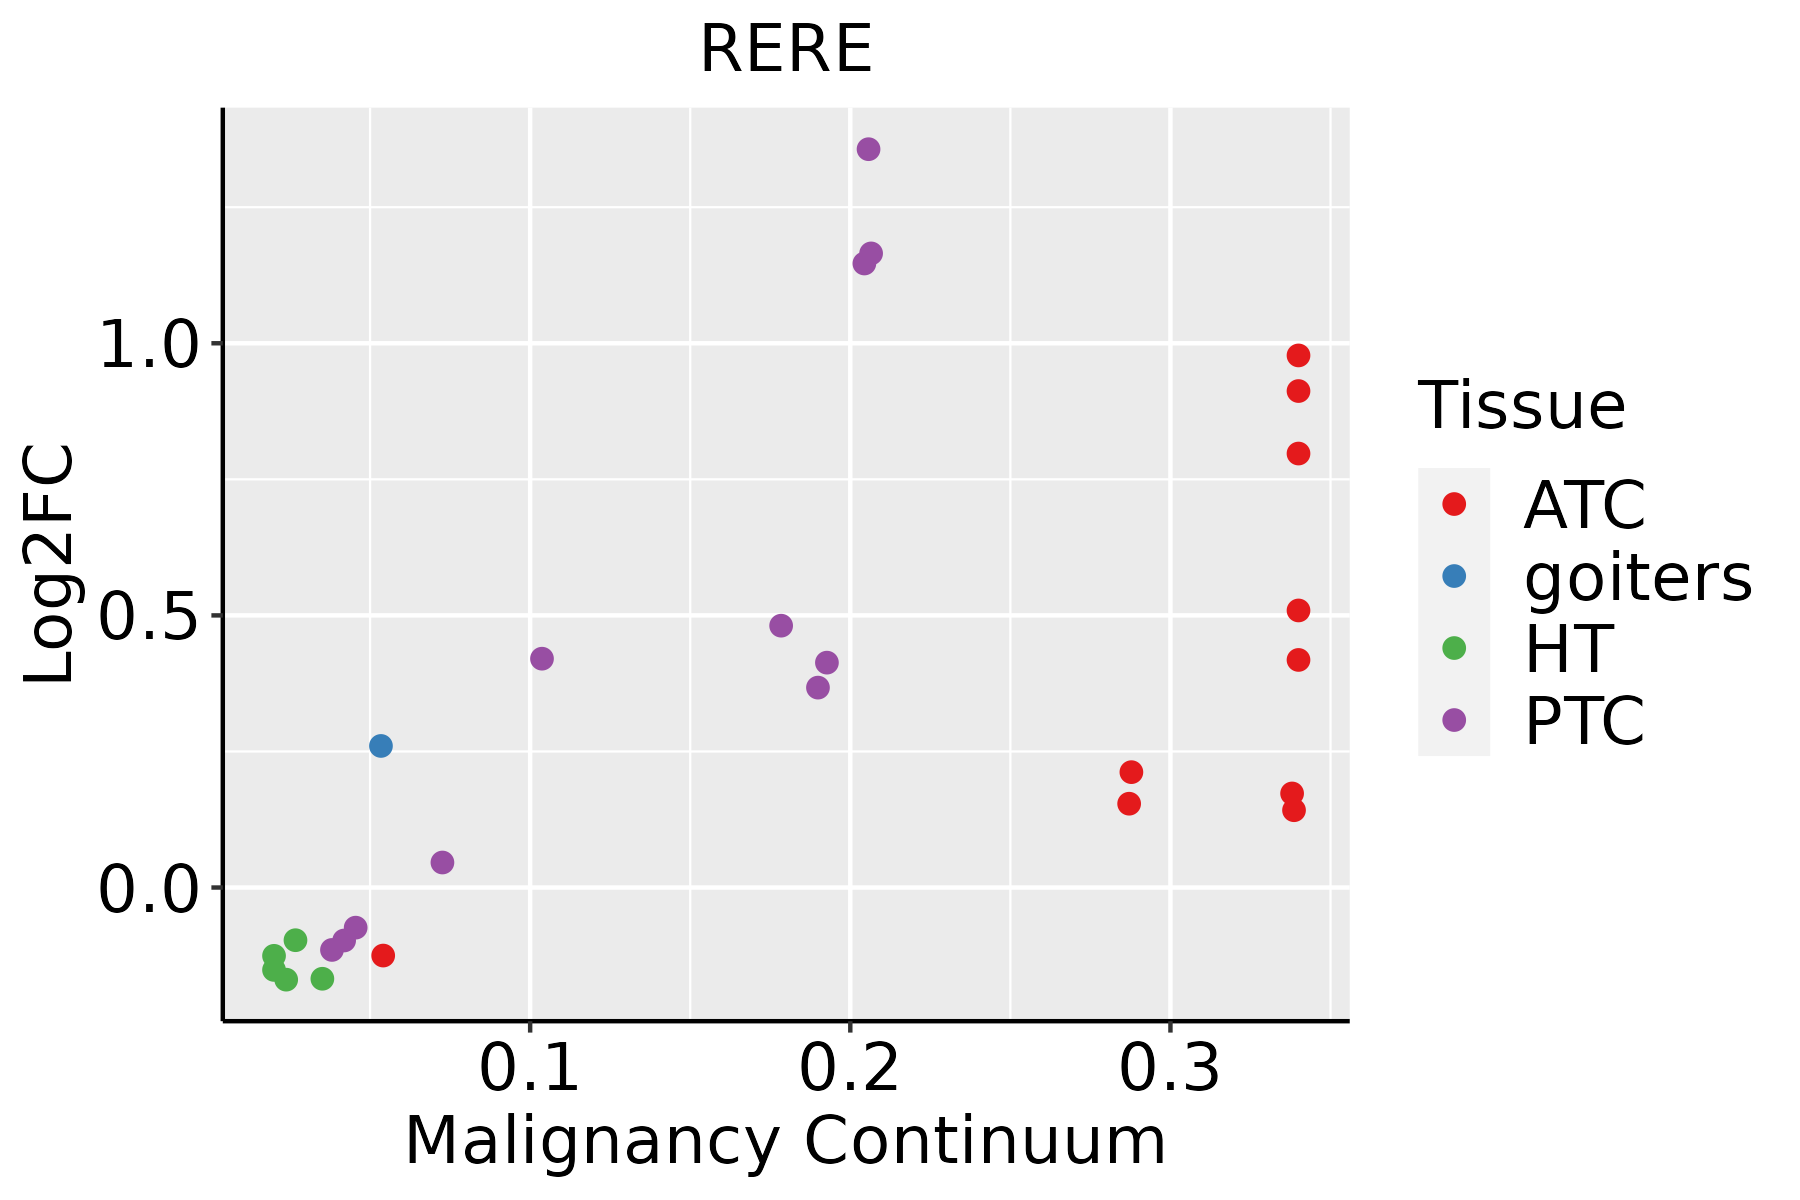 | ATC: Anaplastic thyroid cancer |
| HT: Hashimoto's thyroiditis | ||
| PTC: Papillary thyroid cancer |
| ∗log2FC in expression of this searched gene in stem-like cells from each diseased tissue sample relative to stem-like cells in normal samples in each tissue plotted against the malignancy continuum. Samples are colored based on if they are from different disease stage. |
Top |
Malignant transformation related pathway analysis |
| Find out the enriched GO biological processes and KEGG pathways involved in transition from healthy to precancer to cancer |
| Tissue | Disease Stage | Enriched GO biological Processes |
| Colorectum | AD |  |
| Colorectum | SER |  |
| Colorectum | MSS |  |
| Colorectum | MSI-H |  |
| Colorectum | FAP |  |
| ∗Top 15 enriched GO BP terms are showed in the bar plot of each disease state in each tissue. Each row represents a significant GO biological process which is colored according to the -log10(p.adjust). |
| Page: 1 2 3 4 5 6 7 8 9 |
| GO ID | Tissue | Disease Stage | Description | Gene Ratio | Bg Ratio | pvalue | p.adjust | Count |
| GO:00163587 | Cervix | CC | dendrite development | 58/2311 | 243/18723 | 4.52e-07 | 1.76e-05 | 58 |
| GO:00063257 | Cervix | CC | chromatin organization | 78/2311 | 409/18723 | 5.40e-05 | 8.02e-04 | 78 |
| GO:00488135 | Cervix | CC | dendrite morphogenesis | 30/2311 | 146/18723 | 3.27e-03 | 2.13e-02 | 30 |
| GO:00487552 | Cervix | CC | branching morphogenesis of a nerve | 5/2311 | 10/18723 | 4.20e-03 | 2.58e-02 | 5 |
| GO:00017636 | Cervix | CC | morphogenesis of a branching structure | 37/2311 | 196/18723 | 5.36e-03 | 3.10e-02 | 37 |
| GO:00063381 | Cervix | CC | chromatin remodeling | 45/2311 | 255/18723 | 8.33e-03 | 4.30e-02 | 45 |
| GO:0061351 | Cervix | CC | neural precursor cell proliferation | 28/2311 | 145/18723 | 1.04e-02 | 4.97e-02 | 28 |
| GO:0006325 | Colorectum | AD | chromatin organization | 119/3918 | 409/18723 | 4.85e-05 | 8.33e-04 | 119 |
| GO:0016358 | Colorectum | AD | dendrite development | 69/3918 | 243/18723 | 3.32e-03 | 2.42e-02 | 69 |
| GO:0001763 | Colorectum | AD | morphogenesis of a branching structure | 56/3918 | 196/18723 | 6.60e-03 | 4.09e-02 | 56 |
| GO:0006338 | Colorectum | AD | chromatin remodeling | 70/3918 | 255/18723 | 7.44e-03 | 4.53e-02 | 70 |
| GO:00163581 | Colorectum | SER | dendrite development | 58/2897 | 243/18723 | 3.82e-04 | 5.81e-03 | 58 |
| GO:00063251 | Colorectum | SER | chromatin organization | 89/2897 | 409/18723 | 4.15e-04 | 6.17e-03 | 89 |
| GO:0048813 | Colorectum | SER | dendrite morphogenesis | 36/2897 | 146/18723 | 2.51e-03 | 2.33e-02 | 36 |
| GO:00063252 | Colorectum | MSS | chromatin organization | 107/3467 | 409/18723 | 7.22e-05 | 1.21e-03 | 107 |
| GO:00017631 | Colorectum | MSS | morphogenesis of a branching structure | 55/3467 | 196/18723 | 6.70e-04 | 7.25e-03 | 55 |
| GO:00163582 | Colorectum | MSS | dendrite development | 65/3467 | 243/18723 | 9.41e-04 | 9.50e-03 | 65 |
| GO:00163583 | Colorectum | FAP | dendrite development | 59/2622 | 243/18723 | 1.19e-05 | 3.31e-04 | 59 |
| GO:00063253 | Colorectum | FAP | chromatin organization | 84/2622 | 409/18723 | 1.62e-04 | 2.47e-03 | 84 |
| GO:00488131 | Colorectum | FAP | dendrite morphogenesis | 37/2622 | 146/18723 | 1.90e-04 | 2.77e-03 | 37 |
| Page: 1 2 3 4 5 |
| Pathway ID | Tissue | Disease Stage | Description | Gene Ratio | Bg Ratio | pvalue | p.adjust | qvalue | Count |
| Page: 1 |
Top |
Cell-cell communication analysis |
| Identification of potential cell-cell interactions between two cell types and their ligand-receptor pairs for different disease states |
| Ligand | Receptor | LRpair | Pathway | Tissue | Disease Stage |
| Page: 1 |
Top |
Single-cell gene regulatory network inference analysis |
| Find out the significant the regulons (TFs) and the target genes of each regulon across cell types for different disease states |
| TF | Cell Type | Tissue | Disease Stage | Target Gene | RSS | Regulon Activity |
| ∗The dot plots of a searched regulon are shown for all cell subpopulations in each disease state of each tissue based on the regulon specific score inferred using pySCENIC and by calculating the average expression. |
| Page: 1 |
Top |
Somatic mutation of malignant transformation related genes |
| Annotation of somatic variants for genes involved in malignant transformation |
| Hugo Symbol | Variant Class | Variant Classification | dbSNP RS | HGVSc | HGVSp | HGVSp Short | SWISSPROT | BIOTYPE | SIFT | PolyPhen | Tumor Sample Barcode | Tissue | Histology | Sex | Age | Stage | Therapy Types | Drugs | Outcome |
| RERE | SNV | Missense_Mutation | novel | c.2113G>A | p.Asp705Asn | p.D705N | Q9P2R6 | protein_coding | deleterious_low_confidence(0.03) | probably_damaging(0.997) | TCGA-AN-A046-01 | Breast | breast invasive carcinoma | Female | >=65 | I/II | Unknown | Unknown | SD |
| RERE | SNV | Missense_Mutation | novel | c.4178N>A | p.Pro1393His | p.P1393H | Q9P2R6 | protein_coding | deleterious_low_confidence(0.04) | probably_damaging(0.996) | TCGA-AO-A03P-01 | Breast | breast invasive carcinoma | Female | <65 | I/II | Hormone Therapy | letrozole | PD |
| RERE | SNV | Missense_Mutation | c.4471C>T | p.Arg1491Cys | p.R1491C | Q9P2R6 | protein_coding | deleterious_low_confidence(0) | probably_damaging(0.999) | TCGA-BH-A18G-01 | Breast | breast invasive carcinoma | Female | >=65 | I/II | Unknown | Unknown | SD | |
| RERE | SNV | Missense_Mutation | c.532N>A | p.Asp178Asn | p.D178N | Q9P2R6 | protein_coding | deleterious_low_confidence(0) | probably_damaging(0.997) | TCGA-BH-A204-01 | Breast | breast invasive carcinoma | Female | >=65 | I/II | Unknown | Unknown | SD | |
| RERE | SNV | Missense_Mutation | c.2135C>A | p.Ser712Tyr | p.S712Y | Q9P2R6 | protein_coding | deleterious_low_confidence(0) | probably_damaging(0.998) | TCGA-BH-A208-01 | Breast | breast invasive carcinoma | Female | <65 | I/II | Unknown | Unknown | SD | |
| RERE | SNV | Missense_Mutation | c.2006N>G | p.Thr669Arg | p.T669R | Q9P2R6 | protein_coding | tolerated_low_confidence(0.17) | benign(0.247) | TCGA-D8-A1X9-01 | Breast | breast invasive carcinoma | Female | >=65 | I/II | Chemotherapy | adriamycin+cyclophosphamide | SD | |
| RERE | SNV | Missense_Mutation | novel | c.1681G>A | p.Glu561Lys | p.E561K | Q9P2R6 | protein_coding | deleterious(0.01) | possibly_damaging(0.622) | TCGA-PE-A5DE-01 | Breast | breast invasive carcinoma | Female | <65 | I/II | Chemotherapy | taxotere | CR |
| RERE | SNV | Missense_Mutation | rs755330175 | c.3517N>A | p.Glu1173Lys | p.E1173K | Q9P2R6 | protein_coding | deleterious_low_confidence(0) | possibly_damaging(0.64) | TCGA-DR-A0ZM-01 | Cervix | cervical & endocervical cancer | Female | <65 | III/IV | Unspecific | Cisplatin | SD |
| RERE | SNV | Missense_Mutation | c.1343N>A | p.Arg448Gln | p.R448Q | Q9P2R6 | protein_coding | deleterious(0.04) | probably_damaging(0.978) | TCGA-EA-A410-01 | Cervix | cervical & endocervical cancer | Female | <65 | I/II | Unknown | Unknown | SD | |
| RERE | SNV | Missense_Mutation | novel | c.66N>C | p.Glu22Asp | p.E22D | Q9P2R6 | protein_coding | tolerated_low_confidence(0.08) | benign(0.003) | TCGA-HM-A4S6-01 | Cervix | cervical & endocervical cancer | Female | <65 | III/IV | Chemotherapy | cisplatin | CR |
| Page: 1 2 3 4 5 6 7 8 9 10 11 12 13 14 |
Top |
Related drugs of malignant transformation related genes |
| Identification of chemicals and drugs interact with genes involved in malignant transfromation |
| (DGIdb 4.0) |
| Entrez ID | Symbol | Category | Interaction Types | Drug Claim Name | Drug Name | PMIDs |
| Page: 1 |

Copyright 2023-Present -The University of Texas Health Science Center at Houston |