| Tissue | Expression Dynamics | Abbreviation |
| Colorectum (GSE201348) |  | FAP: Familial adenomatous polyposis |
| CRC: Colorectal cancer |
| Colorectum (HTA11) | 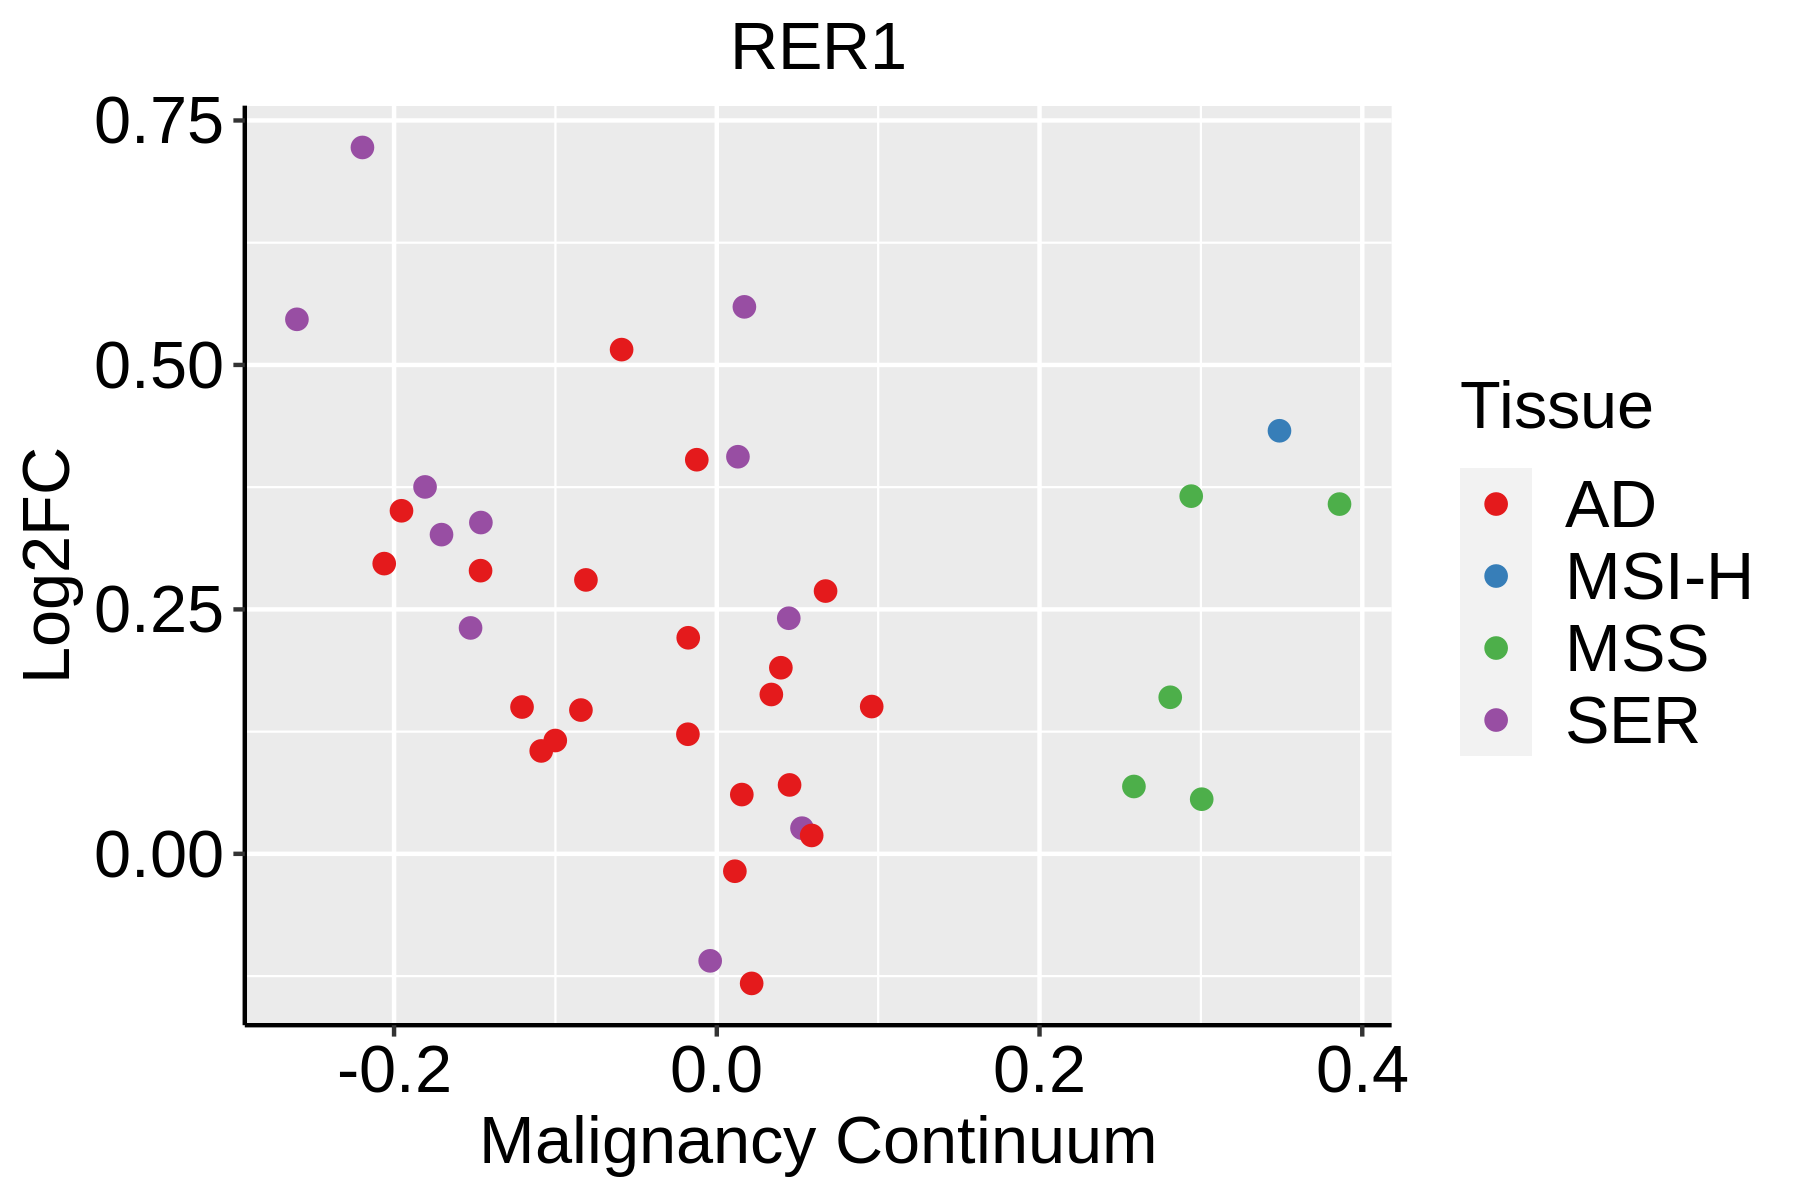 | AD: Adenomas |
| SER: Sessile serrated lesions |
| MSI-H: Microsatellite-high colorectal cancer |
| MSS: Microsatellite stable colorectal cancer |
| Endometrium | 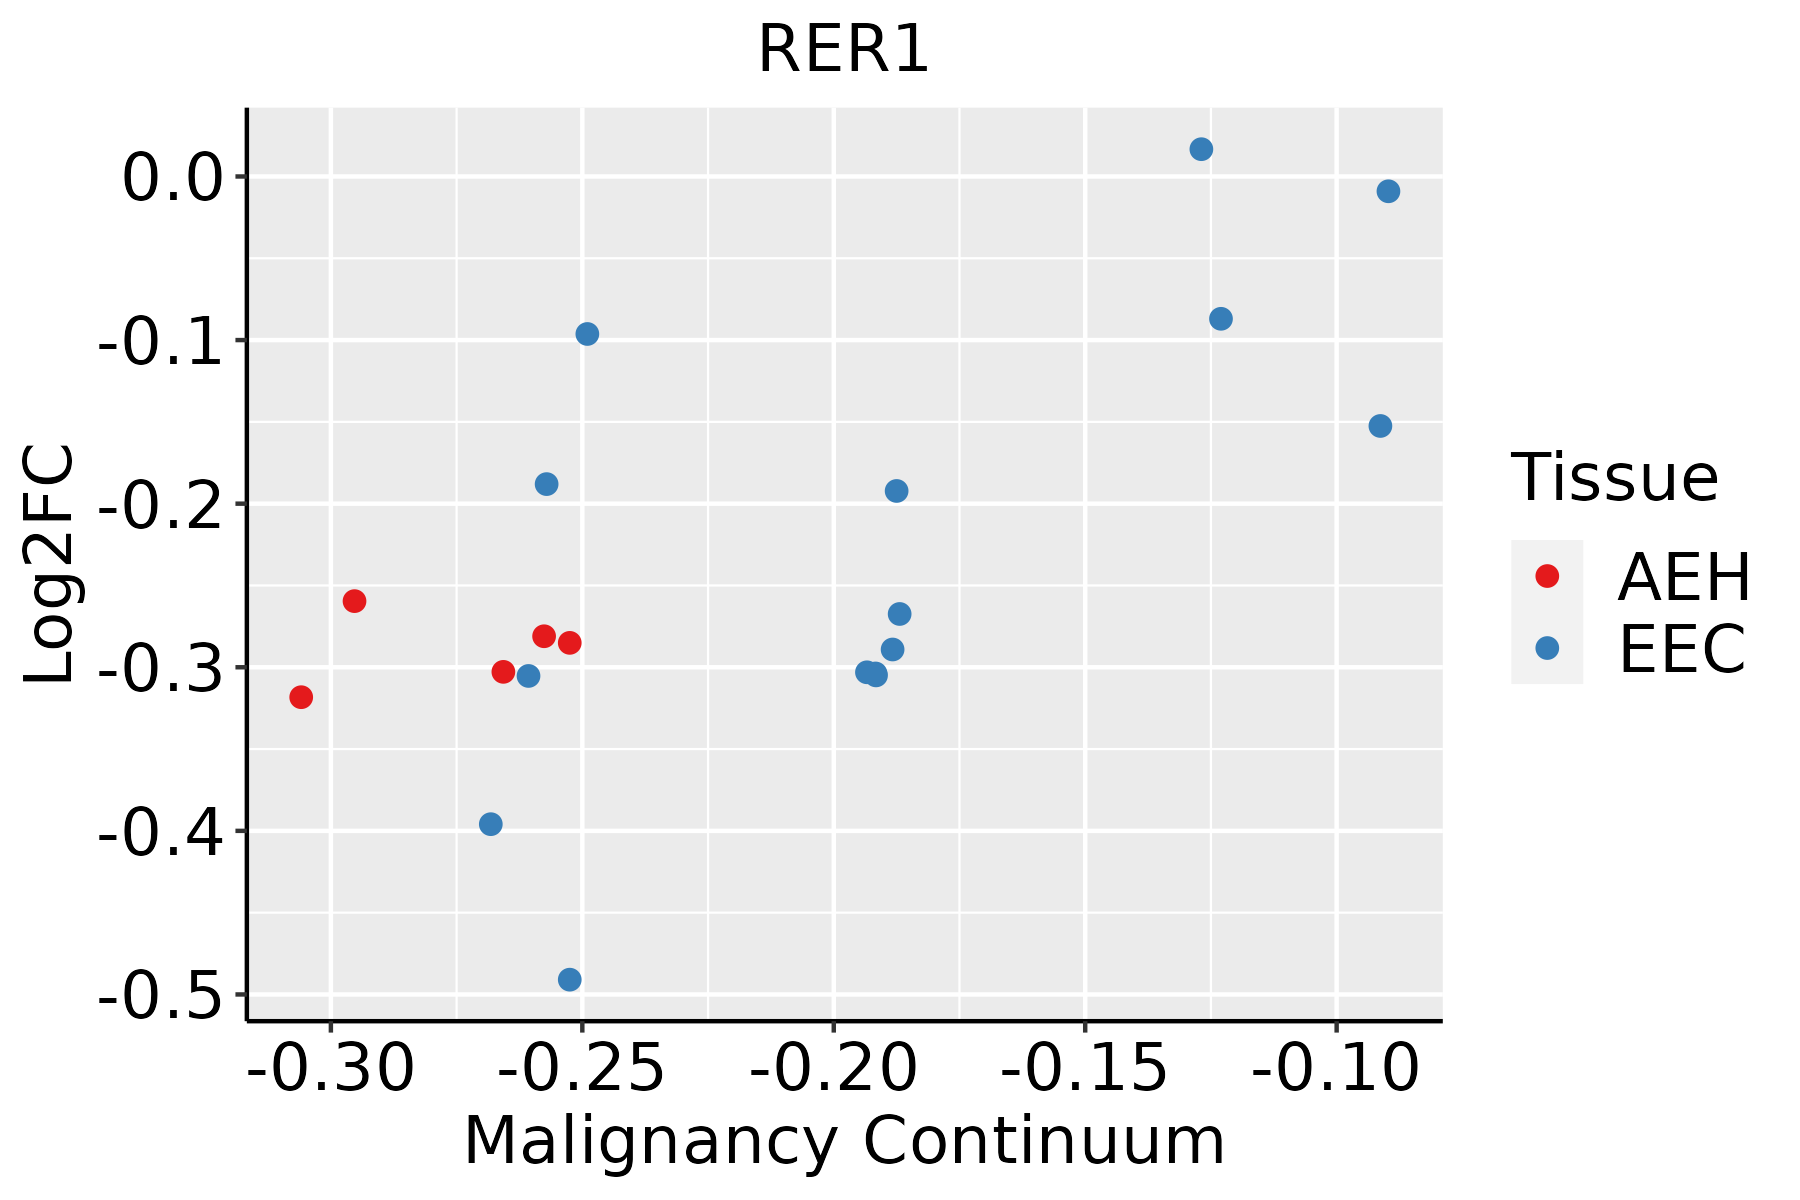 | AEH: Atypical endometrial hyperplasia |
| EEC: Endometrioid Cancer |
| Esophagus | 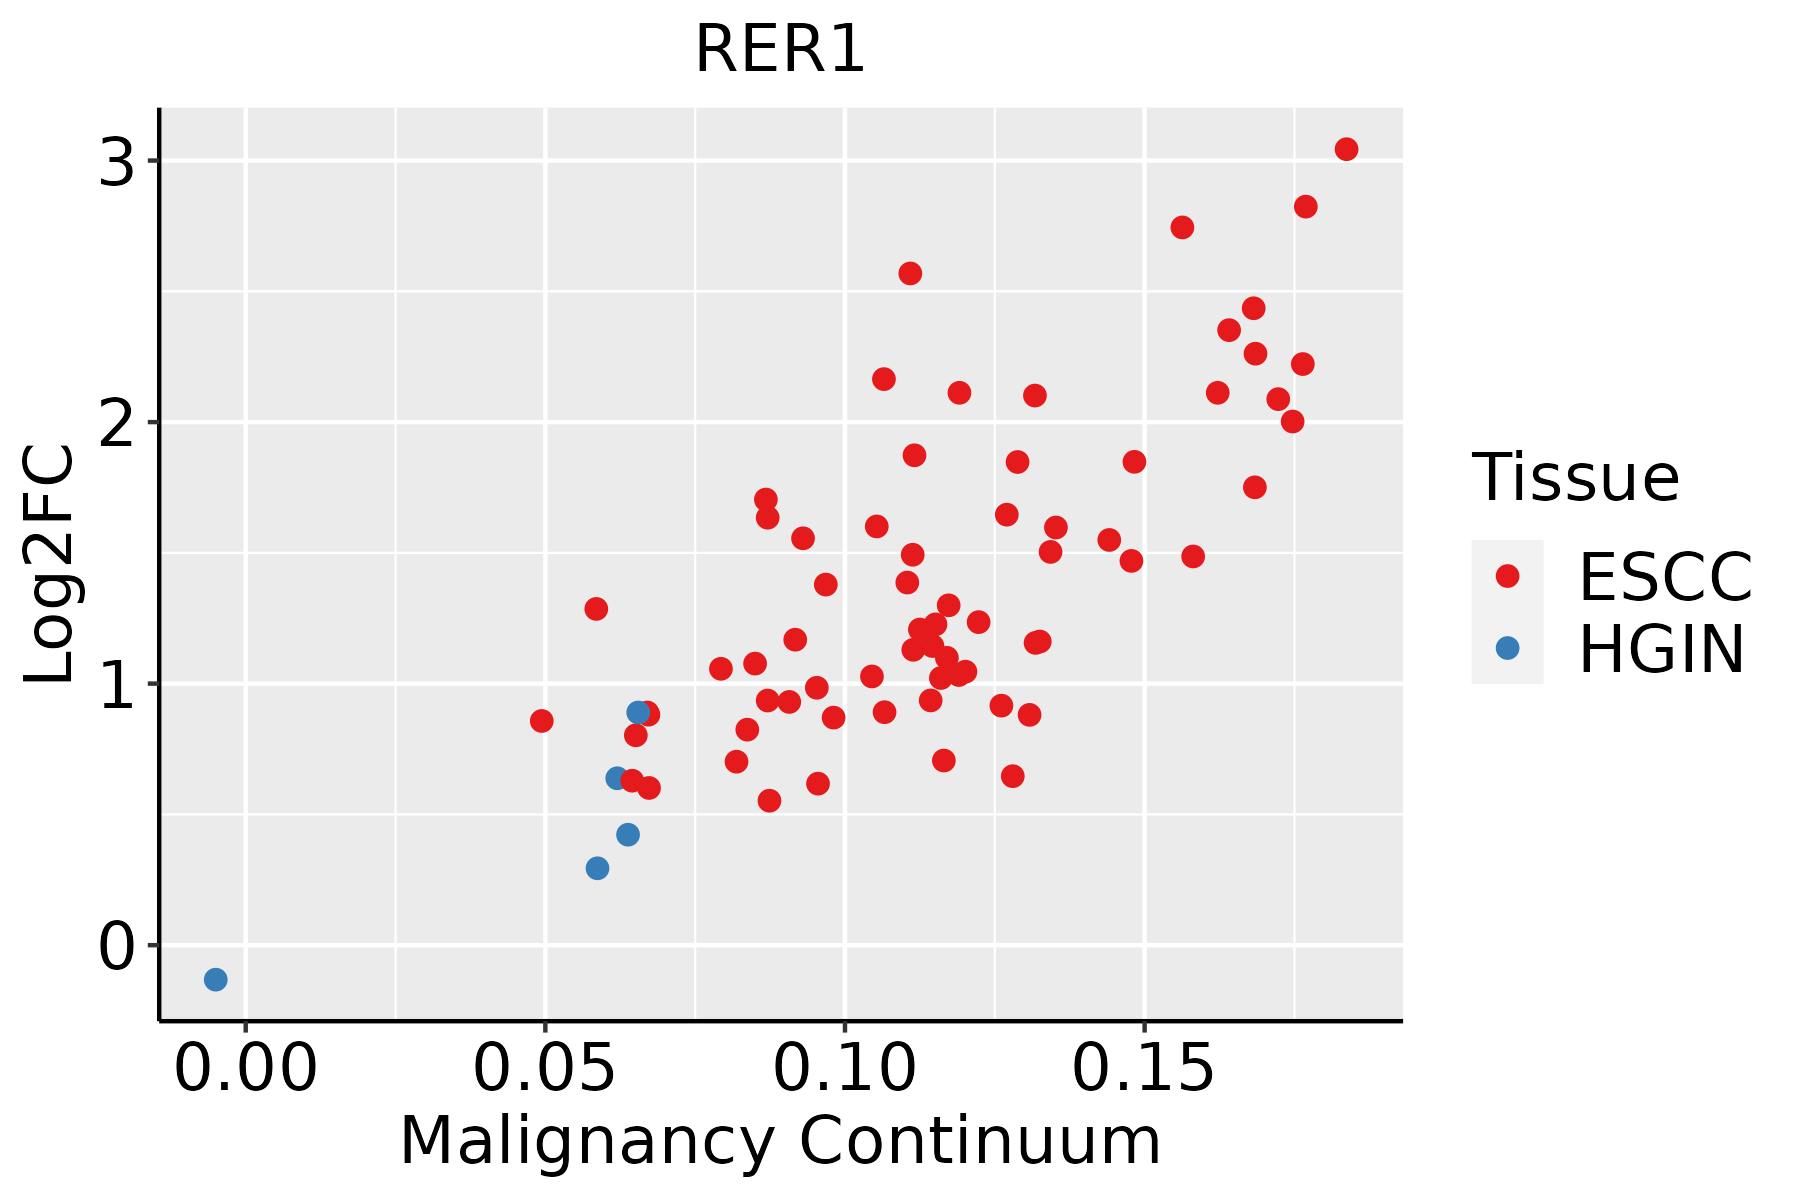 | ESCC: Esophageal squamous cell carcinoma |
| HGIN: High-grade intraepithelial neoplasias |
| LGIN: Low-grade intraepithelial neoplasias |
| Liver | 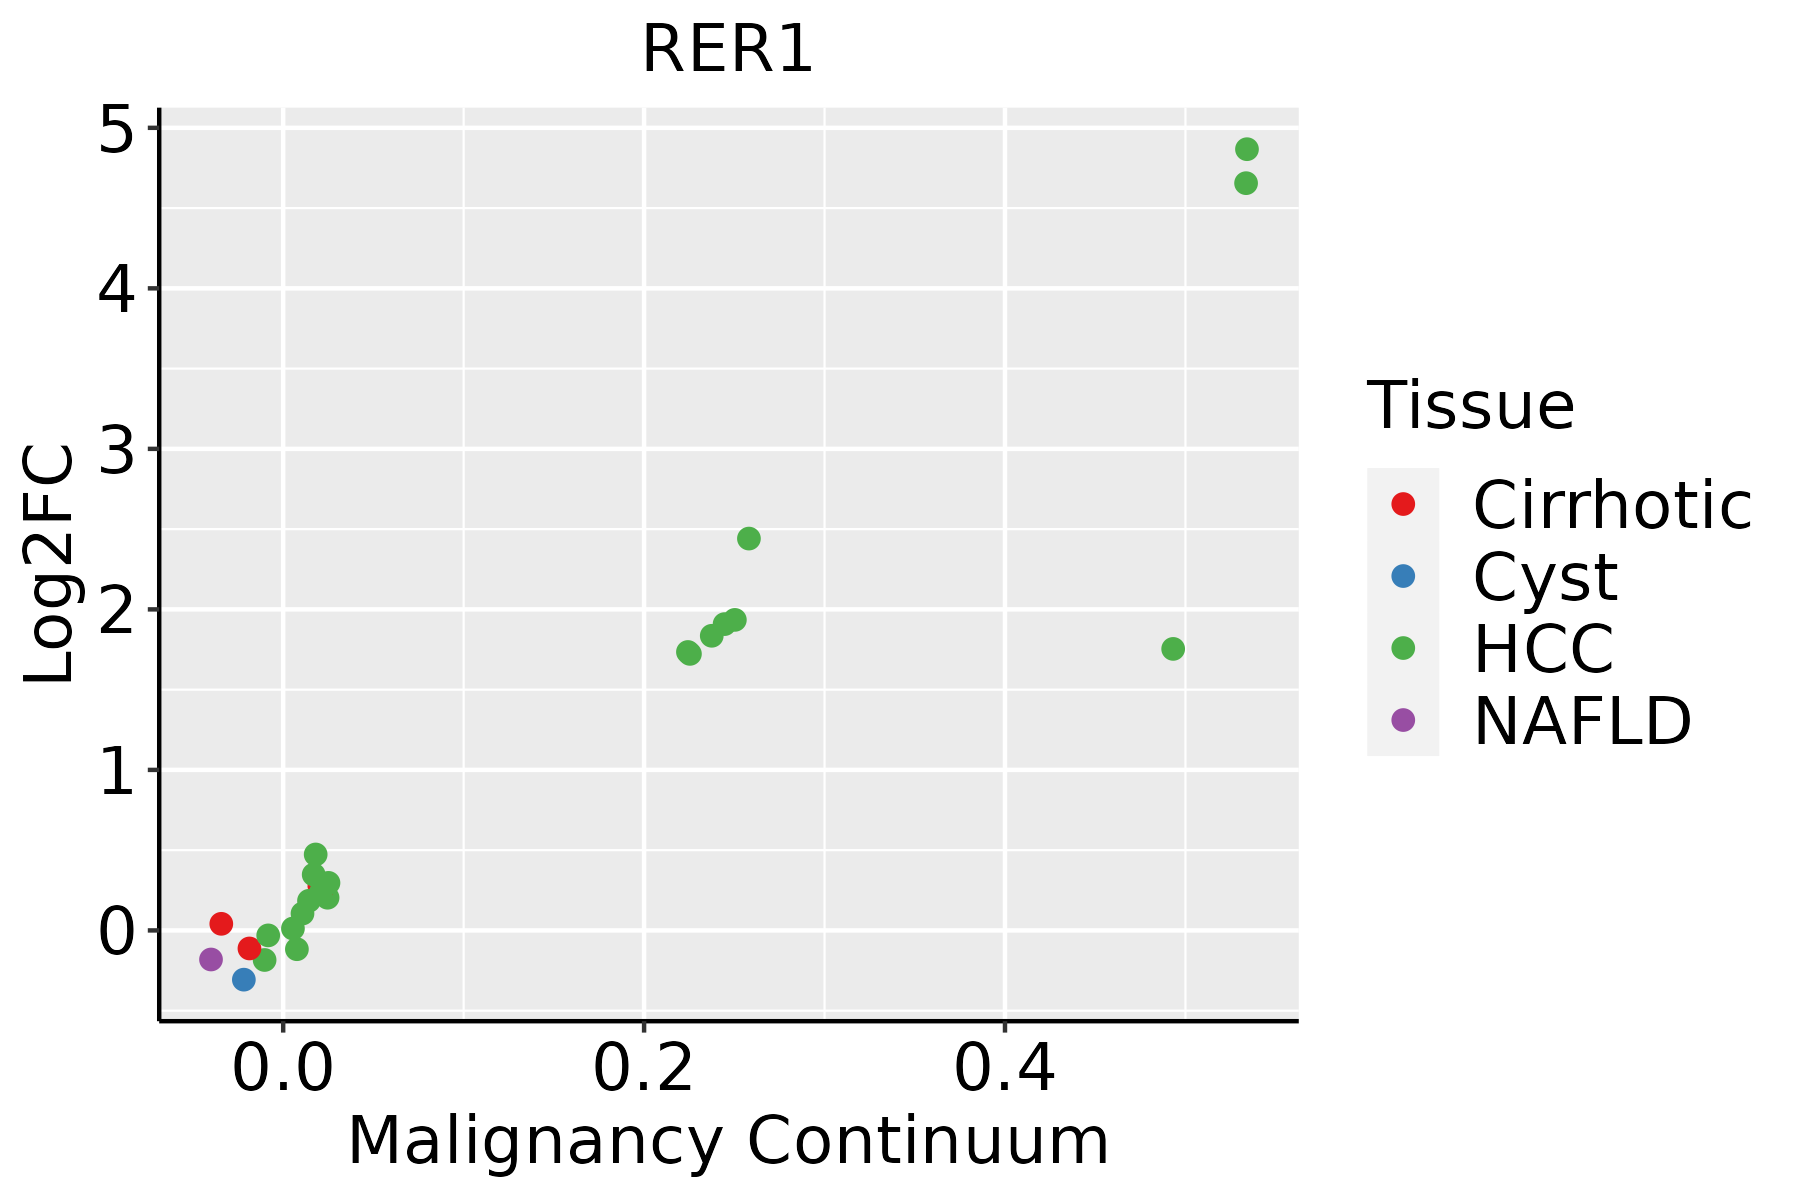 | HCC: Hepatocellular carcinoma |
| NAFLD: Non-alcoholic fatty liver disease |
| Oral Cavity |  | EOLP: Erosive Oral lichen planus |
| LP: leukoplakia |
| NEOLP: Non-erosive oral lichen planus |
| OSCC: Oral squamous cell carcinoma |
| Prostate | 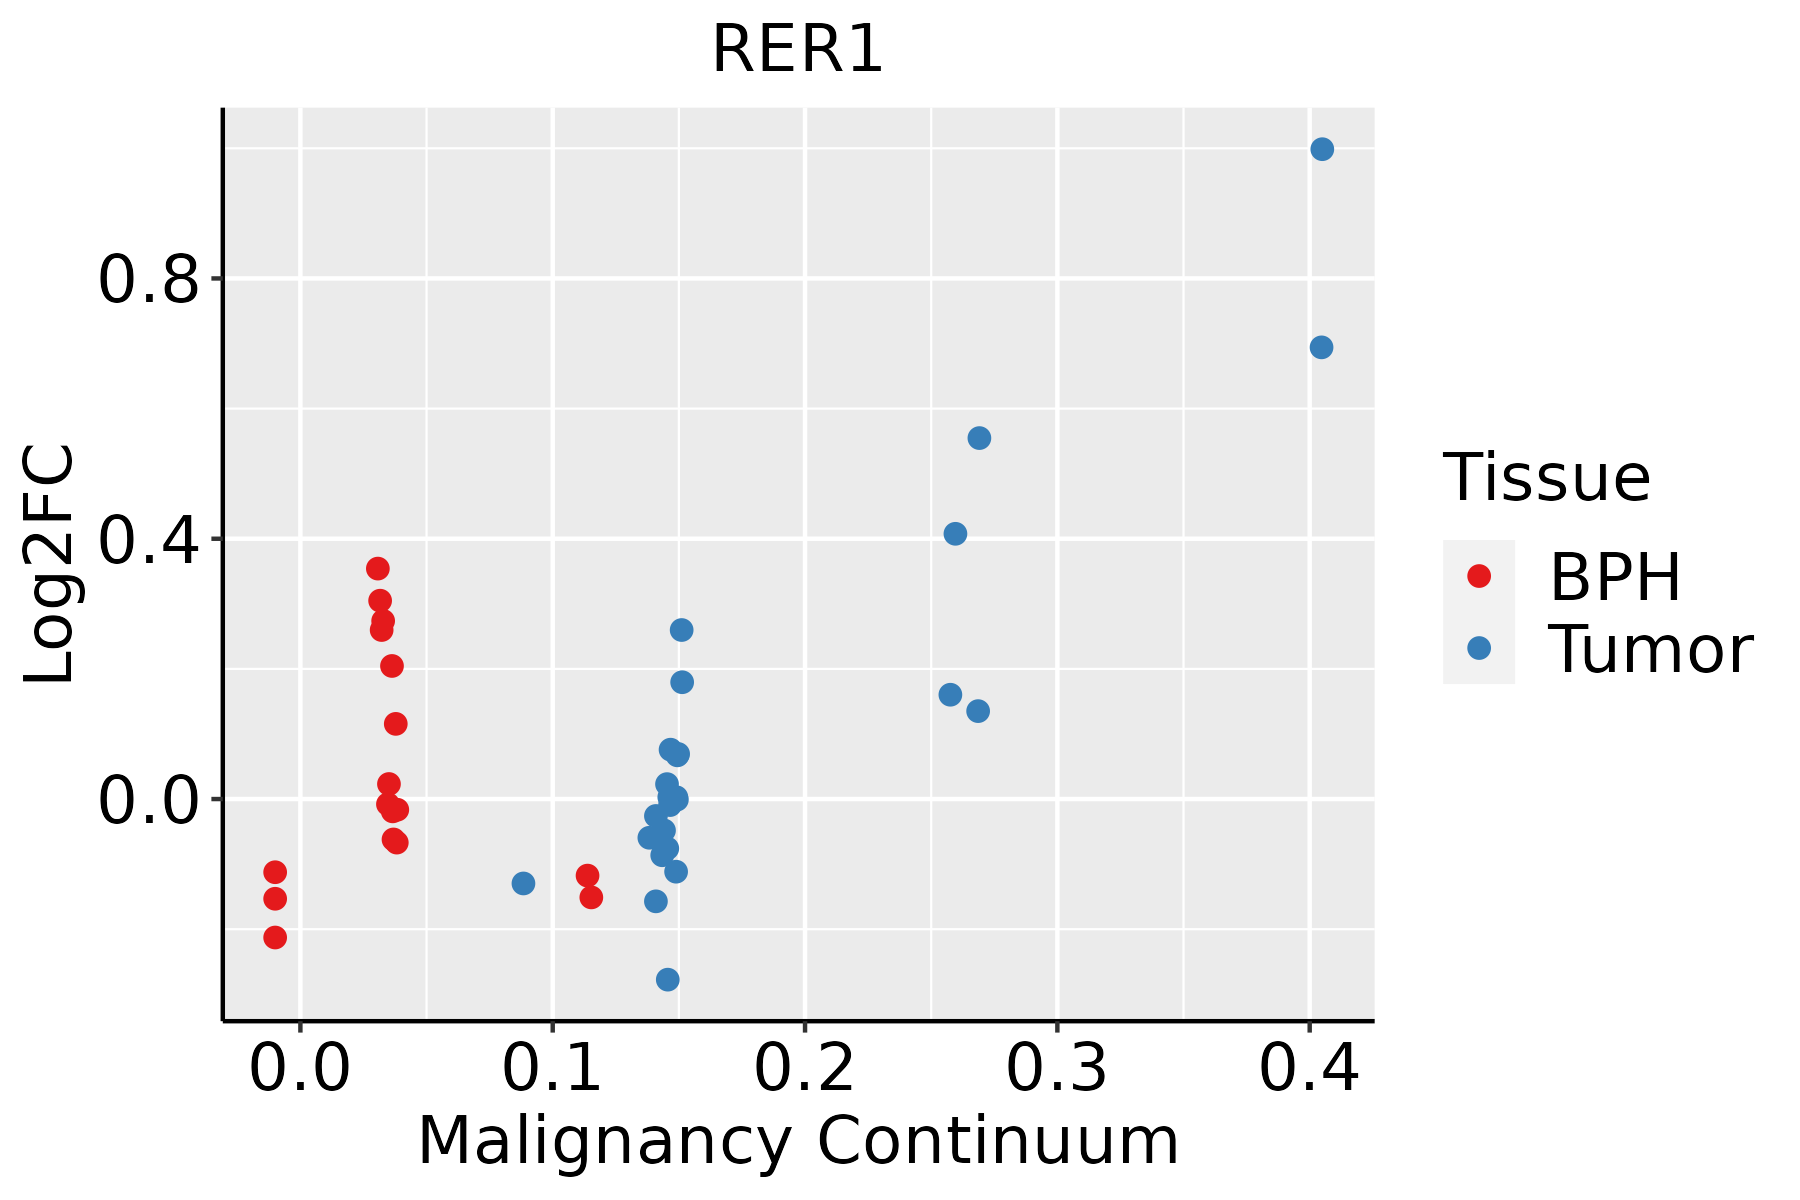 | BPH: Benign Prostatic Hyperplasia |
| Skin | 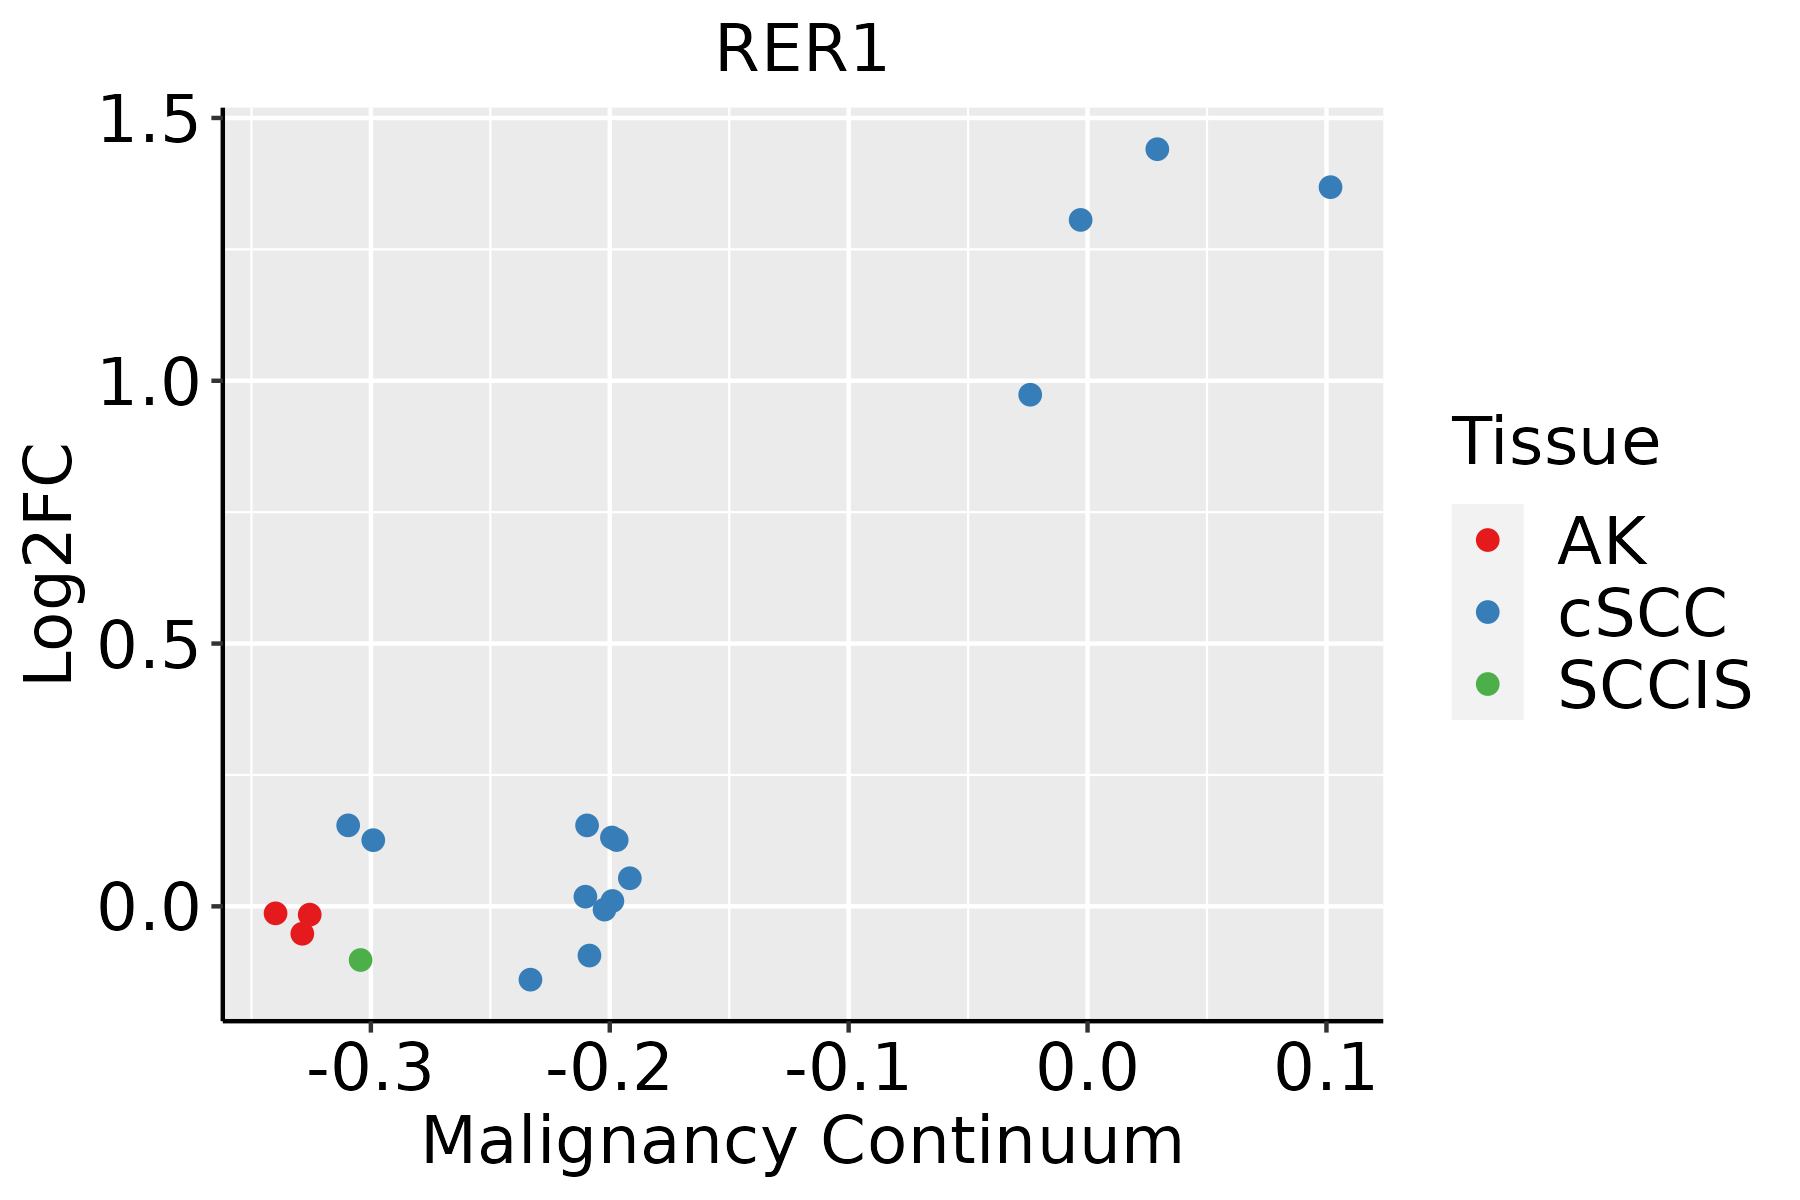 | AK: Actinic keratosis |
| cSCC: Cutaneous squamous cell carcinoma |
| SCCIS:squamous cell carcinoma in situ |
| Thyroid | 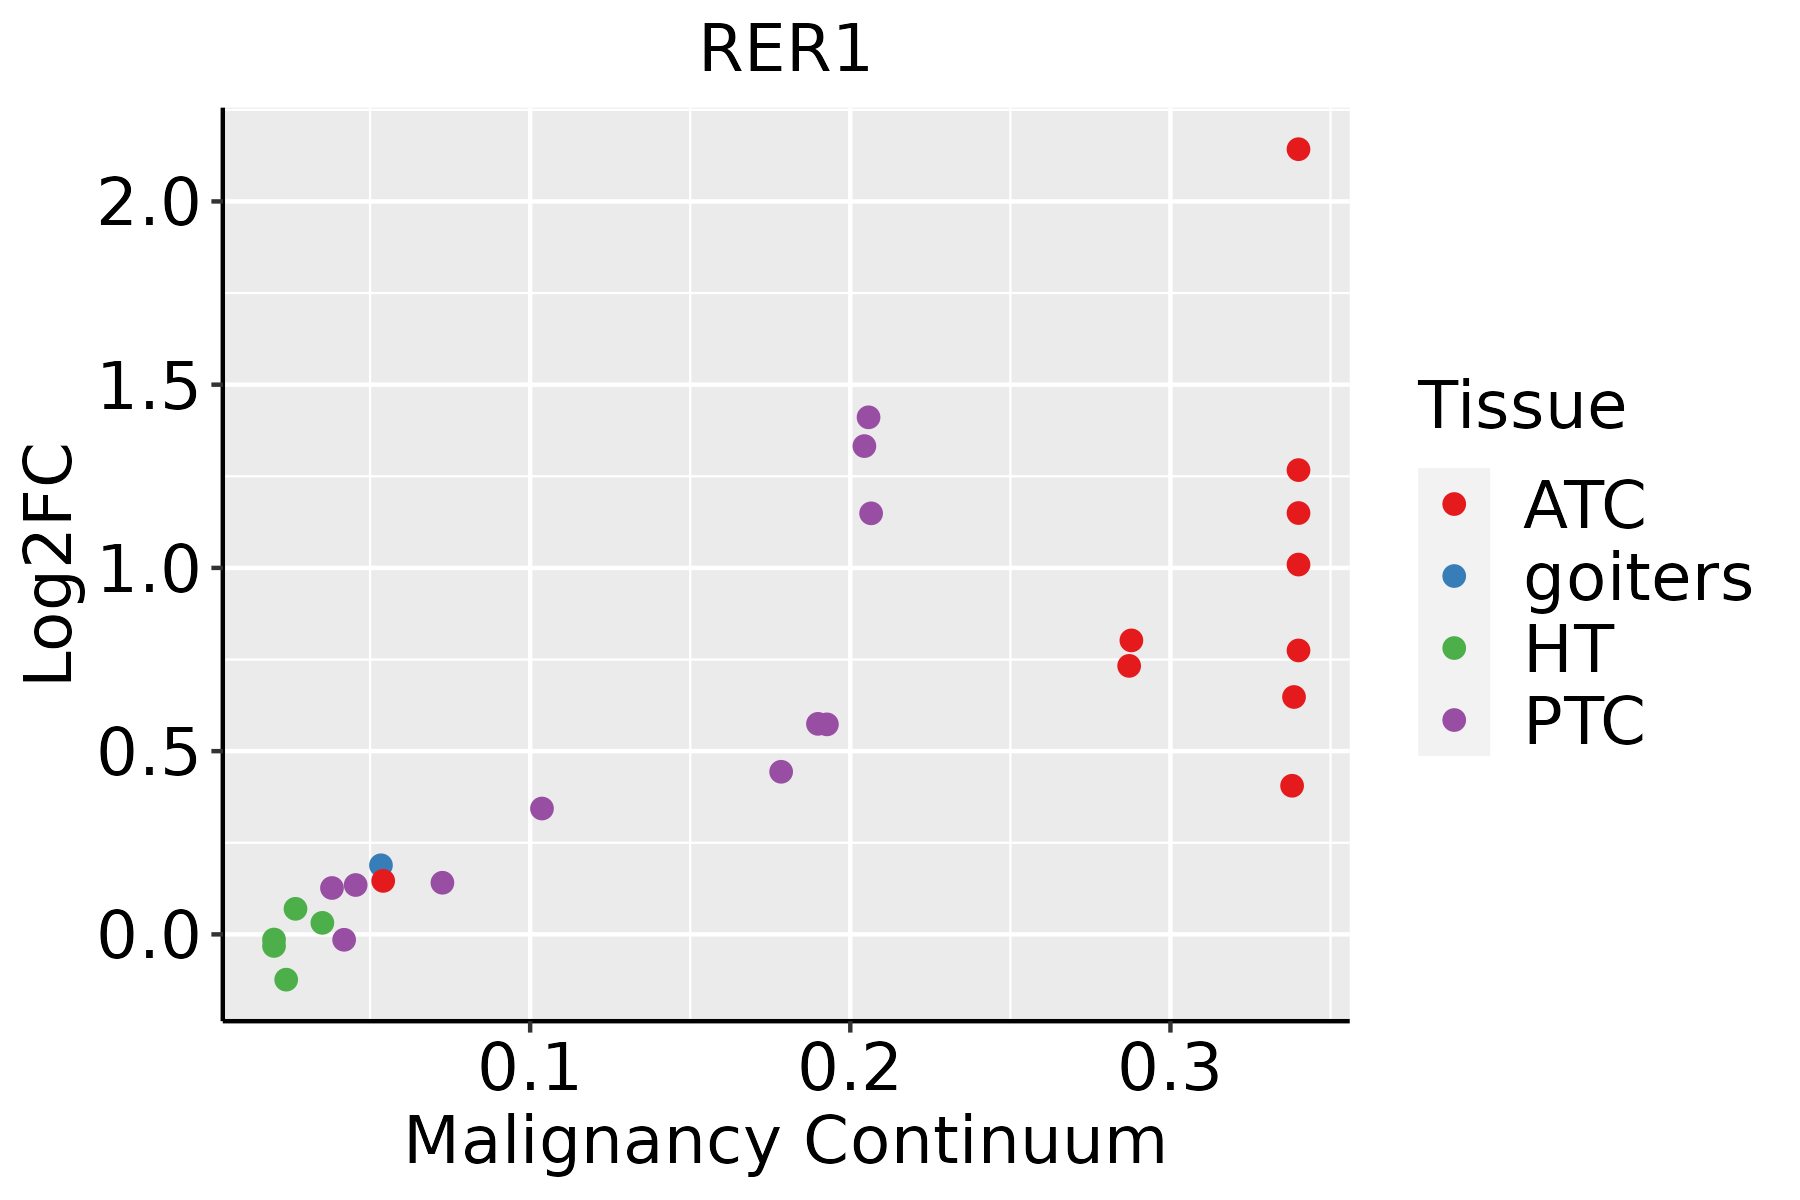 | ATC: Anaplastic thyroid cancer |
| HT: Hashimoto's thyroiditis |
| PTC: Papillary thyroid cancer |
| GO ID | Tissue | Disease Stage | Description | Gene Ratio | Bg Ratio | pvalue | p.adjust | Count |
| GO:0072659 | Colorectum | AD | protein localization to plasma membrane | 122/3918 | 284/18723 | 2.86e-17 | 1.49e-14 | 122 |
| GO:1990778 | Colorectum | AD | protein localization to cell periphery | 129/3918 | 333/18723 | 5.51e-14 | 1.15e-11 | 129 |
| GO:1903829 | Colorectum | AD | positive regulation of cellular protein localization | 110/3918 | 276/18723 | 4.58e-13 | 8.44e-11 | 110 |
| GO:0048193 | Colorectum | AD | Golgi vesicle transport | 109/3918 | 296/18723 | 1.80e-10 | 1.68e-08 | 109 |
| GO:1905475 | Colorectum | AD | regulation of protein localization to membrane | 73/3918 | 175/18723 | 3.37e-10 | 2.93e-08 | 73 |
| GO:1903076 | Colorectum | AD | regulation of protein localization to plasma membrane | 48/3918 | 104/18723 | 7.17e-09 | 4.36e-07 | 48 |
| GO:1904375 | Colorectum | AD | regulation of protein localization to cell periphery | 54/3918 | 125/18723 | 1.52e-08 | 9.00e-07 | 54 |
| GO:1905477 | Colorectum | AD | positive regulation of protein localization to membrane | 46/3918 | 106/18723 | 1.47e-07 | 6.64e-06 | 46 |
| GO:0006890 | Colorectum | AD | retrograde vesicle-mediated transport, Golgi to endoplasmic reticulum | 27/3918 | 52/18723 | 7.67e-07 | 2.70e-05 | 27 |
| GO:1903078 | Colorectum | AD | positive regulation of protein localization to plasma membrane | 28/3918 | 62/18723 | 1.57e-05 | 3.34e-04 | 28 |
| GO:1904377 | Colorectum | AD | positive regulation of protein localization to cell periphery | 30/3918 | 69/18723 | 1.98e-05 | 4.05e-04 | 30 |
| GO:0032507 | Colorectum | AD | maintenance of protein location in cell | 25/3918 | 65/18723 | 9.12e-04 | 8.71e-03 | 25 |
| GO:0099173 | Colorectum | AD | postsynapse organization | 51/3918 | 168/18723 | 2.47e-03 | 1.90e-02 | 51 |
| GO:0070972 | Colorectum | AD | protein localization to endoplasmic reticulum | 26/3918 | 74/18723 | 3.28e-03 | 2.40e-02 | 26 |
| GO:0050808 | Colorectum | AD | synapse organization | 112/3918 | 426/18723 | 4.25e-03 | 2.92e-02 | 112 |
| GO:0051651 | Colorectum | AD | maintenance of location in cell | 61/3918 | 214/18723 | 5.02e-03 | 3.37e-02 | 61 |
| GO:0045185 | Colorectum | AD | maintenance of protein location | 30/3918 | 94/18723 | 8.26e-03 | 4.85e-02 | 30 |
| GO:00726591 | Colorectum | SER | protein localization to plasma membrane | 92/2897 | 284/18723 | 6.36e-13 | 1.86e-10 | 92 |
| GO:19038291 | Colorectum | SER | positive regulation of cellular protein localization | 86/2897 | 276/18723 | 3.61e-11 | 6.11e-09 | 86 |
| GO:19907781 | Colorectum | SER | protein localization to cell periphery | 98/2897 | 333/18723 | 6.09e-11 | 9.57e-09 | 98 |
| Hugo Symbol | Variant Class | Variant Classification | dbSNP RS | HGVSc | HGVSp | HGVSp Short | SWISSPROT | BIOTYPE | SIFT | PolyPhen | Tumor Sample Barcode | Tissue | Histology | Sex | Age | Stage | Therapy Types | Drugs | Outcome |
| RER1 | SNV | Missense_Mutation | novel | c.58A>G | p.Arg20Gly | p.R20G | O15258 | protein_coding | deleterious(0.04) | benign(0.122) | TCGA-AC-A23C-01 | Breast | breast invasive carcinoma | Female | <65 | I/II | Chemotherapy | chemo | CR |
| RER1 | insertion | Nonsense_Mutation | novel | c.359_360insCTG | p.Lys120delinsAsnTer | p.K120delinsN* | O15258 | protein_coding | | | TCGA-AN-A0FJ-01 | Breast | breast invasive carcinoma | Female | <65 | III/IV | Unknown | Unknown | SD |
| RER1 | insertion | Frame_Shift_Ins | novel | c.361_362insGGTTGCTCTGCCTTACAGATGACGGTCC | p.Phe121TrpfsTer60 | p.F121Wfs*60 | O15258 | protein_coding | | | TCGA-AN-A0FJ-01 | Breast | breast invasive carcinoma | Female | <65 | III/IV | Unknown | Unknown | SD |
| RER1 | deletion | Frame_Shift_Del | novel | c.348_349delNN | p.Pro117ArgfsTer3 | p.P117Rfs*3 | O15258 | protein_coding | | | TCGA-D8-A147-01 | Breast | breast invasive carcinoma | Female | <65 | I/II | Chemotherapy | doxorubicine | SD |
| RER1 | SNV | Missense_Mutation | novel | c.464T>C | p.Ile155Thr | p.I155T | O15258 | protein_coding | deleterious(0) | probably_damaging(0.915) | TCGA-CK-5913-01 | Colorectum | colon adenocarcinoma | Female | <65 | I/II | Unknown | Unknown | SD |
| RER1 | SNV | Missense_Mutation | rs746542852 | c.47C>T | p.Ser16Leu | p.S16L | O15258 | protein_coding | tolerated(0.2) | probably_damaging(0.915) | TCGA-G4-6304-01 | Colorectum | colon adenocarcinoma | Female | >=65 | I/II | Chemotherapy | fluorouracil | PD |
| RER1 | SNV | Missense_Mutation | novel | c.434N>C | p.Val145Ala | p.V145A | O15258 | protein_coding | deleterious(0) | probably_damaging(0.984) | TCGA-A5-A0G2-01 | Endometrium | uterine corpus endometrioid carcinoma | Female | <65 | III/IV | Unknown | Unknown | SD |
| RER1 | SNV | Missense_Mutation | novel | c.520T>C | p.Tyr174His | p.Y174H | O15258 | protein_coding | deleterious(0) | probably_damaging(0.999) | TCGA-A5-A1OF-01 | Endometrium | uterine corpus endometrioid carcinoma | Female | <65 | I/II | Unknown | Unknown | SD |
| RER1 | SNV | Missense_Mutation | rs567205815 | c.583G>A | p.Ala195Thr | p.A195T | O15258 | protein_coding | tolerated(0.15) | benign(0.001) | TCGA-AJ-A3BH-01 | Endometrium | uterine corpus endometrioid carcinoma | Female | Unknown | I/II | Unknown | Unknown | SD |
| RER1 | SNV | Missense_Mutation | | c.418G>A | p.Ala140Thr | p.A140T | O15258 | protein_coding | deleterious(0.05) | benign(0.196) | TCGA-AP-A051-01 | Endometrium | uterine corpus endometrioid carcinoma | Female | >=65 | I/II | Unknown | Unknown | SD |


