
|
|||||
|
 | |
| |
| |
| |
| |
| |
|
Gene: REPS2 |
Gene summary for REPS2 |
| Gene information | Species | Human | Gene symbol | REPS2 | Gene ID | 9185 |
| Gene name | RALBP1 associated Eps domain containing 2 | |
| Gene Alias | POB1 | |
| Cytomap | Xp22.2 | |
| Gene Type | protein-coding | GO ID | GO:0006810 | UniProtAcc | Q8NFH8 |
Top |
Malignant transformation analysis |
| Identification of the aberrant gene expression in precancerous and cancerous lesions by comparing the gene expression of stem-like cells in diseased tissues with normal stem cells |
| Entrez ID | Symbol | Replicates | Species | Organ | Tissue | Adj P-value | Log2FC | Malignancy |
| 9185 | REPS2 | 047563_1562-all-cells | Human | Prostate | BPH | 7.49e-03 | 1.86e-01 | 0.0791 |
| 9185 | REPS2 | 048752_1579-all-cells | Human | Prostate | BPH | 2.04e-23 | 5.43e-01 | 0.1008 |
| 9185 | REPS2 | 052095_1628-all-cells | Human | Prostate | BPH | 2.86e-11 | 4.01e-01 | 0.1032 |
| 9185 | REPS2 | 052097_1595-all-cells | Human | Prostate | BPH | 8.28e-38 | 7.37e-01 | 0.0972 |
| 9185 | REPS2 | 052099_1652-all-cells | Human | Prostate | BPH | 2.79e-21 | 4.80e-01 | 0.1038 |
| 9185 | REPS2 | Dong_P1 | Human | Prostate | Tumor | 1.27e-04 | 5.96e-02 | 0.035 |
| 9185 | REPS2 | GSM5353237_PA_PR5251_T2_S8_L001 | Human | Prostate | Tumor | 3.58e-02 | 4.95e-01 | 0.1622 |
| 9185 | REPS2 | GSM5353243_PA_PR5261_T1_S23_L002 | Human | Prostate | Tumor | 4.57e-04 | 3.56e-01 | 0.1545 |
| Page: 1 |
| Tissue | Expression Dynamics | Abbreviation |
| Prostate | 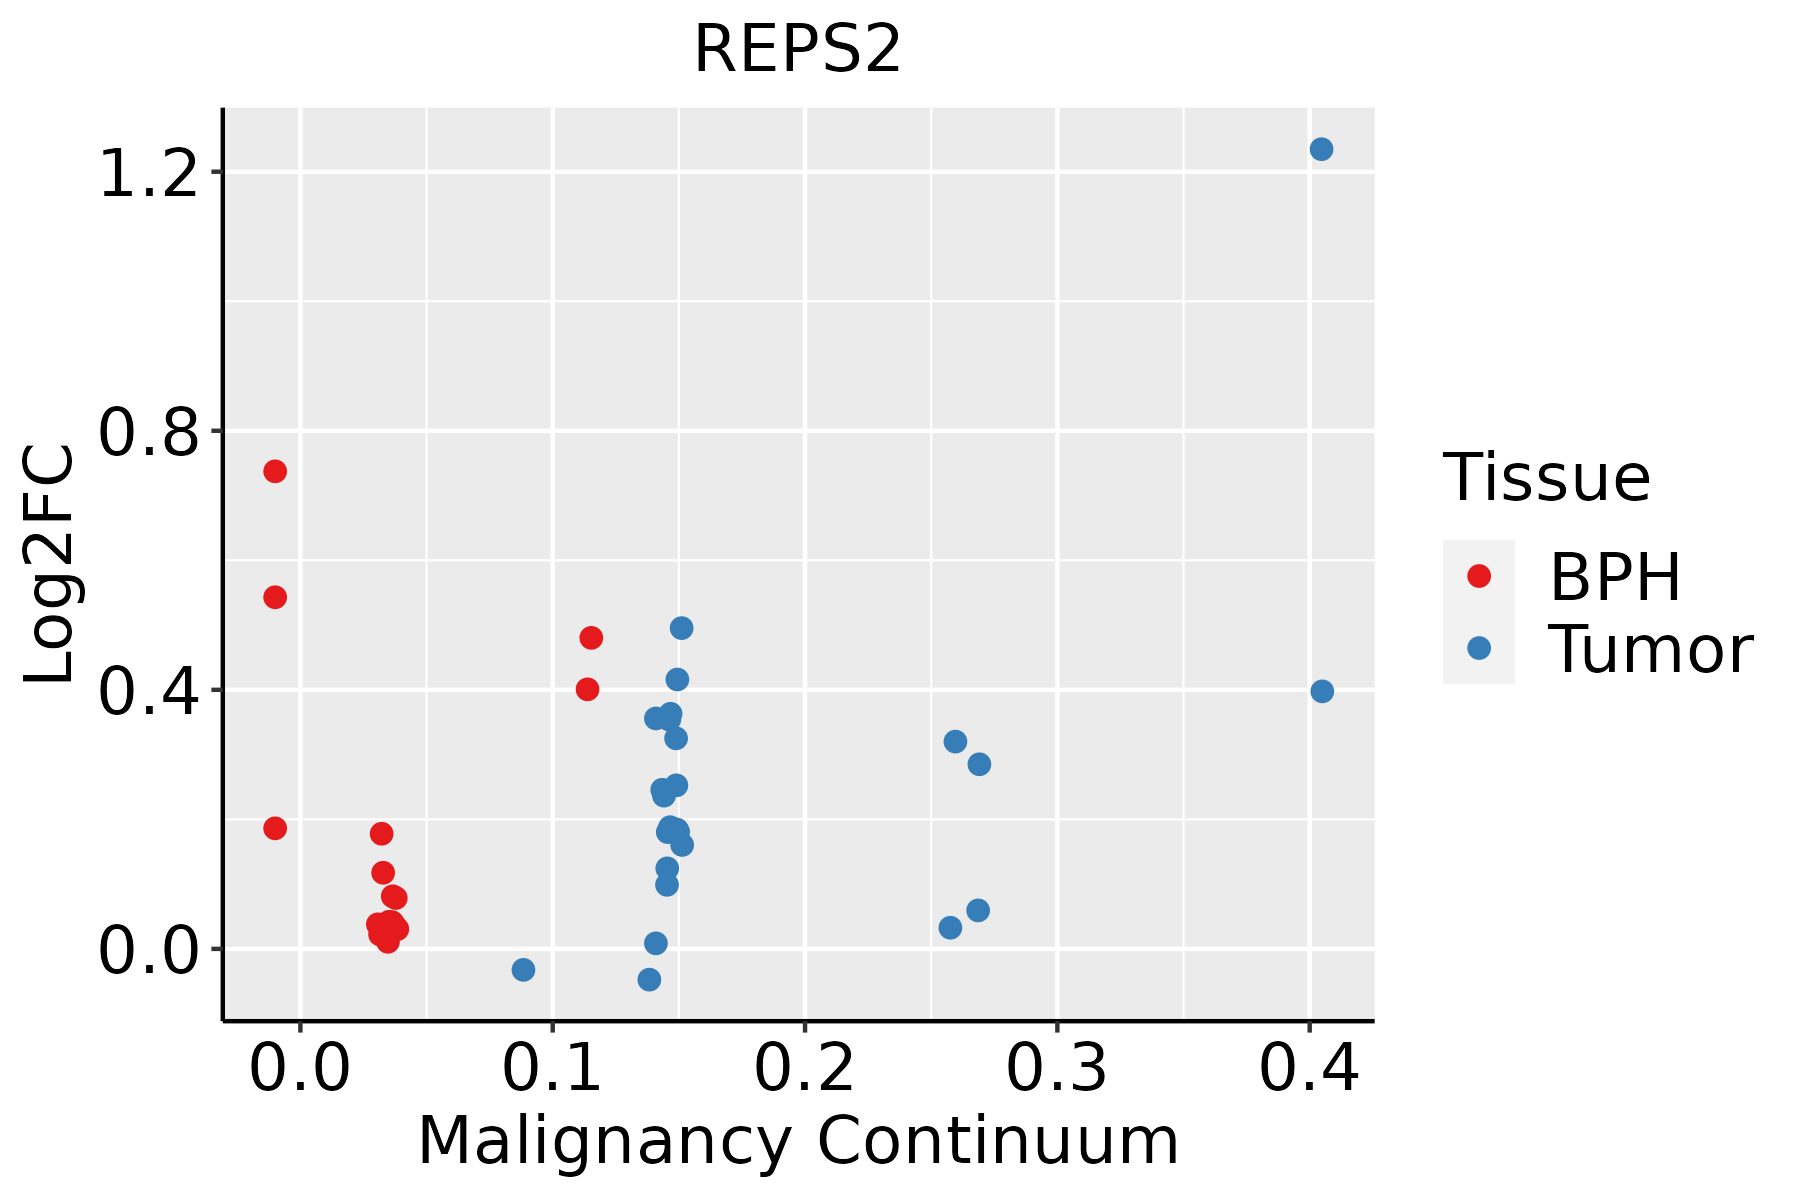 | BPH: Benign Prostatic Hyperplasia |
| ∗log2FC in expression of this searched gene in stem-like cells from each diseased tissue sample relative to stem-like cells in normal samples in each tissue plotted against the malignancy continuum. Samples are colored based on if they are from different disease stage. |
Top |
Malignant transformation related pathway analysis |
| Find out the enriched GO biological processes and KEGG pathways involved in transition from healthy to precancer to cancer |
| Tissue | Disease Stage | Enriched GO biological Processes |
| Colorectum | AD |  |
| Colorectum | SER |  |
| Colorectum | MSS |  |
| Colorectum | MSI-H |  |
| Colorectum | FAP |  |
| ∗Top 15 enriched GO BP terms are showed in the bar plot of each disease state in each tissue. Each row represents a significant GO biological process which is colored according to the -log10(p.adjust). |
| Page: 1 2 3 4 5 6 7 8 9 |
| GO ID | Tissue | Disease Stage | Description | Gene Ratio | Bg Ratio | pvalue | p.adjust | Count |
| GO:003812710 | Prostate | BPH | ERBB signaling pathway | 39/3107 | 121/18723 | 1.69e-05 | 2.11e-04 | 39 |
| GO:00161978 | Prostate | BPH | endosomal transport | 62/3107 | 230/18723 | 4.54e-05 | 4.77e-04 | 62 |
| GO:000717310 | Prostate | BPH | epidermal growth factor receptor signaling pathway | 34/3107 | 108/18723 | 9.70e-05 | 9.04e-04 | 34 |
| GO:001619713 | Prostate | Tumor | endosomal transport | 62/3246 | 230/18723 | 1.65e-04 | 1.47e-03 | 62 |
| GO:003812714 | Prostate | Tumor | ERBB signaling pathway | 37/3246 | 121/18723 | 2.42e-04 | 2.05e-03 | 37 |
| GO:000717314 | Prostate | Tumor | epidermal growth factor receptor signaling pathway | 32/3246 | 108/18723 | 1.12e-03 | 7.14e-03 | 32 |
| Page: 1 |
| Pathway ID | Tissue | Disease Stage | Description | Gene Ratio | Bg Ratio | pvalue | p.adjust | qvalue | Count |
| Page: 1 |
Top |
Cell-cell communication analysis |
| Identification of potential cell-cell interactions between two cell types and their ligand-receptor pairs for different disease states |
| Ligand | Receptor | LRpair | Pathway | Tissue | Disease Stage |
| Page: 1 |
Top |
Single-cell gene regulatory network inference analysis |
| Find out the significant the regulons (TFs) and the target genes of each regulon across cell types for different disease states |
| TF | Cell Type | Tissue | Disease Stage | Target Gene | RSS | Regulon Activity |
| ∗The dot plots of a searched regulon are shown for all cell subpopulations in each disease state of each tissue based on the regulon specific score inferred using pySCENIC and by calculating the average expression. |
| Page: 1 |
Top |
Somatic mutation of malignant transformation related genes |
| Annotation of somatic variants for genes involved in malignant transformation |
| Hugo Symbol | Variant Class | Variant Classification | dbSNP RS | HGVSc | HGVSp | HGVSp Short | SWISSPROT | BIOTYPE | SIFT | PolyPhen | Tumor Sample Barcode | Tissue | Histology | Sex | Age | Stage | Therapy Types | Drugs | Outcome |
| REPS2 | SNV | Missense_Mutation | novel | c.1469N>C | p.Arg490Thr | p.R490T | Q8NFH8 | protein_coding | deleterious(0) | probably_damaging(0.994) | TCGA-3C-AALI-01 | Breast | breast invasive carcinoma | Female | <65 | I/II | Unspecific | Poly E | Complete Response |
| REPS2 | SNV | Missense_Mutation | novel | c.1135N>A | p.Asp379Asn | p.D379N | Q8NFH8 | protein_coding | deleterious(0.03) | benign(0.075) | TCGA-AC-A23H-01 | Breast | breast invasive carcinoma | Female | >=65 | I/II | Unknown | Unknown | PD |
| REPS2 | SNV | Missense_Mutation | c.890C>T | p.Pro297Leu | p.P297L | Q8NFH8 | protein_coding | tolerated(1) | benign(0.014) | TCGA-BH-A0HF-01 | Breast | breast invasive carcinoma | Female | >=65 | I/II | Hormone Therapy | arimidex | SD | |
| REPS2 | SNV | Missense_Mutation | c.761C>T | p.Ser254Phe | p.S254F | Q8NFH8 | protein_coding | deleterious(0) | probably_damaging(0.926) | TCGA-EW-A1J5-01 | Breast | breast invasive carcinoma | Female | <65 | I/II | Chemotherapy | adriamycin | SD | |
| REPS2 | SNV | Missense_Mutation | novel | c.1381N>G | p.Ser461Ala | p.S461A | Q8NFH8 | protein_coding | deleterious(0.02) | possibly_damaging(0.675) | TCGA-EA-A3HU-01 | Cervix | cervical & endocervical cancer | Female | <65 | I/II | Unknown | Unknown | SD |
| REPS2 | SNV | Missense_Mutation | c.1367N>A | p.Arg456Lys | p.R456K | Q8NFH8 | protein_coding | tolerated(0.28) | possibly_damaging(0.6) | TCGA-JX-A3Q0-01 | Cervix | cervical & endocervical cancer | Female | <65 | III/IV | Unknown | Unknown | SD | |
| REPS2 | SNV | Missense_Mutation | rs750209945 | c.1963N>T | p.Arg655Cys | p.R655C | Q8NFH8 | protein_coding | deleterious(0) | probably_damaging(0.997) | TCGA-AA-3984-01 | Colorectum | colon adenocarcinoma | Female | <65 | I/II | Unknown | Unknown | SD |
| REPS2 | SNV | Missense_Mutation | c.325N>C | p.Phe109Leu | p.F109L | Q8NFH8 | protein_coding | deleterious(0) | probably_damaging(0.985) | TCGA-AA-A010-01 | Colorectum | colon adenocarcinoma | Female | <65 | I/II | Chemotherapy | folinic | CR | |
| REPS2 | SNV | Missense_Mutation | rs772735900 | c.376N>T | p.Arg126Trp | p.R126W | Q8NFH8 | protein_coding | deleterious(0) | probably_damaging(0.94) | TCGA-AM-5821-01 | Colorectum | colon adenocarcinoma | Female | >=65 | I/II | Unknown | Unknown | SD |
| REPS2 | SNV | Missense_Mutation | novel | c.989A>G | p.Asp330Gly | p.D330G | Q8NFH8 | protein_coding | deleterious(0) | probably_damaging(1) | TCGA-AZ-4315-01 | Colorectum | colon adenocarcinoma | Male | <65 | I/II | Unknown | Unknown | SD |
| Page: 1 2 3 4 5 6 7 |
Top |
Related drugs of malignant transformation related genes |
| Identification of chemicals and drugs interact with genes involved in malignant transfromation |
| (DGIdb 4.0) |
| Entrez ID | Symbol | Category | Interaction Types | Drug Claim Name | Drug Name | PMIDs |
| Page: 1 |

Copyright 2023-Present -The University of Texas Health Science Center at Houston |