| Tissue | Expression Dynamics | Abbreviation |
| Cervix | 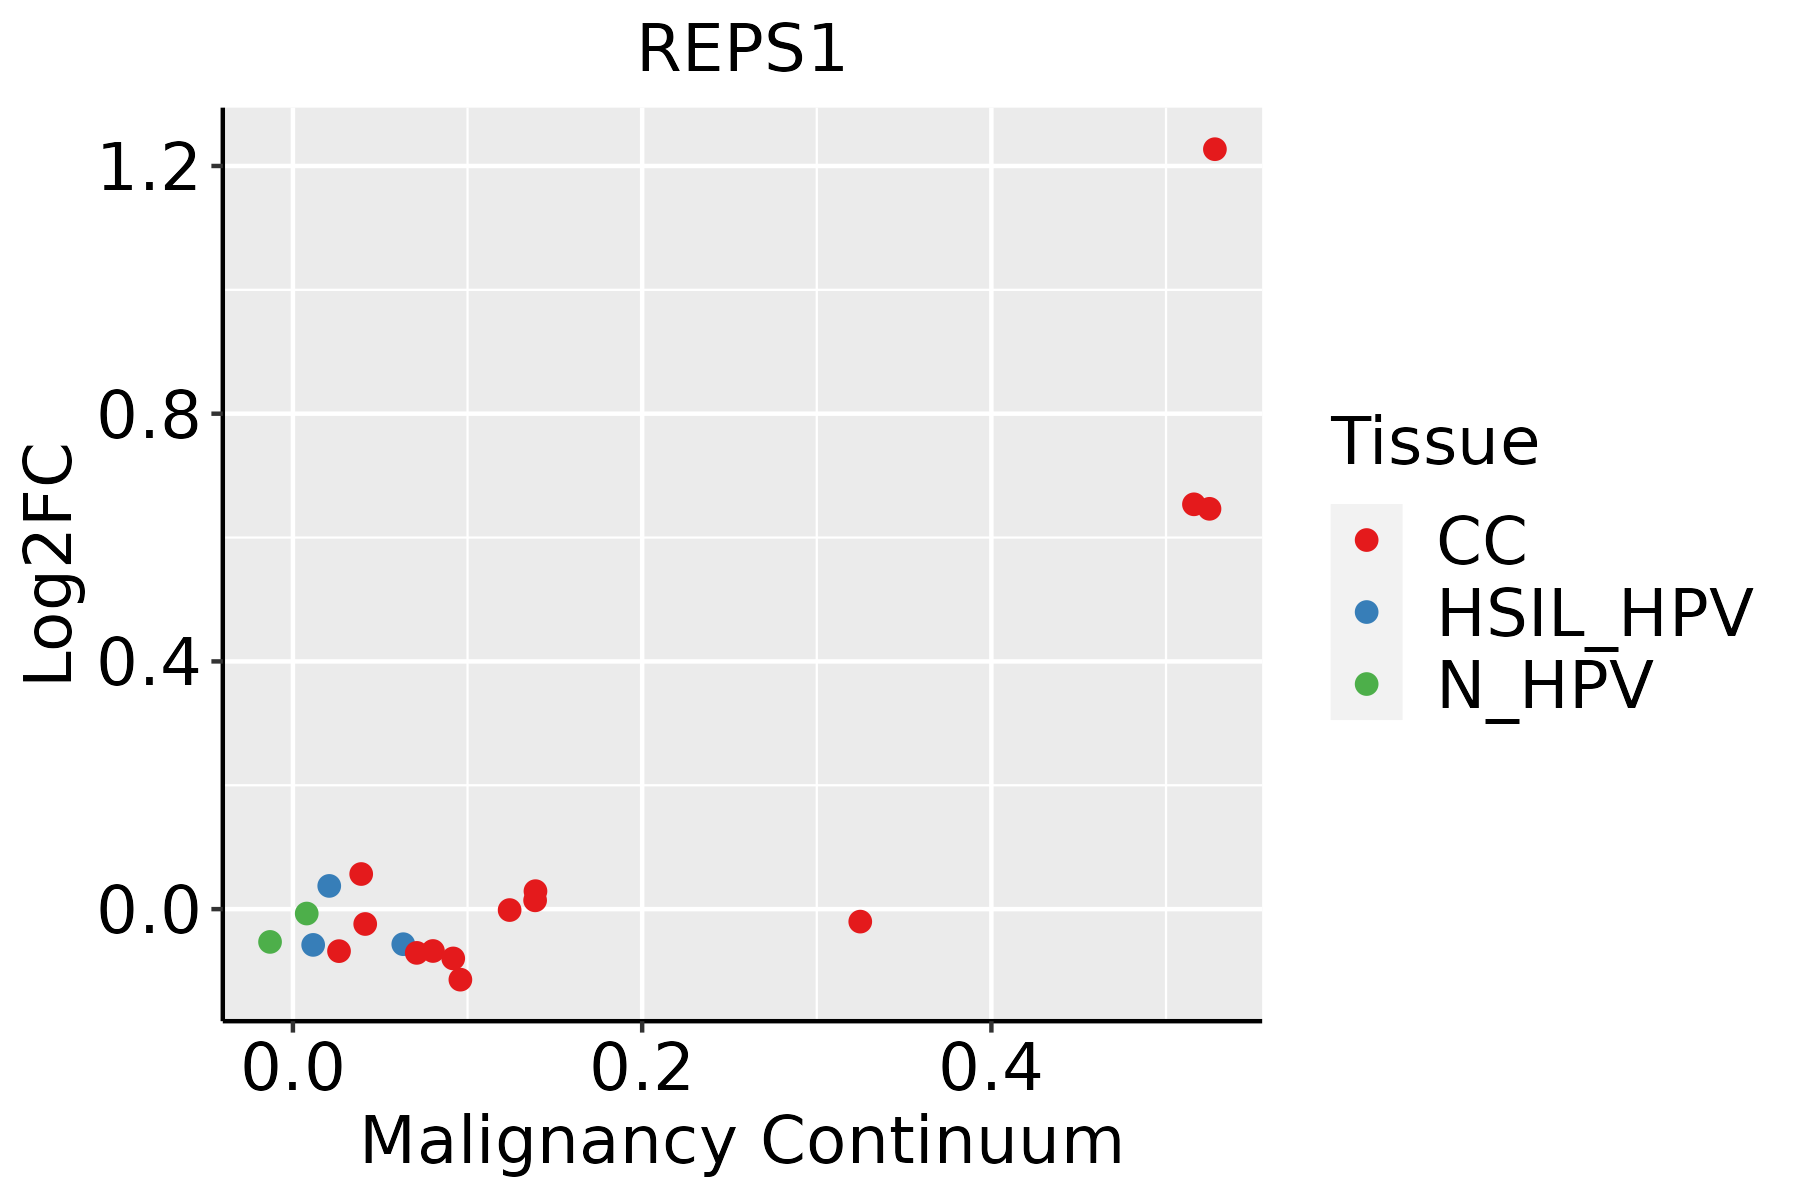 | CC: Cervix cancer |
| HSIL_HPV: HPV-infected high-grade squamous intraepithelial lesions |
| N_HPV: HPV-infected normal cervix |
| Colorectum (GSE201348) |  | FAP: Familial adenomatous polyposis |
| CRC: Colorectal cancer |
| Colorectum (HTA11) | 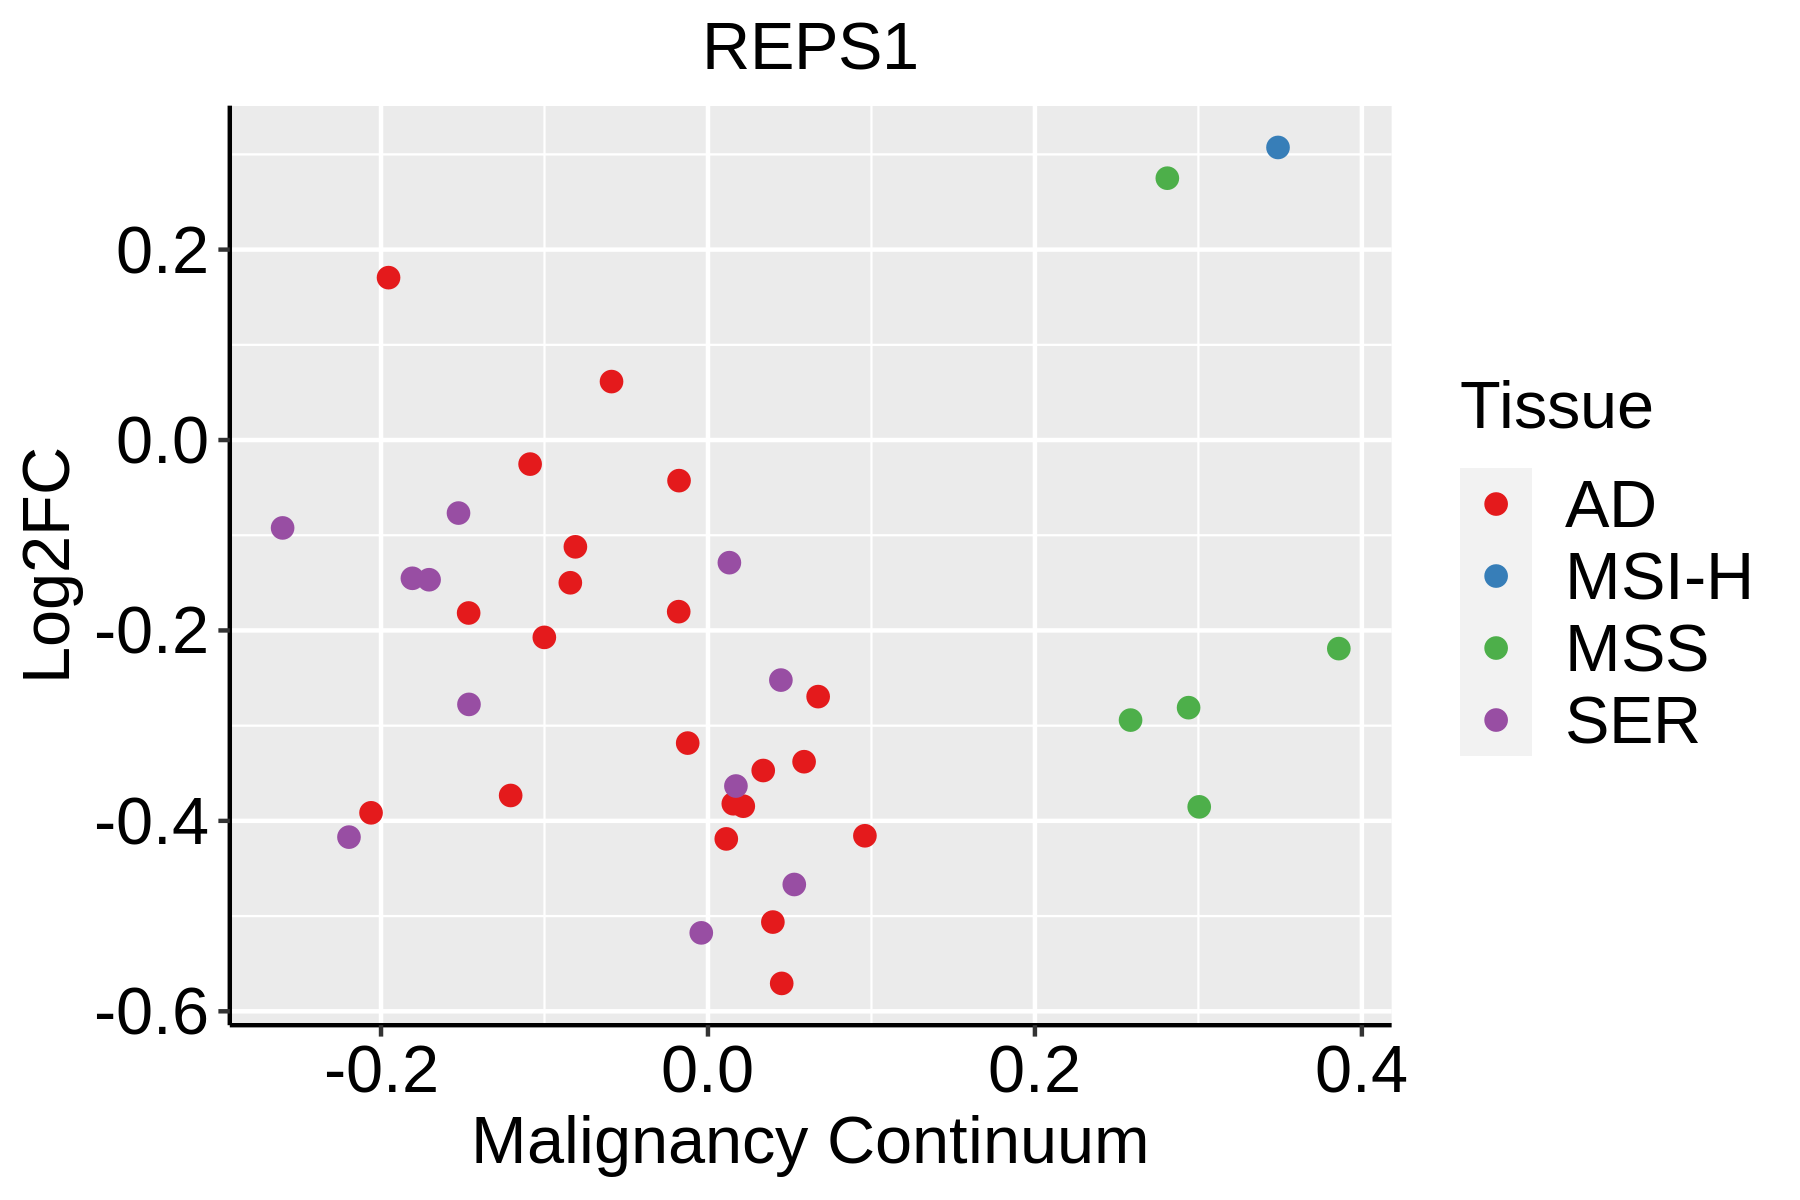 | AD: Adenomas |
| SER: Sessile serrated lesions |
| MSI-H: Microsatellite-high colorectal cancer |
| MSS: Microsatellite stable colorectal cancer |
| Esophagus | 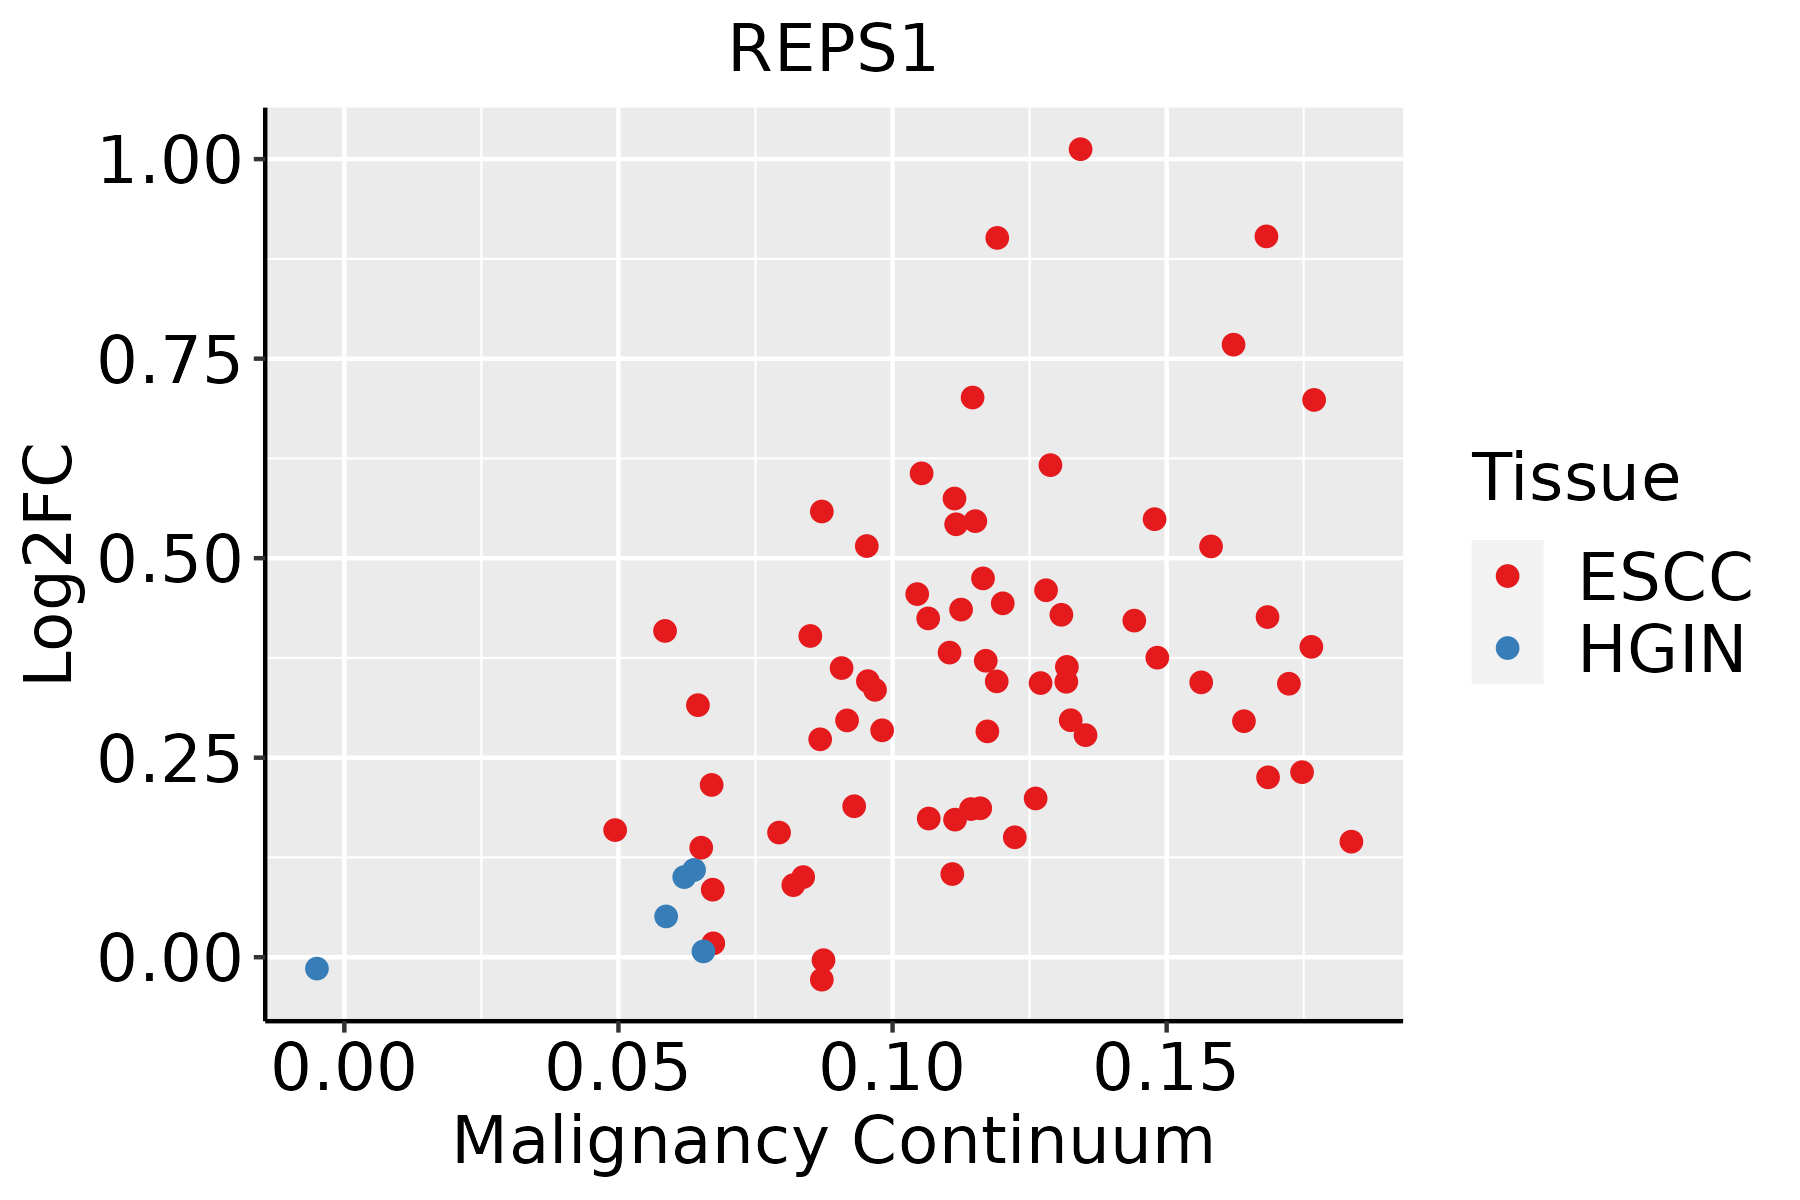 | ESCC: Esophageal squamous cell carcinoma |
| HGIN: High-grade intraepithelial neoplasias |
| LGIN: Low-grade intraepithelial neoplasias |
| Lung |  | AAH: Atypical adenomatous hyperplasia |
| AIS: Adenocarcinoma in situ |
| IAC: Invasive lung adenocarcinoma |
| MIA: Minimally invasive adenocarcinoma |
| Oral Cavity |  | EOLP: Erosive Oral lichen planus |
| LP: leukoplakia |
| NEOLP: Non-erosive oral lichen planus |
| OSCC: Oral squamous cell carcinoma |
| Thyroid | 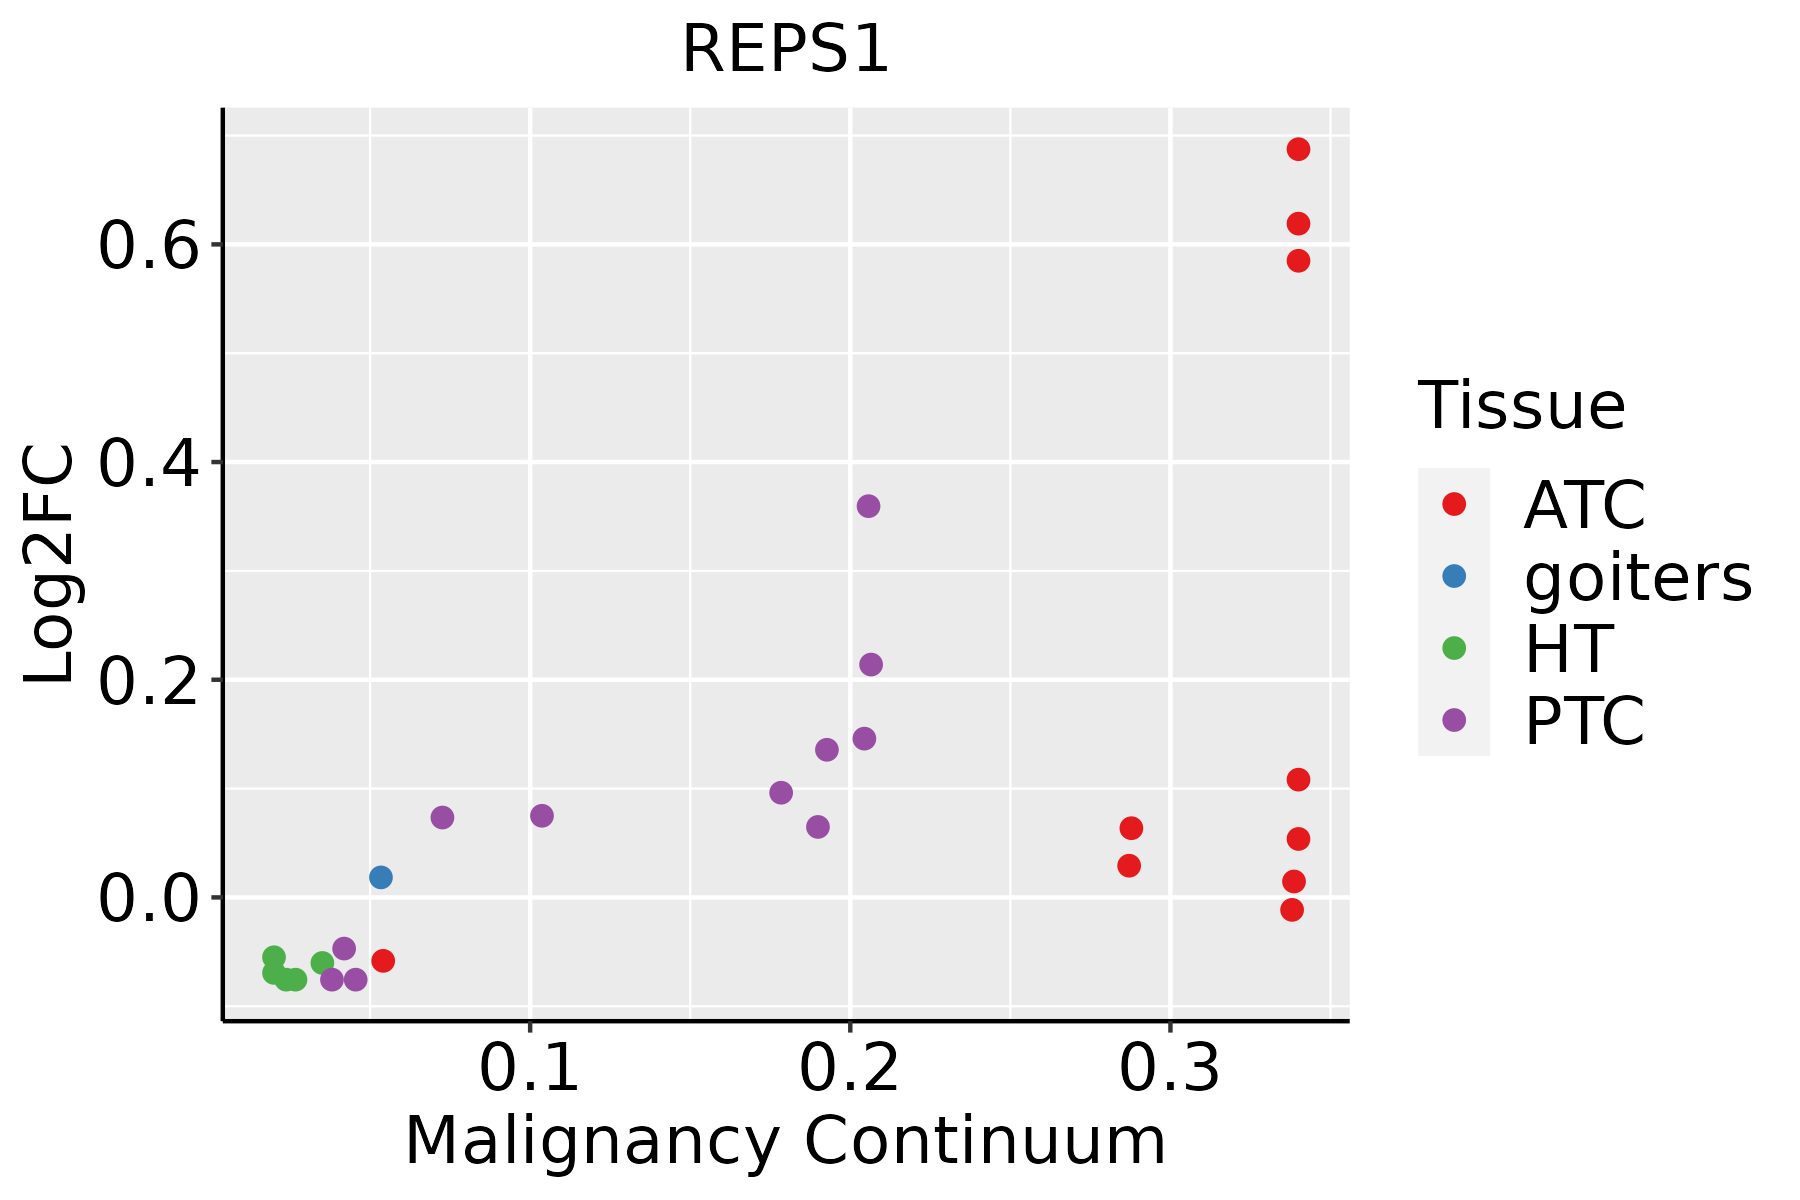 | ATC: Anaplastic thyroid cancer |
| HT: Hashimoto's thyroiditis |
| PTC: Papillary thyroid cancer |
| GO ID | Tissue | Disease Stage | Description | Gene Ratio | Bg Ratio | pvalue | p.adjust | Count |
| GO:00068987 | Cervix | CC | receptor-mediated endocytosis | 53/2311 | 244/18723 | 2.52e-05 | 4.29e-04 | 53 |
| GO:00161977 | Cervix | CC | endosomal transport | 48/2311 | 230/18723 | 1.65e-04 | 1.97e-03 | 48 |
| GO:0016197 | Colorectum | AD | endosomal transport | 90/3918 | 230/18723 | 1.88e-10 | 1.73e-08 | 90 |
| GO:0006898 | Colorectum | AD | receptor-mediated endocytosis | 76/3918 | 244/18723 | 1.07e-04 | 1.59e-03 | 76 |
| GO:00161972 | Colorectum | MSS | endosomal transport | 79/3467 | 230/18723 | 7.04e-09 | 4.39e-07 | 79 |
| GO:00068981 | Colorectum | MSS | receptor-mediated endocytosis | 69/3467 | 244/18723 | 1.18e-04 | 1.82e-03 | 69 |
| GO:00068982 | Colorectum | FAP | receptor-mediated endocytosis | 62/2622 | 244/18723 | 1.47e-06 | 6.39e-05 | 62 |
| GO:00161973 | Colorectum | FAP | endosomal transport | 56/2622 | 230/18723 | 1.79e-05 | 4.53e-04 | 56 |
| GO:00161974 | Colorectum | CRC | endosomal transport | 49/2078 | 230/18723 | 5.07e-06 | 2.05e-04 | 49 |
| GO:00068983 | Colorectum | CRC | receptor-mediated endocytosis | 50/2078 | 244/18723 | 1.27e-05 | 4.08e-04 | 50 |
| GO:001619715 | Esophagus | ESCC | endosomal transport | 168/8552 | 230/18723 | 2.28e-17 | 1.93e-15 | 168 |
| GO:000689818 | Esophagus | ESCC | receptor-mediated endocytosis | 142/8552 | 244/18723 | 5.22e-05 | 4.05e-04 | 142 |
| GO:00068985 | Lung | IAC | receptor-mediated endocytosis | 50/2061 | 244/18723 | 1.01e-05 | 3.23e-04 | 50 |
| GO:00161976 | Lung | IAC | endosomal transport | 43/2061 | 230/18723 | 3.53e-04 | 5.50e-03 | 43 |
| GO:000689812 | Lung | AIS | receptor-mediated endocytosis | 50/1849 | 244/18723 | 4.47e-07 | 3.52e-05 | 50 |
| GO:001619712 | Lung | AIS | endosomal transport | 38/1849 | 230/18723 | 1.08e-03 | 1.41e-02 | 38 |
| GO:000689822 | Lung | MIAC | receptor-mediated endocytosis | 25/967 | 244/18723 | 8.78e-04 | 1.88e-02 | 25 |
| GO:00161979 | Oral cavity | OSCC | endosomal transport | 141/7305 | 230/18723 | 5.40e-12 | 2.06e-10 | 141 |
| GO:000689810 | Oral cavity | OSCC | receptor-mediated endocytosis | 125/7305 | 244/18723 | 6.56e-05 | 5.32e-04 | 125 |
| GO:000689825 | Oral cavity | EOLP | receptor-mediated endocytosis | 55/2218 | 244/18723 | 1.64e-06 | 3.82e-05 | 55 |
| Hugo Symbol | Variant Class | Variant Classification | dbSNP RS | HGVSc | HGVSp | HGVSp Short | SWISSPROT | BIOTYPE | SIFT | PolyPhen | Tumor Sample Barcode | Tissue | Histology | Sex | Age | Stage | Therapy Types | Drugs | Outcome |
| REPS1 | SNV | Missense_Mutation | novel | c.857G>T | p.Arg286Ile | p.R286I | Q96D71 | protein_coding | deleterious(0.04) | possibly_damaging(0.883) | TCGA-AN-A046-01 | Breast | breast invasive carcinoma | Female | >=65 | I/II | Unknown | Unknown | SD |
| REPS1 | SNV | Missense_Mutation | | c.1468N>A | p.Asp490Asn | p.D490N | Q96D71 | protein_coding | deleterious(0.03) | benign(0.363) | TCGA-EW-A1OV-01 | Breast | breast invasive carcinoma | Female | <65 | I/II | Chemotherapy | epirubicin | SD |
| REPS1 | SNV | Missense_Mutation | novel | c.97N>A | p.Gly33Arg | p.G33R | Q96D71 | protein_coding | deleterious(0.01) | possibly_damaging(0.583) | TCGA-LD-A74U-01 | Breast | breast invasive carcinoma | Female | >=65 | III/IV | Chemotherapy | taxotere | SD |
| REPS1 | deletion | Frame_Shift_Del | | c.330_367delTCGCCATGCAGCCTCATATTCTTCAGATTCTGAAAATC | p.His112ValfsTer23 | p.H112Vfs*23 | Q96D71 | protein_coding | | | TCGA-AO-A0J2-01 | Breast | breast invasive carcinoma | Female | <65 | I/II | Chemotherapy | cyclophosphamide | SD |
| REPS1 | insertion | Frame_Shift_Ins | novel | c.2_3insAACGTCGCGTCCCGGGGCC | p.Met1? | p.M1? | Q96D71 | protein_coding | | | TCGA-AQ-A04J-01 | Breast | breast invasive carcinoma | Female | <65 | I/II | Chemotherapy | cytoxan | SD |
| REPS1 | insertion | Frame_Shift_Ins | novel | c.389_390insAA | p.Pro131IlefsTer10 | p.P131Ifs*10 | Q96D71 | protein_coding | | | TCGA-AR-A0U0-01 | Breast | breast invasive carcinoma | Female | >=65 | I/II | Unknown | Unknown | SD |
| REPS1 | insertion | Frame_Shift_Ins | novel | c.388_389insGCCTA | p.Ile130SerfsTer12 | p.I130Sfs*12 | Q96D71 | protein_coding | | | TCGA-AR-A0U0-01 | Breast | breast invasive carcinoma | Female | >=65 | I/II | Unknown | Unknown | SD |
| REPS1 | SNV | Missense_Mutation | rs773035326 | c.1714A>G | p.Thr572Ala | p.T572A | Q96D71 | protein_coding | tolerated(0.66) | benign(0) | TCGA-2W-A8YY-01 | Cervix | cervical & endocervical cancer | Female | <65 | I/II | Chemotherapy | cisplatin | CR |
| REPS1 | SNV | Missense_Mutation | rs752858400 | c.770G>A | p.Arg257Gln | p.R257Q | Q96D71 | protein_coding | deleterious(0.03) | possibly_damaging(0.728) | TCGA-FU-A5XV-01 | Cervix | cervical & endocervical cancer | Female | <65 | III/IV | Unknown | Unknown | SD |
| REPS1 | SNV | Missense_Mutation | novel | c.1255G>A | p.Glu419Lys | p.E419K | Q96D71 | protein_coding | tolerated(0.2) | possibly_damaging(0.471) | TCGA-VS-A9UH-01 | Cervix | cervical & endocervical cancer | Female | <65 | I/II | Chemotherapy | cisplatin | CR |


