
|
|||||
|
 | |
| |
| |
| |
| |
| |
|
Gene: RELN |
Gene summary for RELN |
| Gene information | Species | Human | Gene symbol | RELN | Gene ID | 5649 |
| Gene name | reelin | |
| Gene Alias | ETL7 | |
| Cytomap | 7q22.1 | |
| Gene Type | protein-coding | GO ID | GO:0000902 | UniProtAcc | P78509 |
Top |
Malignant transformation analysis |
| Identification of the aberrant gene expression in precancerous and cancerous lesions by comparing the gene expression of stem-like cells in diseased tissues with normal stem cells |
| Entrez ID | Symbol | Replicates | Species | Organ | Tissue | Adj P-value | Log2FC | Malignancy |
| 5649 | RELN | HCC1_Meng | Human | Liver | HCC | 2.70e-53 | 2.22e-01 | 0.0246 |
| 5649 | RELN | HCC1 | Human | Liver | HCC | 1.36e-11 | 5.11e+00 | 0.5336 |
| 5649 | RELN | Pt13.b | Human | Liver | HCC | 3.25e-05 | 5.52e-02 | 0.0251 |
| 5649 | RELN | Pt14.a | Human | Liver | HCC | 5.17e-14 | 6.16e-01 | 0.0169 |
| 5649 | RELN | S014 | Human | Liver | HCC | 3.24e-08 | 1.29e+00 | 0.2254 |
| 5649 | RELN | S015 | Human | Liver | HCC | 4.78e-03 | 8.59e-01 | 0.2375 |
| 5649 | RELN | S027 | Human | Liver | HCC | 5.62e-16 | 1.46e+00 | 0.2446 |
| 5649 | RELN | S028 | Human | Liver | HCC | 5.51e-44 | 1.80e+00 | 0.2503 |
| 5649 | RELN | S029 | Human | Liver | HCC | 6.33e-31 | 1.53e+00 | 0.2581 |
| Page: 1 |
| Tissue | Expression Dynamics | Abbreviation |
| Liver | 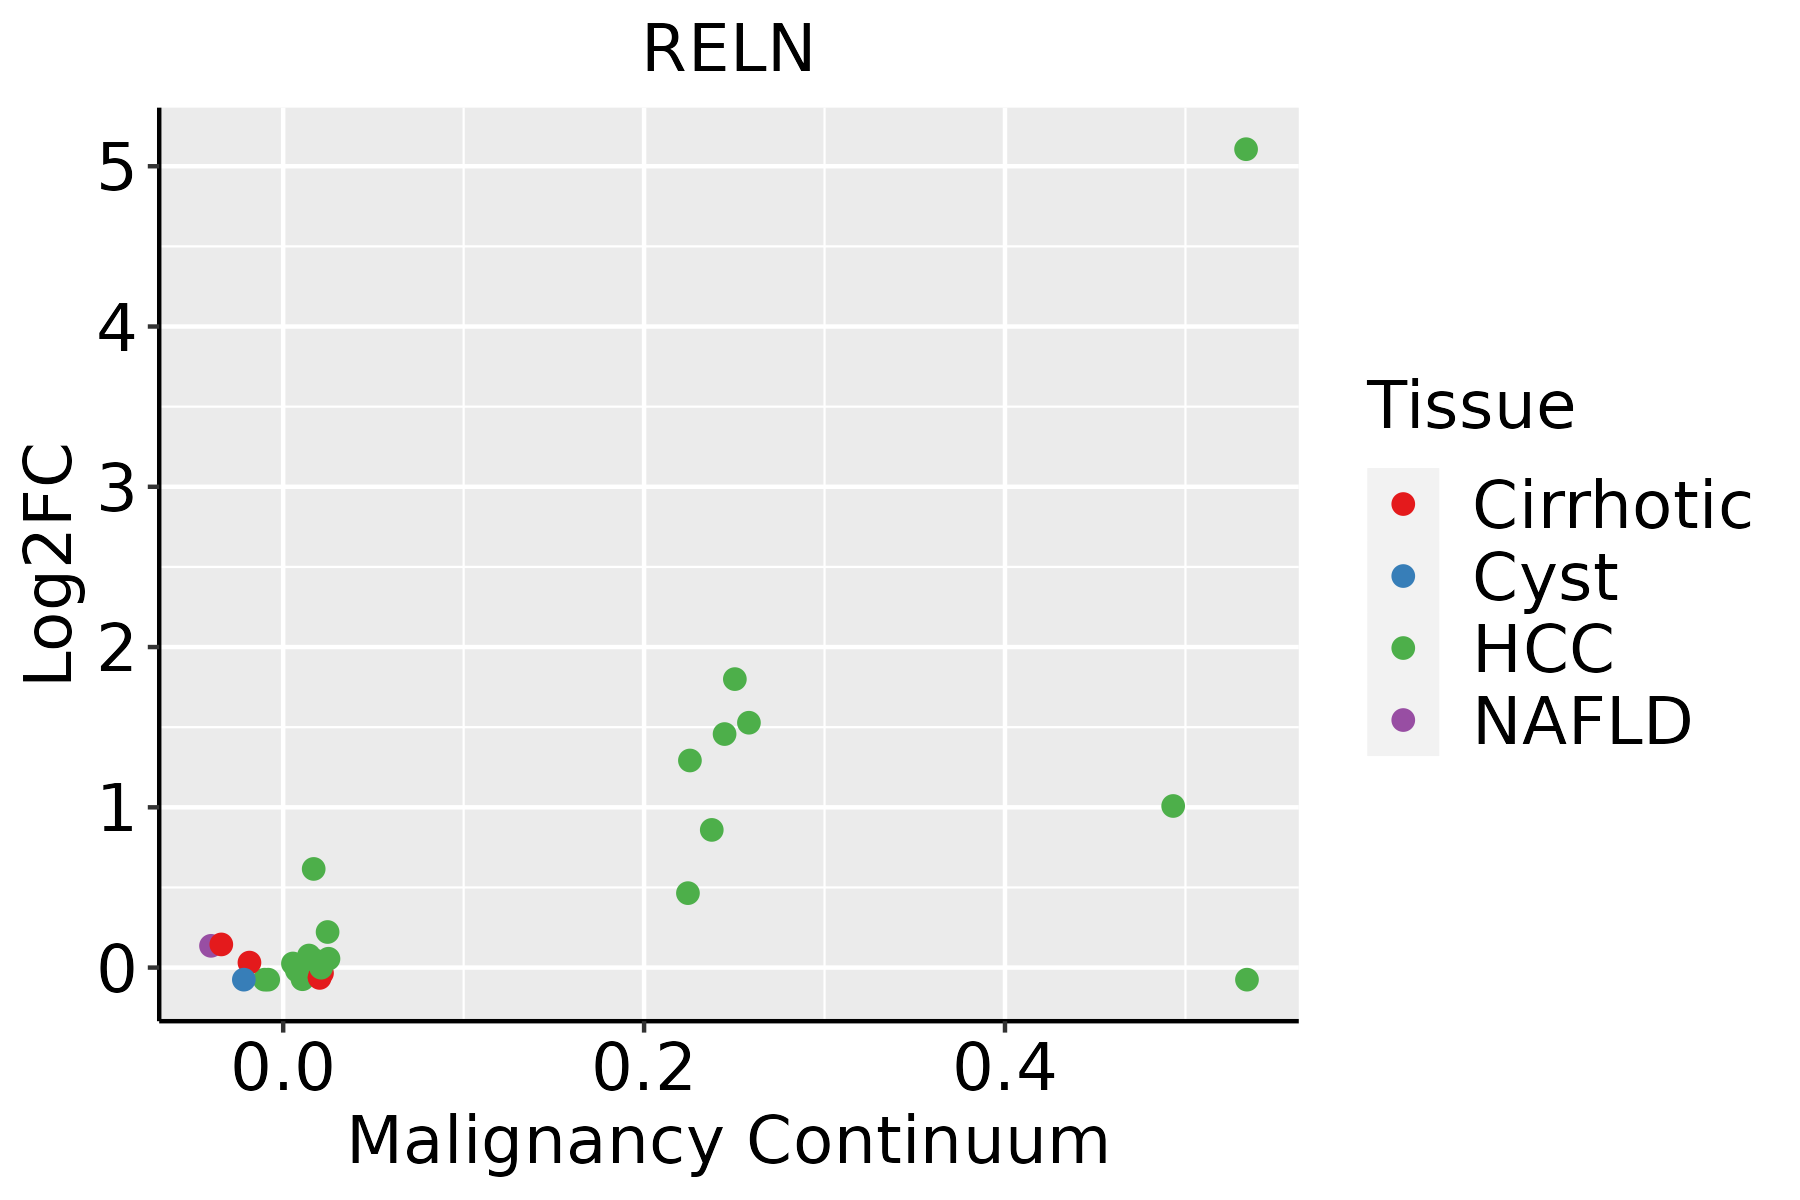 | HCC: Hepatocellular carcinoma |
| NAFLD: Non-alcoholic fatty liver disease |
| ∗log2FC in expression of this searched gene in stem-like cells from each diseased tissue sample relative to stem-like cells in normal samples in each tissue plotted against the malignancy continuum. Samples are colored based on if they are from different disease stage. |
Top |
Malignant transformation related pathway analysis |
| Find out the enriched GO biological processes and KEGG pathways involved in transition from healthy to precancer to cancer |
| Tissue | Disease Stage | Enriched GO biological Processes |
| Colorectum | AD |  |
| Colorectum | SER |  |
| Colorectum | MSS |  |
| Colorectum | MSI-H |  |
| Colorectum | FAP |  |
| ∗Top 15 enriched GO BP terms are showed in the bar plot of each disease state in each tissue. Each row represents a significant GO biological process which is colored according to the -log10(p.adjust). |
| Page: 1 2 3 4 5 6 7 8 9 |
| GO ID | Tissue | Disease Stage | Description | Gene Ratio | Bg Ratio | pvalue | p.adjust | Count |
| GO:002260422 | Liver | HCC | regulation of cell morphogenesis | 188/7958 | 309/18723 | 4.84e-11 | 1.82e-09 | 188 |
| GO:001076922 | Liver | HCC | regulation of cell morphogenesis involved in differentiation | 65/7958 | 96/18723 | 5.17e-07 | 8.37e-06 | 65 |
| GO:00315031 | Liver | HCC | protein-containing complex localization | 129/7958 | 220/18723 | 9.38e-07 | 1.42e-05 | 129 |
| GO:003134611 | Liver | HCC | positive regulation of cell projection organization | 193/7958 | 353/18723 | 2.28e-06 | 3.08e-05 | 193 |
| GO:00319291 | Liver | HCC | TOR signaling | 78/7958 | 126/18723 | 8.49e-06 | 9.97e-05 | 78 |
| GO:001077022 | Liver | HCC | positive regulation of cell morphogenesis involved in differentiation | 53/7958 | 79/18723 | 8.69e-06 | 1.02e-04 | 53 |
| GO:0032006 | Liver | HCC | regulation of TOR signaling | 63/7958 | 104/18723 | 1.50e-04 | 1.20e-03 | 63 |
| GO:2001224 | Liver | HCC | positive regulation of neuron migration | 14/7958 | 16/18723 | 2.73e-04 | 1.98e-03 | 14 |
| GO:001072011 | Liver | HCC | positive regulation of cell development | 155/7958 | 298/18723 | 5.39e-04 | 3.48e-03 | 155 |
| GO:00510902 | Liver | HCC | regulation of DNA-binding transcription factor activity | 220/7958 | 440/18723 | 8.04e-04 | 4.82e-03 | 220 |
| GO:0032008 | Liver | HCC | positive regulation of TOR signaling | 31/7958 | 47/18723 | 9.90e-04 | 5.71e-03 | 31 |
| GO:004586021 | Liver | HCC | positive regulation of protein kinase activity | 194/7958 | 386/18723 | 1.16e-03 | 6.54e-03 | 194 |
| GO:001097511 | Liver | HCC | regulation of neuron projection development | 220/7958 | 445/18723 | 1.68e-03 | 8.78e-03 | 220 |
| GO:003367411 | Liver | HCC | positive regulation of kinase activity | 230/7958 | 467/18723 | 1.72e-03 | 8.95e-03 | 230 |
| GO:0010976 | Liver | HCC | positive regulation of neuron projection development | 88/7958 | 163/18723 | 1.98e-03 | 1.00e-02 | 88 |
| GO:00507674 | Liver | HCC | regulation of neurogenesis | 181/7958 | 364/18723 | 3.00e-03 | 1.40e-02 | 181 |
| GO:0060999 | Liver | HCC | positive regulation of dendritic spine development | 27/7958 | 42/18723 | 3.60e-03 | 1.60e-02 | 27 |
| GO:00507693 | Liver | HCC | positive regulation of neurogenesis | 116/7958 | 225/18723 | 3.67e-03 | 1.63e-02 | 116 |
| GO:00510913 | Liver | HCC | positive regulation of DNA-binding transcription factor activity | 131/7958 | 260/18723 | 5.98e-03 | 2.45e-02 | 131 |
| GO:006099611 | Liver | HCC | dendritic spine development | 54/7958 | 99/18723 | 1.03e-02 | 3.86e-02 | 54 |
| Page: 1 2 |
| Pathway ID | Tissue | Disease Stage | Description | Gene Ratio | Bg Ratio | pvalue | p.adjust | qvalue | Count |
| hsa0451041 | Liver | HCC | Focal adhesion | 125/4020 | 203/8465 | 3.12e-05 | 1.88e-04 | 1.04e-04 | 125 |
| hsa0501721 | Liver | HCC | Spinocerebellar ataxia | 92/4020 | 143/8465 | 3.20e-05 | 1.88e-04 | 1.04e-04 | 92 |
| hsa051652 | Liver | HCC | Human papillomavirus infection | 188/4020 | 331/8465 | 3.34e-04 | 1.49e-03 | 8.29e-04 | 188 |
| hsa0451051 | Liver | HCC | Focal adhesion | 125/4020 | 203/8465 | 3.12e-05 | 1.88e-04 | 1.04e-04 | 125 |
| hsa0501731 | Liver | HCC | Spinocerebellar ataxia | 92/4020 | 143/8465 | 3.20e-05 | 1.88e-04 | 1.04e-04 | 92 |
| hsa051653 | Liver | HCC | Human papillomavirus infection | 188/4020 | 331/8465 | 3.34e-04 | 1.49e-03 | 8.29e-04 | 188 |
| Page: 1 |
Top |
Cell-cell communication analysis |
| Identification of potential cell-cell interactions between two cell types and their ligand-receptor pairs for different disease states |
| Ligand | Receptor | LRpair | Pathway | Tissue | Disease Stage |
| RELN | ITGA3_ITGB1 | RELN_ITGA3_ITGB1 | RELN | CRC | ADJ |
| RELN | ITGA3_ITGB1 | RELN_ITGA3_ITGB1 | RELN | CRC | MSI-H |
| RELN | ITGA3_ITGB1 | RELN_ITGA3_ITGB1 | RELN | Endometrium | ADJ |
| RELN | ITGA3_ITGB1 | RELN_ITGA3_ITGB1 | RELN | Endometrium | AEH |
| RELN | ITGA3_ITGB1 | RELN_ITGA3_ITGB1 | RELN | Esophagus | ESCC |
| RELN | ITGA3_ITGB1 | RELN_ITGA3_ITGB1 | RELN | HNSCC | OSCC |
| RELN | ITGA3_ITGB1 | RELN_ITGA3_ITGB1 | RELN | Liver | Healthy |
| RELN | ITGA3_ITGB1 | RELN_ITGA3_ITGB1 | RELN | Lung | AIS |
| RELN | ITGA3_ITGB1 | RELN_ITGA3_ITGB1 | RELN | Lung | IAC |
| RELN | ITGA3_ITGB1 | RELN_ITGA3_ITGB1 | RELN | Lung | MIAC |
| RELN | ITGA3_ITGB1 | RELN_ITGA3_ITGB1 | RELN | Lung | Precancer |
| RELN | ITGA3_ITGB1 | RELN_ITGA3_ITGB1 | RELN | Skin | ADJ |
| RELN | ITGA3_ITGB1 | RELN_ITGA3_ITGB1 | RELN | Skin | cSCC |
| RELN | ITGA3_ITGB1 | RELN_ITGA3_ITGB1 | RELN | THCA | ADJ |
| RELN | ITGA3_ITGB1 | RELN_ITGA3_ITGB1 | RELN | THCA | Cancer |
| RELN | ITGA3_ITGB1 | RELN_ITGA3_ITGB1 | RELN | THCA | PTC |
| Page: 1 |
Top |
Single-cell gene regulatory network inference analysis |
| Find out the significant the regulons (TFs) and the target genes of each regulon across cell types for different disease states |
| TF | Cell Type | Tissue | Disease Stage | Target Gene | RSS | Regulon Activity |
| ∗The dot plots of a searched regulon are shown for all cell subpopulations in each disease state of each tissue based on the regulon specific score inferred using pySCENIC and by calculating the average expression. |
| Page: 1 |
Top |
Somatic mutation of malignant transformation related genes |
| Annotation of somatic variants for genes involved in malignant transformation |
| Hugo Symbol | Variant Class | Variant Classification | dbSNP RS | HGVSc | HGVSp | HGVSp Short | SWISSPROT | BIOTYPE | SIFT | PolyPhen | Tumor Sample Barcode | Tissue | Histology | Sex | Age | Stage | Therapy Types | Drugs | Outcome |
| RELN | SNV | Missense_Mutation | novel | c.7054N>A | p.Asp2352Asn | p.D2352N | P78509 | protein_coding | tolerated(0.38) | benign(0.25) | TCGA-5L-AAT1-01 | Breast | breast invasive carcinoma | Female | <65 | III/IV | Hormone Therapy | letrozol | SD |
| RELN | SNV | Missense_Mutation | c.10331N>A | p.Gly3444Glu | p.G3444E | P78509 | protein_coding | deleterious_low_confidence(0.04) | probably_damaging(0.996) | TCGA-A2-A0D2-01 | Breast | breast invasive carcinoma | Female | <65 | I/II | Chemotherapy | adriamycin | SD | |
| RELN | SNV | Missense_Mutation | c.4154N>T | p.Arg1385Ile | p.R1385I | P78509 | protein_coding | tolerated(0.09) | probably_damaging(0.958) | TCGA-A2-A0T0-01 | Breast | breast invasive carcinoma | Female | <65 | I/II | Chemotherapy | taxotere | SD | |
| RELN | SNV | Missense_Mutation | c.3806T>G | p.Phe1269Cys | p.F1269C | P78509 | protein_coding | deleterious(0.01) | possibly_damaging(0.594) | TCGA-A2-A0YG-01 | Breast | breast invasive carcinoma | Female | <65 | III/IV | Chemotherapy | cytoxan | SD | |
| RELN | SNV | Missense_Mutation | c.6523N>A | p.Gly2175Ser | p.G2175S | P78509 | protein_coding | tolerated(0.4) | possibly_damaging(0.845) | TCGA-A8-A07L-01 | Breast | breast invasive carcinoma | Female | <65 | III/IV | Chemotherapy | CR | ||
| RELN | SNV | Missense_Mutation | c.3523G>C | p.Asp1175His | p.D1175H | P78509 | protein_coding | deleterious(0) | possibly_damaging(0.887) | TCGA-A8-A08L-01 | Breast | breast invasive carcinoma | Female | >=65 | III/IV | Unknown | Unknown | SD | |
| RELN | SNV | Missense_Mutation | novel | c.4666N>A | p.Glu1556Lys | p.E1556K | P78509 | protein_coding | tolerated(0.06) | probably_damaging(0.95) | TCGA-AC-A23H-01 | Breast | breast invasive carcinoma | Female | >=65 | I/II | Unknown | Unknown | PD |
| RELN | SNV | Missense_Mutation | novel | c.1571C>A | p.Ser524Tyr | p.S524Y | P78509 | protein_coding | deleterious(0.04) | probably_damaging(0.986) | TCGA-AN-A046-01 | Breast | breast invasive carcinoma | Female | >=65 | I/II | Unknown | Unknown | SD |
| RELN | SNV | Missense_Mutation | c.8521N>G | p.Ser2841Ala | p.S2841A | P78509 | protein_coding | tolerated(0.18) | benign(0.082) | TCGA-AN-A0AJ-01 | Breast | breast invasive carcinoma | Female | >=65 | I/II | Unknown | Unknown | SD | |
| RELN | SNV | Missense_Mutation | c.4184N>G | p.Gln1395Arg | p.Q1395R | P78509 | protein_coding | tolerated(0.34) | benign(0.024) | TCGA-AN-A0AK-01 | Breast | breast invasive carcinoma | Female | >=65 | I/II | Unknown | Unknown | SD |
| Page: 1 2 3 4 5 6 7 8 9 10 11 12 13 14 15 16 17 18 19 20 21 22 23 24 25 26 27 28 29 30 31 32 33 34 35 36 37 38 39 40 41 42 43 44 45 46 47 48 49 50 51 52 53 54 55 56 57 58 59 |
Top |
Related drugs of malignant transformation related genes |
| Identification of chemicals and drugs interact with genes involved in malignant transfromation |
| (DGIdb 4.0) |
| Entrez ID | Symbol | Category | Interaction Types | Drug Claim Name | Drug Name | PMIDs |
| Page: 1 |

Copyright 2023-Present -The University of Texas Health Science Center at Houston |