
|
|||||
|
 | |
| |
| |
| |
| |
| |
|
Gene: RELL1 |
Gene summary for RELL1 |
| Gene information | Species | Human | Gene symbol | RELL1 | Gene ID | 768211 |
| Gene name | RELT like 1 | |
| Gene Alias | RELL1 | |
| Cytomap | 4p14 | |
| Gene Type | protein-coding | GO ID | GO:0000165 | UniProtAcc | Q8IUW5 |
Top |
Malignant transformation analysis |
| Identification of the aberrant gene expression in precancerous and cancerous lesions by comparing the gene expression of stem-like cells in diseased tissues with normal stem cells |
| Entrez ID | Symbol | Replicates | Species | Organ | Tissue | Adj P-value | Log2FC | Malignancy |
| 768211 | RELL1 | AEH-subject1 | Human | Endometrium | AEH | 1.36e-03 | 1.04e-01 | -0.3059 |
| 768211 | RELL1 | AEH-subject5 | Human | Endometrium | AEH | 5.42e-16 | 3.63e-01 | -0.2953 |
| 768211 | RELL1 | EEC-subject5 | Human | Endometrium | EEC | 5.95e-03 | 1.56e-01 | -0.249 |
| 768211 | RELL1 | LZE4T | Human | Esophagus | ESCC | 2.37e-02 | 1.14e-01 | 0.0811 |
| 768211 | RELL1 | LZE7T | Human | Esophagus | ESCC | 8.50e-13 | 4.99e-01 | 0.0667 |
| 768211 | RELL1 | LZE8T | Human | Esophagus | ESCC | 4.41e-02 | 1.26e-01 | 0.067 |
| 768211 | RELL1 | LZE24T | Human | Esophagus | ESCC | 1.09e-06 | 1.71e-01 | 0.0596 |
| 768211 | RELL1 | LZE6T | Human | Esophagus | ESCC | 9.61e-05 | 1.97e-01 | 0.0845 |
| 768211 | RELL1 | P1T-E | Human | Esophagus | ESCC | 2.97e-02 | 1.38e-01 | 0.0875 |
| 768211 | RELL1 | P2T-E | Human | Esophagus | ESCC | 1.25e-26 | 5.24e-01 | 0.1177 |
| 768211 | RELL1 | P4T-E | Human | Esophagus | ESCC | 3.48e-08 | 1.89e-01 | 0.1323 |
| 768211 | RELL1 | P5T-E | Human | Esophagus | ESCC | 9.56e-08 | 1.84e-01 | 0.1327 |
| 768211 | RELL1 | P8T-E | Human | Esophagus | ESCC | 9.20e-06 | 1.26e-01 | 0.0889 |
| 768211 | RELL1 | P9T-E | Human | Esophagus | ESCC | 1.34e-08 | 1.82e-01 | 0.1131 |
| 768211 | RELL1 | P10T-E | Human | Esophagus | ESCC | 1.88e-04 | 7.56e-02 | 0.116 |
| 768211 | RELL1 | P11T-E | Human | Esophagus | ESCC | 3.25e-05 | 2.59e-01 | 0.1426 |
| 768211 | RELL1 | P12T-E | Human | Esophagus | ESCC | 2.03e-09 | 2.12e-01 | 0.1122 |
| 768211 | RELL1 | P15T-E | Human | Esophagus | ESCC | 5.37e-05 | 1.45e-01 | 0.1149 |
| 768211 | RELL1 | P16T-E | Human | Esophagus | ESCC | 1.51e-34 | 6.14e-01 | 0.1153 |
| 768211 | RELL1 | P20T-E | Human | Esophagus | ESCC | 1.66e-05 | 1.39e-01 | 0.1124 |
| Page: 1 2 3 4 |
| Tissue | Expression Dynamics | Abbreviation |
| Endometrium |  | AEH: Atypical endometrial hyperplasia |
| EEC: Endometrioid Cancer | ||
| Esophagus | 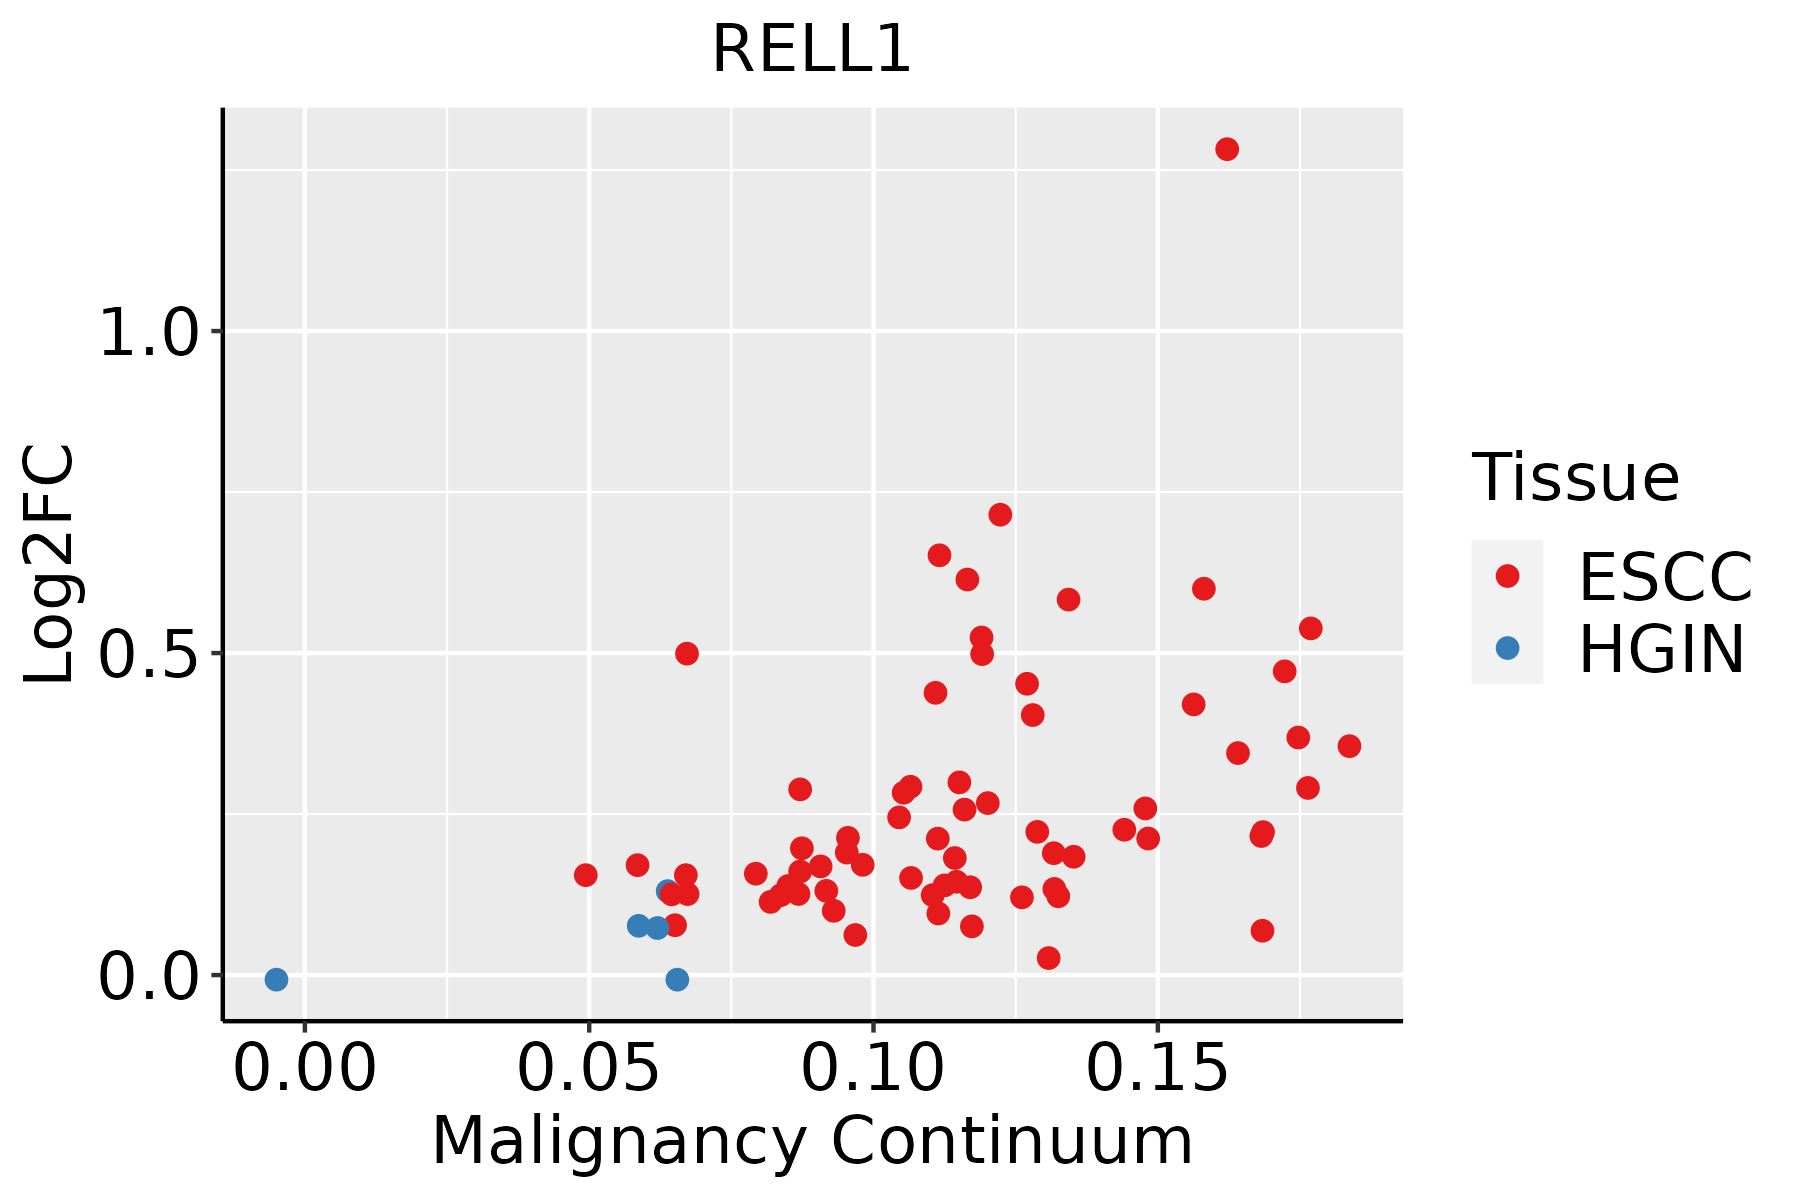 | ESCC: Esophageal squamous cell carcinoma |
| HGIN: High-grade intraepithelial neoplasias | ||
| LGIN: Low-grade intraepithelial neoplasias | ||
| Thyroid |  | ATC: Anaplastic thyroid cancer |
| HT: Hashimoto's thyroiditis | ||
| PTC: Papillary thyroid cancer |
| ∗log2FC in expression of this searched gene in stem-like cells from each diseased tissue sample relative to stem-like cells in normal samples in each tissue plotted against the malignancy continuum. Samples are colored based on if they are from different disease stage. |
Top |
Malignant transformation related pathway analysis |
| Find out the enriched GO biological processes and KEGG pathways involved in transition from healthy to precancer to cancer |
| Tissue | Disease Stage | Enriched GO biological Processes |
| Colorectum | AD |  |
| Colorectum | SER |  |
| Colorectum | MSS |  |
| Colorectum | MSI-H |  |
| Colorectum | FAP |  |
| ∗Top 15 enriched GO BP terms are showed in the bar plot of each disease state in each tissue. Each row represents a significant GO biological process which is colored according to the -log10(p.adjust). |
| Page: 1 2 3 4 5 6 7 8 9 |
| GO ID | Tissue | Disease Stage | Description | Gene Ratio | Bg Ratio | pvalue | p.adjust | Count |
| GO:00514039 | Endometrium | AEH | stress-activated MAPK cascade | 50/2100 | 239/18723 | 9.33e-06 | 2.18e-04 | 50 |
| GO:00310989 | Endometrium | AEH | stress-activated protein kinase signaling cascade | 51/2100 | 247/18723 | 1.12e-05 | 2.52e-04 | 51 |
| GO:00328728 | Endometrium | AEH | regulation of stress-activated MAPK cascade | 42/2100 | 192/18723 | 1.53e-05 | 3.23e-04 | 42 |
| GO:00380665 | Endometrium | AEH | p38MAPK cascade | 18/2100 | 55/18723 | 1.77e-05 | 3.65e-04 | 18 |
| GO:00434105 | Endometrium | AEH | positive regulation of MAPK cascade | 84/2100 | 480/18723 | 2.19e-05 | 4.25e-04 | 84 |
| GO:00703028 | Endometrium | AEH | regulation of stress-activated protein kinase signaling cascade | 42/2100 | 195/18723 | 2.27e-05 | 4.35e-04 | 42 |
| GO:19007443 | Endometrium | AEH | regulation of p38MAPK cascade | 15/2100 | 47/18723 | 1.21e-04 | 1.67e-03 | 15 |
| GO:19007452 | Endometrium | AEH | positive regulation of p38MAPK cascade | 10/2100 | 32/18723 | 1.94e-03 | 1.52e-02 | 10 |
| GO:00328743 | Endometrium | AEH | positive regulation of stress-activated MAPK cascade | 25/2100 | 126/18723 | 3.18e-03 | 2.24e-02 | 25 |
| GO:00703044 | Endometrium | AEH | positive regulation of stress-activated protein kinase signaling cascade | 25/2100 | 128/18723 | 3.95e-03 | 2.65e-02 | 25 |
| GO:003806612 | Endometrium | EEC | p38MAPK cascade | 21/2168 | 55/18723 | 3.30e-07 | 1.33e-05 | 21 |
| GO:005140314 | Endometrium | EEC | stress-activated MAPK cascade | 55/2168 | 239/18723 | 3.98e-07 | 1.56e-05 | 55 |
| GO:003109814 | Endometrium | EEC | stress-activated protein kinase signaling cascade | 56/2168 | 247/18723 | 5.25e-07 | 2.00e-05 | 56 |
| GO:003287214 | Endometrium | EEC | regulation of stress-activated MAPK cascade | 46/2168 | 192/18723 | 1.06e-06 | 3.56e-05 | 46 |
| GO:007030214 | Endometrium | EEC | regulation of stress-activated protein kinase signaling cascade | 46/2168 | 195/18723 | 1.67e-06 | 5.12e-05 | 46 |
| GO:190074411 | Endometrium | EEC | regulation of p38MAPK cascade | 18/2168 | 47/18723 | 2.16e-06 | 6.41e-05 | 18 |
| GO:004341011 | Endometrium | EEC | positive regulation of MAPK cascade | 89/2168 | 480/18723 | 4.21e-06 | 1.08e-04 | 89 |
| GO:19007451 | Endometrium | EEC | positive regulation of p38MAPK cascade | 12/2168 | 32/18723 | 1.37e-04 | 1.78e-03 | 12 |
| GO:003287411 | Endometrium | EEC | positive regulation of stress-activated MAPK cascade | 27/2168 | 126/18723 | 1.09e-03 | 9.43e-03 | 27 |
| GO:007030411 | Endometrium | EEC | positive regulation of stress-activated protein kinase signaling cascade | 27/2168 | 128/18723 | 1.39e-03 | 1.14e-02 | 27 |
| Page: 1 2 |
| Pathway ID | Tissue | Disease Stage | Description | Gene Ratio | Bg Ratio | pvalue | p.adjust | qvalue | Count |
| Page: 1 |
Top |
Cell-cell communication analysis |
| Identification of potential cell-cell interactions between two cell types and their ligand-receptor pairs for different disease states |
| Ligand | Receptor | LRpair | Pathway | Tissue | Disease Stage |
| Page: 1 |
Top |
Single-cell gene regulatory network inference analysis |
| Find out the significant the regulons (TFs) and the target genes of each regulon across cell types for different disease states |
| TF | Cell Type | Tissue | Disease Stage | Target Gene | RSS | Regulon Activity |
| ∗The dot plots of a searched regulon are shown for all cell subpopulations in each disease state of each tissue based on the regulon specific score inferred using pySCENIC and by calculating the average expression. |
| Page: 1 |
Top |
Somatic mutation of malignant transformation related genes |
| Annotation of somatic variants for genes involved in malignant transformation |
| Hugo Symbol | Variant Class | Variant Classification | dbSNP RS | HGVSc | HGVSp | HGVSp Short | SWISSPROT | BIOTYPE | SIFT | PolyPhen | Tumor Sample Barcode | Tissue | Histology | Sex | Age | Stage | Therapy Types | Drugs | Outcome |
| RELL1 | insertion | Nonsense_Mutation | novel | c.199_200insGGAATTAAACTTTCTAGGTTTGGA | p.Phe67delinsTrpAsnTerThrPheTerValTrpIle | p.F67delinsWN*TF*VWI | Q8IUW5 | protein_coding | TCGA-A2-A0D1-01 | Breast | breast invasive carcinoma | Female | >=65 | I/II | Chemotherapy | taxotere | SD | ||
| RELL1 | SNV | Missense_Mutation | rs200794467 | c.580N>T | p.Arg194Trp | p.R194W | Q8IUW5 | protein_coding | deleterious(0) | probably_damaging(0.936) | TCGA-AZ-6608-01 | Colorectum | colon adenocarcinoma | Female | <65 | III/IV | Unknown | Unknown | SD |
| RELL1 | SNV | Missense_Mutation | c.377N>C | p.Lys126Thr | p.K126T | Q8IUW5 | protein_coding | deleterious(0) | possibly_damaging(0.617) | TCGA-AG-A002-01 | Colorectum | rectum adenocarcinoma | Male | <65 | I/II | Unknown | Unknown | SD | |
| RELL1 | SNV | Missense_Mutation | c.739T>C | p.Ser247Pro | p.S247P | Q8IUW5 | protein_coding | tolerated(0.07) | probably_damaging(0.915) | TCGA-F5-6814-01 | Colorectum | rectum adenocarcinoma | Male | <65 | I/II | Unknown | Unknown | SD | |
| RELL1 | insertion | In_Frame_Ins | novel | c.399_400insAAAATAACTATAGTG | p.Val133_Leu134insLysIleThrIleVal | p.V133_L134insKITIV | Q8IUW5 | protein_coding | TCGA-AM-5820-01 | Colorectum | colon adenocarcinoma | Female | <65 | I/II | Unknown | Unknown | SD | ||
| RELL1 | SNV | Missense_Mutation | c.664G>A | p.Val222Ile | p.V222I | Q8IUW5 | protein_coding | tolerated(0.08) | benign(0.35) | TCGA-AP-A051-01 | Endometrium | uterine corpus endometrioid carcinoma | Female | >=65 | I/II | Unknown | Unknown | SD | |
| RELL1 | SNV | Missense_Mutation | rs761509237 | c.289G>A | p.Glu97Lys | p.E97K | Q8IUW5 | protein_coding | deleterious(0.01) | benign(0.207) | TCGA-AP-A1E0-01 | Endometrium | uterine corpus endometrioid carcinoma | Female | <65 | III/IV | Chemotherapy | paclitaxel | SD |
| RELL1 | SNV | Missense_Mutation | rs776975272 | c.361N>A | p.Val121Ile | p.V121I | Q8IUW5 | protein_coding | tolerated(0.14) | benign(0.019) | TCGA-D1-A163-01 | Endometrium | uterine corpus endometrioid carcinoma | Female | <65 | III/IV | Chemotherapy | taxol | SD |
| RELL1 | SNV | Missense_Mutation | rs763387307 | c.523N>A | p.Val175Ile | p.V175I | Q8IUW5 | protein_coding | tolerated(0.71) | benign(0) | TCGA-DF-A2KU-01 | Endometrium | uterine corpus endometrioid carcinoma | Female | Unknown | I/II | Unknown | Unknown | SD |
| RELL1 | SNV | Missense_Mutation | c.778G>C | p.Ala260Pro | p.A260P | Q8IUW5 | protein_coding | tolerated(0.2) | possibly_damaging(0.48) | TCGA-18-3415-01 | Lung | lung squamous cell carcinoma | Male | >=65 | I/II | Chemotherapy | navelbine | CR |
| Page: 1 2 |
Top |
Related drugs of malignant transformation related genes |
| Identification of chemicals and drugs interact with genes involved in malignant transfromation |
| (DGIdb 4.0) |
| Entrez ID | Symbol | Category | Interaction Types | Drug Claim Name | Drug Name | PMIDs |
| Page: 1 |

Copyright 2023-Present -The University of Texas Health Science Center at Houston |