
|
|||||
|
 | |
| |
| |
| |
| |
| |
|
Gene: REG3A |
Gene summary for REG3A |
| Gene information | Species | Human | Gene symbol | REG3A | Gene ID | 5068 |
| Gene name | regenerating family member 3 alpha | |
| Gene Alias | HIP | |
| Cytomap | 2p12 | |
| Gene Type | protein-coding | GO ID | GO:0002376 | UniProtAcc | Q06141 |
Top |
Malignant transformation analysis |
| Identification of the aberrant gene expression in precancerous and cancerous lesions by comparing the gene expression of stem-like cells in diseased tissues with normal stem cells |
| Entrez ID | Symbol | Replicates | Species | Organ | Tissue | Adj P-value | Log2FC | Malignancy |
| 5068 | REG3A | HTA11_2951_2000001011 | Human | Colorectum | AD | 2.17e-09 | 7.78e-01 | 0.0216 |
| 5068 | REG3A | HTA11_3361_2000001011 | Human | Colorectum | AD | 4.35e-15 | 4.65e-01 | -0.1207 |
| 5068 | REG3A | HTA11_696_2000001011 | Human | Colorectum | AD | 4.96e-35 | 1.23e+00 | -0.1464 |
| 5068 | REG3A | HTA11_1391_2000001011 | Human | Colorectum | AD | 2.92e-14 | 1.98e+00 | -0.059 |
| 5068 | REG3A | HTA11_546_2000001011 | Human | Colorectum | AD | 1.50e-17 | 1.26e+00 | -0.0842 |
| 5068 | REG3A | HTA11_866_3004761011 | Human | Colorectum | AD | 1.15e-09 | 5.63e-01 | 0.096 |
| 5068 | REG3A | HTA11_10711_2000001011 | Human | Colorectum | AD | 1.75e-14 | 2.40e+00 | 0.0338 |
| 5068 | REG3A | HTA11_7696_3000711011 | Human | Colorectum | AD | 5.18e-24 | 5.41e-01 | 0.0674 |
| 5068 | REG3A | HTA11_99999970781_79442 | Human | Colorectum | MSS | 4.40e-09 | 2.91e-01 | 0.294 |
| 5068 | REG3A | HTA11_99999965104_69814 | Human | Colorectum | MSS | 3.26e-04 | 1.61e+00 | 0.281 |
| 5068 | REG3A | A002-C-010 | Human | Colorectum | FAP | 1.71e-02 | 1.70e-01 | 0.242 |
| 5068 | REG3A | A001-C-007 | Human | Colorectum | CRC | 1.09e-06 | 4.30e-01 | 0.1899 |
| 5068 | REG3A | HCC5 | Human | Liver | HCC | 1.12e-67 | 8.03e+00 | 0.4932 |
| 5068 | REG3A | S014 | Human | Liver | HCC | 2.39e-57 | 6.11e+00 | 0.2254 |
| 5068 | REG3A | S015 | Human | Liver | HCC | 3.25e-28 | 6.73e+00 | 0.2375 |
| 5068 | REG3A | S016 | Human | Liver | HCC | 2.19e-28 | 5.02e+00 | 0.2243 |
| 5068 | REG3A | HTA12-15-2 | Human | Pancreas | PDAC | 3.49e-31 | -2.46e+00 | 0.2315 |
| 5068 | REG3A | HTA12-16-2 | Human | Pancreas | PDAC | 6.32e-07 | -2.12e+00 | 0.0535 |
| 5068 | REG3A | HTA12-16-5 | Human | Pancreas | PDAC | 6.09e-48 | -2.46e+00 | 0.047 |
| 5068 | REG3A | HTA12-16-6 | Human | Pancreas | PDAC | 2.54e-08 | -2.46e+00 | 0.0544 |
| Page: 1 2 3 |
| Tissue | Expression Dynamics | Abbreviation |
| Colorectum (GSE201348) |  | FAP: Familial adenomatous polyposis |
| CRC: Colorectal cancer | ||
| Colorectum (HTA11) |  | AD: Adenomas |
| SER: Sessile serrated lesions | ||
| MSI-H: Microsatellite-high colorectal cancer | ||
| MSS: Microsatellite stable colorectal cancer | ||
| GC |  | CAG: Chronic atrophic gastritis |
| CAG with IM: Chronic atrophic gastritis with intestinal metaplasia | ||
| CSG: Chronic superficial gastritis | ||
| GC: Gastric cancer | ||
| SIM: Severe intestinal metaplasia | ||
| WIM: Wild intestinal metaplasia | ||
| Liver | 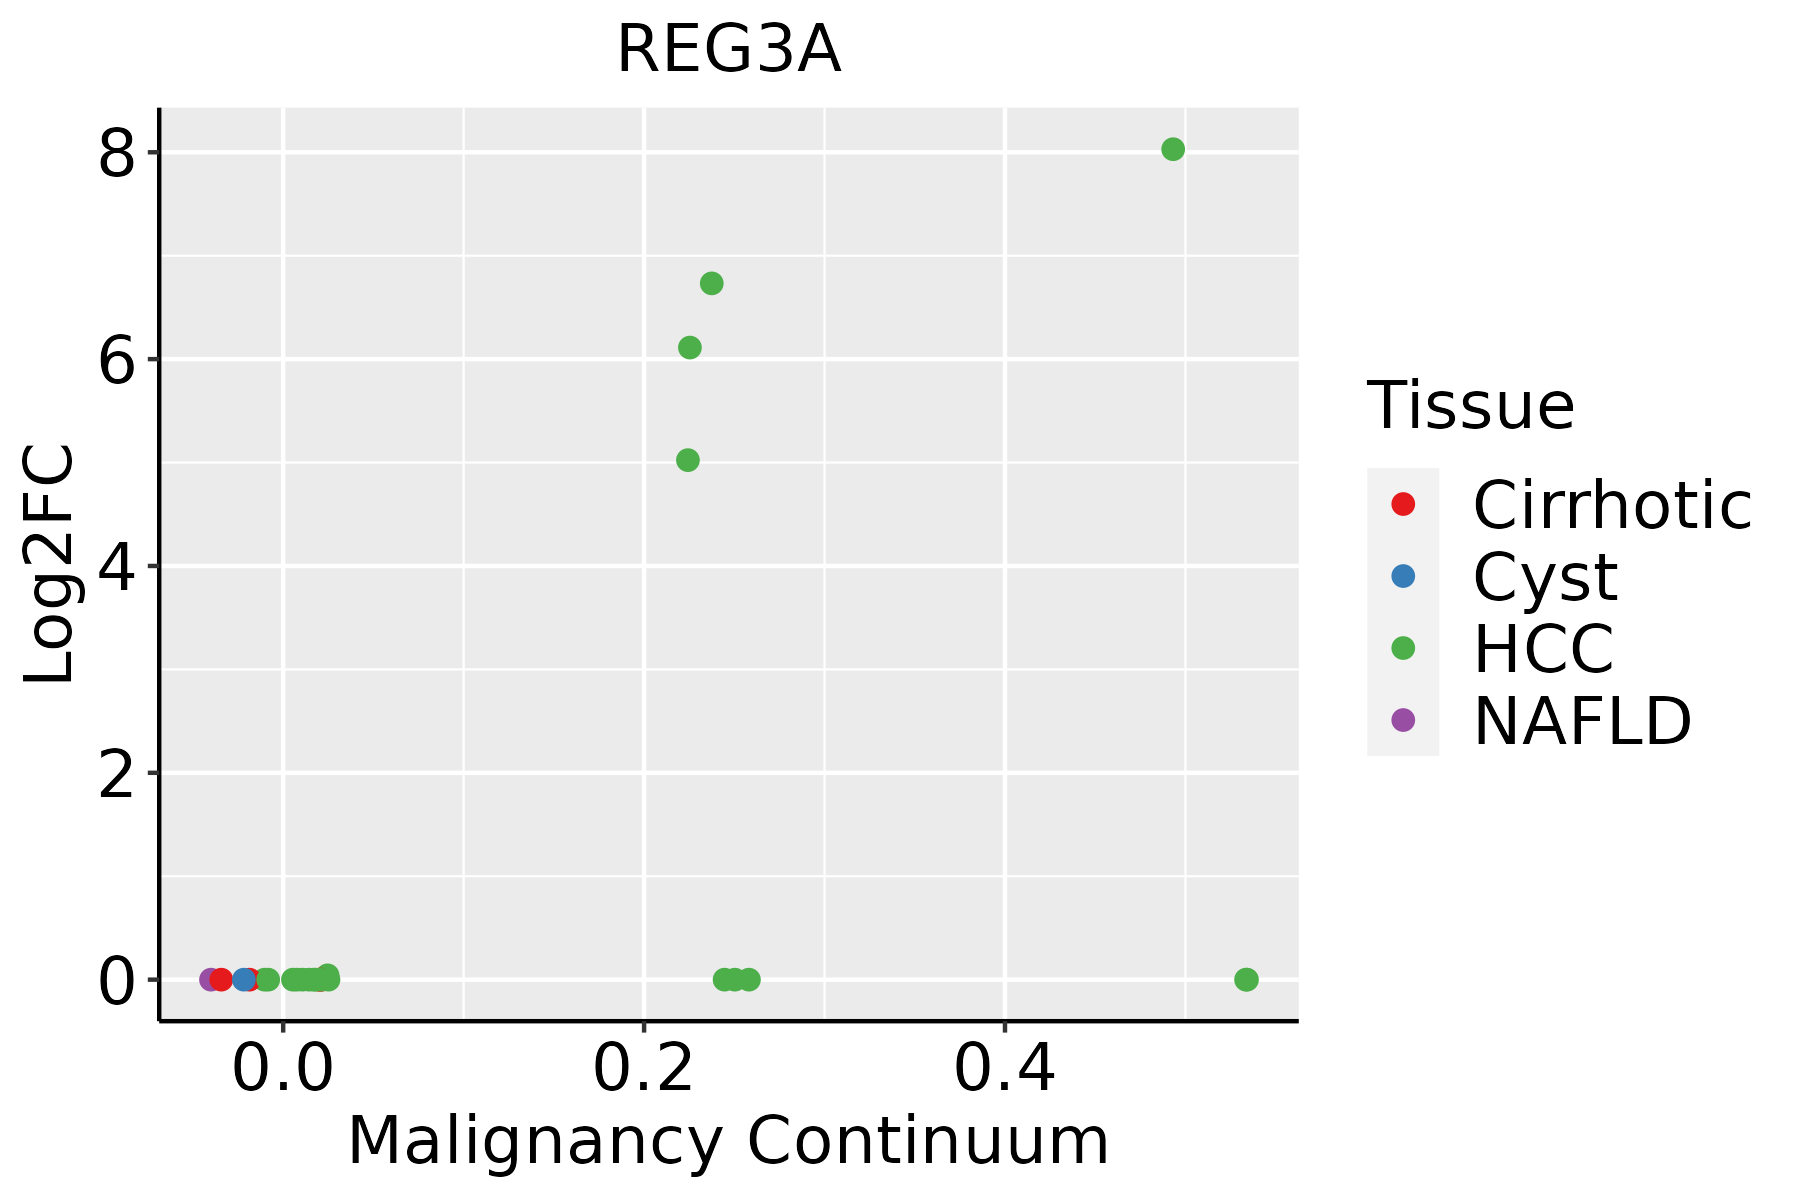 | HCC: Hepatocellular carcinoma |
| NAFLD: Non-alcoholic fatty liver disease |
| ∗log2FC in expression of this searched gene in stem-like cells from each diseased tissue sample relative to stem-like cells in normal samples in each tissue plotted against the malignancy continuum. Samples are colored based on if they are from different disease stage. |
Top |
Malignant transformation related pathway analysis |
| Find out the enriched GO biological processes and KEGG pathways involved in transition from healthy to precancer to cancer |
| Tissue | Disease Stage | Enriched GO biological Processes |
| Colorectum | AD |  |
| Colorectum | SER |  |
| Colorectum | MSS |  |
| Colorectum | MSI-H |  |
| Colorectum | FAP |  |
| ∗Top 15 enriched GO BP terms are showed in the bar plot of each disease state in each tissue. Each row represents a significant GO biological process which is colored according to the -log10(p.adjust). |
| Page: 1 2 3 4 5 6 7 8 9 |
| GO ID | Tissue | Disease Stage | Description | Gene Ratio | Bg Ratio | pvalue | p.adjust | Count |
| GO:0043434 | Colorectum | AD | response to peptide hormone | 126/3918 | 414/18723 | 2.70e-06 | 7.86e-05 | 126 |
| GO:0042060 | Colorectum | AD | wound healing | 128/3918 | 422/18723 | 2.73e-06 | 7.89e-05 | 128 |
| GO:0050673 | Colorectum | AD | epithelial cell proliferation | 119/3918 | 437/18723 | 8.75e-04 | 8.51e-03 | 119 |
| GO:0043616 | Colorectum | AD | keratinocyte proliferation | 19/3918 | 46/18723 | 1.36e-03 | 1.19e-02 | 19 |
| GO:0010837 | Colorectum | AD | regulation of keratinocyte proliferation | 15/3918 | 35/18723 | 2.78e-03 | 2.09e-02 | 15 |
| GO:0035821 | Colorectum | AD | modulation of process of other organism | 34/3918 | 106/18723 | 4.73e-03 | 3.22e-02 | 34 |
| GO:0009913 | Colorectum | AD | epidermal cell differentiation | 58/3918 | 202/18723 | 5.16e-03 | 3.42e-02 | 58 |
| GO:0008544 | Colorectum | AD | epidermis development | 87/3918 | 324/18723 | 5.99e-03 | 3.76e-02 | 87 |
| GO:00420602 | Colorectum | MSS | wound healing | 119/3467 | 422/18723 | 5.93e-07 | 2.24e-05 | 119 |
| GO:00436161 | Colorectum | MSS | keratinocyte proliferation | 20/3467 | 46/18723 | 8.26e-05 | 1.35e-03 | 20 |
| GO:00108371 | Colorectum | MSS | regulation of keratinocyte proliferation | 16/3467 | 35/18723 | 2.07e-04 | 2.89e-03 | 16 |
| GO:00434342 | Colorectum | MSS | response to peptide hormone | 104/3467 | 414/18723 | 4.58e-04 | 5.43e-03 | 104 |
| GO:00506731 | Colorectum | MSS | epithelial cell proliferation | 108/3467 | 437/18723 | 6.76e-04 | 7.30e-03 | 108 |
| GO:00358211 | Colorectum | MSS | modulation of process of other organism | 33/3467 | 106/18723 | 1.18e-03 | 1.14e-02 | 33 |
| GO:00099131 | Colorectum | MSS | epidermal cell differentiation | 52/3467 | 202/18723 | 6.59e-03 | 4.38e-02 | 52 |
| GO:0050678 | Colorectum | MSS | regulation of epithelial cell proliferation | 90/3467 | 381/18723 | 6.92e-03 | 4.45e-02 | 90 |
| GO:00434343 | Colorectum | FAP | response to peptide hormone | 100/2622 | 414/18723 | 1.74e-08 | 1.84e-06 | 100 |
| GO:00420604 | Colorectum | FAP | wound healing | 99/2622 | 422/18723 | 9.50e-08 | 6.33e-06 | 99 |
| GO:00610411 | Colorectum | FAP | regulation of wound healing | 35/2622 | 134/18723 | 1.48e-04 | 2.29e-03 | 35 |
| GO:19030341 | Colorectum | FAP | regulation of response to wounding | 41/2622 | 167/18723 | 1.86e-04 | 2.74e-03 | 41 |
| Page: 1 2 3 4 5 6 |
| Pathway ID | Tissue | Disease Stage | Description | Gene Ratio | Bg Ratio | pvalue | p.adjust | qvalue | Count |
| Page: 1 |
Top |
Cell-cell communication analysis |
| Identification of potential cell-cell interactions between two cell types and their ligand-receptor pairs for different disease states |
| Ligand | Receptor | LRpair | Pathway | Tissue | Disease Stage |
| Page: 1 |
Top |
Single-cell gene regulatory network inference analysis |
| Find out the significant the regulons (TFs) and the target genes of each regulon across cell types for different disease states |
| TF | Cell Type | Tissue | Disease Stage | Target Gene | RSS | Regulon Activity |
| ∗The dot plots of a searched regulon are shown for all cell subpopulations in each disease state of each tissue based on the regulon specific score inferred using pySCENIC and by calculating the average expression. |
| Page: 1 |
Top |
Somatic mutation of malignant transformation related genes |
| Annotation of somatic variants for genes involved in malignant transformation |
| Hugo Symbol | Variant Class | Variant Classification | dbSNP RS | HGVSc | HGVSp | HGVSp Short | SWISSPROT | BIOTYPE | SIFT | PolyPhen | Tumor Sample Barcode | Tissue | Histology | Sex | Age | Stage | Therapy Types | Drugs | Outcome |
| REG3A | SNV | Missense_Mutation | c.406N>T | p.Asn136Tyr | p.N136Y | Q06141 | protein_coding | deleterious(0.03) | benign(0.009) | TCGA-A2-A0SU-01 | Breast | breast invasive carcinoma | Female | >=65 | I/II | Hormone Therapy | arimidex | SD | |
| REG3A | SNV | Missense_Mutation | c.497N>C | p.Arg166Thr | p.R166T | Q06141 | protein_coding | tolerated(0.21) | benign(0.024) | TCGA-A8-A06X-01 | Breast | breast invasive carcinoma | Female | >=65 | I/II | Unknown | Unknown | SD | |
| REG3A | SNV | Missense_Mutation | novel | c.474N>C | p.Trp158Cys | p.W158C | Q06141 | protein_coding | deleterious(0) | probably_damaging(1) | TCGA-E9-A243-01 | Breast | breast invasive carcinoma | Female | <65 | I/II | Chemotherapy | 5-fluorouracil | PD |
| REG3A | SNV | Missense_Mutation | novel | c.10N>T | p.Pro4Ser | p.P4S | Q06141 | protein_coding | tolerated(0.36) | benign(0.005) | TCGA-C5-A1MH-01 | Cervix | cervical & endocervical cancer | Female | >=65 | III/IV | Chemotherapy | cisplatin | PD |
| REG3A | SNV | Missense_Mutation | c.5N>C | p.Leu2Pro | p.L2P | Q06141 | protein_coding | deleterious(0.02) | benign(0.012) | TCGA-C5-A2LZ-01 | Cervix | cervical & endocervical cancer | Female | >=65 | III/IV | Unknown | Unknown | PD | |
| REG3A | SNV | Missense_Mutation | c.4C>G | p.Leu2Val | p.L2V | Q06141 | protein_coding | deleterious(0.02) | benign(0.14) | TCGA-AA-3530-01 | Colorectum | colon adenocarcinoma | Male | >=65 | I/II | Unknown | Unknown | SD | |
| REG3A | SNV | Missense_Mutation | c.148N>A | p.His50Asn | p.H50N | Q06141 | protein_coding | deleterious(0.04) | benign(0.011) | TCGA-AA-3679-01 | Colorectum | colon adenocarcinoma | Male | <65 | III/IV | Chemotherapy | folinic | SD | |
| REG3A | SNV | Missense_Mutation | novel | c.127G>T | p.Gly43Cys | p.G43C | Q06141 | protein_coding | deleterious(0) | probably_damaging(0.999) | TCGA-A5-A1OF-01 | Endometrium | uterine corpus endometrioid carcinoma | Female | <65 | I/II | Unknown | Unknown | SD |
| REG3A | SNV | Missense_Mutation | rs372756064 | c.340N>A | p.Glu114Lys | p.E114K | Q06141 | protein_coding | tolerated(0.12) | benign(0.428) | TCGA-AJ-A3BH-01 | Endometrium | uterine corpus endometrioid carcinoma | Female | Unknown | I/II | Unknown | Unknown | SD |
| REG3A | SNV | Missense_Mutation | novel | c.478N>T | p.Asp160Tyr | p.D160Y | Q06141 | protein_coding | deleterious(0.02) | benign(0.123) | TCGA-AJ-A3EL-01 | Endometrium | uterine corpus endometrioid carcinoma | Female | <65 | I/II | Unknown | Unknown | SD |
| Page: 1 2 3 4 5 6 7 8 |
Top |
Related drugs of malignant transformation related genes |
| Identification of chemicals and drugs interact with genes involved in malignant transfromation |
| (DGIdb 4.0) |
| Entrez ID | Symbol | Category | Interaction Types | Drug Claim Name | Drug Name | PMIDs |
| 5068 | REG3A | DRUGGABLE GENOME | ALF-5755 | 25493266 | ||
| 5068 | REG3A | DRUGGABLE GENOME | SALT | VOLANESORSEN SODIUM | 9024308 | |
| 5068 | REG3A | DRUGGABLE GENOME | HIP-2B |
| Page: 1 |

Copyright 2023-Present -The University of Texas Health Science Center at Houston |