
|
|||||
|
 | |
| |
| |
| |
| |
| |
|
Gene: REEP6 |
Gene summary for REEP6 |
| Gene information | Species | Human | Gene symbol | REEP6 | Gene ID | 92840 |
| Gene name | receptor accessory protein 6 | |
| Gene Alias | C19orf32 | |
| Cytomap | 19p13.3 | |
| Gene Type | protein-coding | GO ID | GO:0003008 | UniProtAcc | Q96HR9 |
Top |
Malignant transformation analysis |
| Identification of the aberrant gene expression in precancerous and cancerous lesions by comparing the gene expression of stem-like cells in diseased tissues with normal stem cells |
| Entrez ID | Symbol | Replicates | Species | Organ | Tissue | Adj P-value | Log2FC | Malignancy |
| 92840 | REEP6 | LZE22T | Human | Esophagus | ESCC | 1.07e-05 | 3.26e-01 | 0.068 |
| 92840 | REEP6 | LZE24T | Human | Esophagus | ESCC | 6.28e-08 | 2.69e-01 | 0.0596 |
| 92840 | REEP6 | P4T-E | Human | Esophagus | ESCC | 2.19e-07 | 2.19e-01 | 0.1323 |
| 92840 | REEP6 | P5T-E | Human | Esophagus | ESCC | 2.02e-02 | 5.64e-02 | 0.1327 |
| 92840 | REEP6 | P8T-E | Human | Esophagus | ESCC | 9.81e-05 | 1.30e-01 | 0.0889 |
| 92840 | REEP6 | P9T-E | Human | Esophagus | ESCC | 1.80e-03 | 1.19e-01 | 0.1131 |
| 92840 | REEP6 | P11T-E | Human | Esophagus | ESCC | 7.83e-09 | 5.16e-01 | 0.1426 |
| 92840 | REEP6 | P15T-E | Human | Esophagus | ESCC | 5.72e-15 | 1.71e-01 | 0.1149 |
| 92840 | REEP6 | P16T-E | Human | Esophagus | ESCC | 6.63e-04 | 8.81e-02 | 0.1153 |
| 92840 | REEP6 | P17T-E | Human | Esophagus | ESCC | 3.43e-04 | 2.59e-01 | 0.1278 |
| 92840 | REEP6 | P20T-E | Human | Esophagus | ESCC | 9.15e-11 | 2.46e-01 | 0.1124 |
| 92840 | REEP6 | P21T-E | Human | Esophagus | ESCC | 7.90e-05 | 1.53e-01 | 0.1617 |
| 92840 | REEP6 | P22T-E | Human | Esophagus | ESCC | 9.22e-15 | 2.70e-01 | 0.1236 |
| 92840 | REEP6 | P23T-E | Human | Esophagus | ESCC | 5.33e-25 | 5.22e-01 | 0.108 |
| 92840 | REEP6 | P24T-E | Human | Esophagus | ESCC | 3.88e-02 | 7.53e-02 | 0.1287 |
| 92840 | REEP6 | P26T-E | Human | Esophagus | ESCC | 3.58e-18 | 3.90e-01 | 0.1276 |
| 92840 | REEP6 | P27T-E | Human | Esophagus | ESCC | 1.92e-05 | 1.25e-01 | 0.1055 |
| 92840 | REEP6 | P28T-E | Human | Esophagus | ESCC | 2.18e-19 | 3.81e-01 | 0.1149 |
| 92840 | REEP6 | P30T-E | Human | Esophagus | ESCC | 3.46e-14 | 4.39e-01 | 0.137 |
| 92840 | REEP6 | P31T-E | Human | Esophagus | ESCC | 1.47e-03 | 8.19e-02 | 0.1251 |
| Page: 1 2 3 4 |
| Tissue | Expression Dynamics | Abbreviation |
| Esophagus | 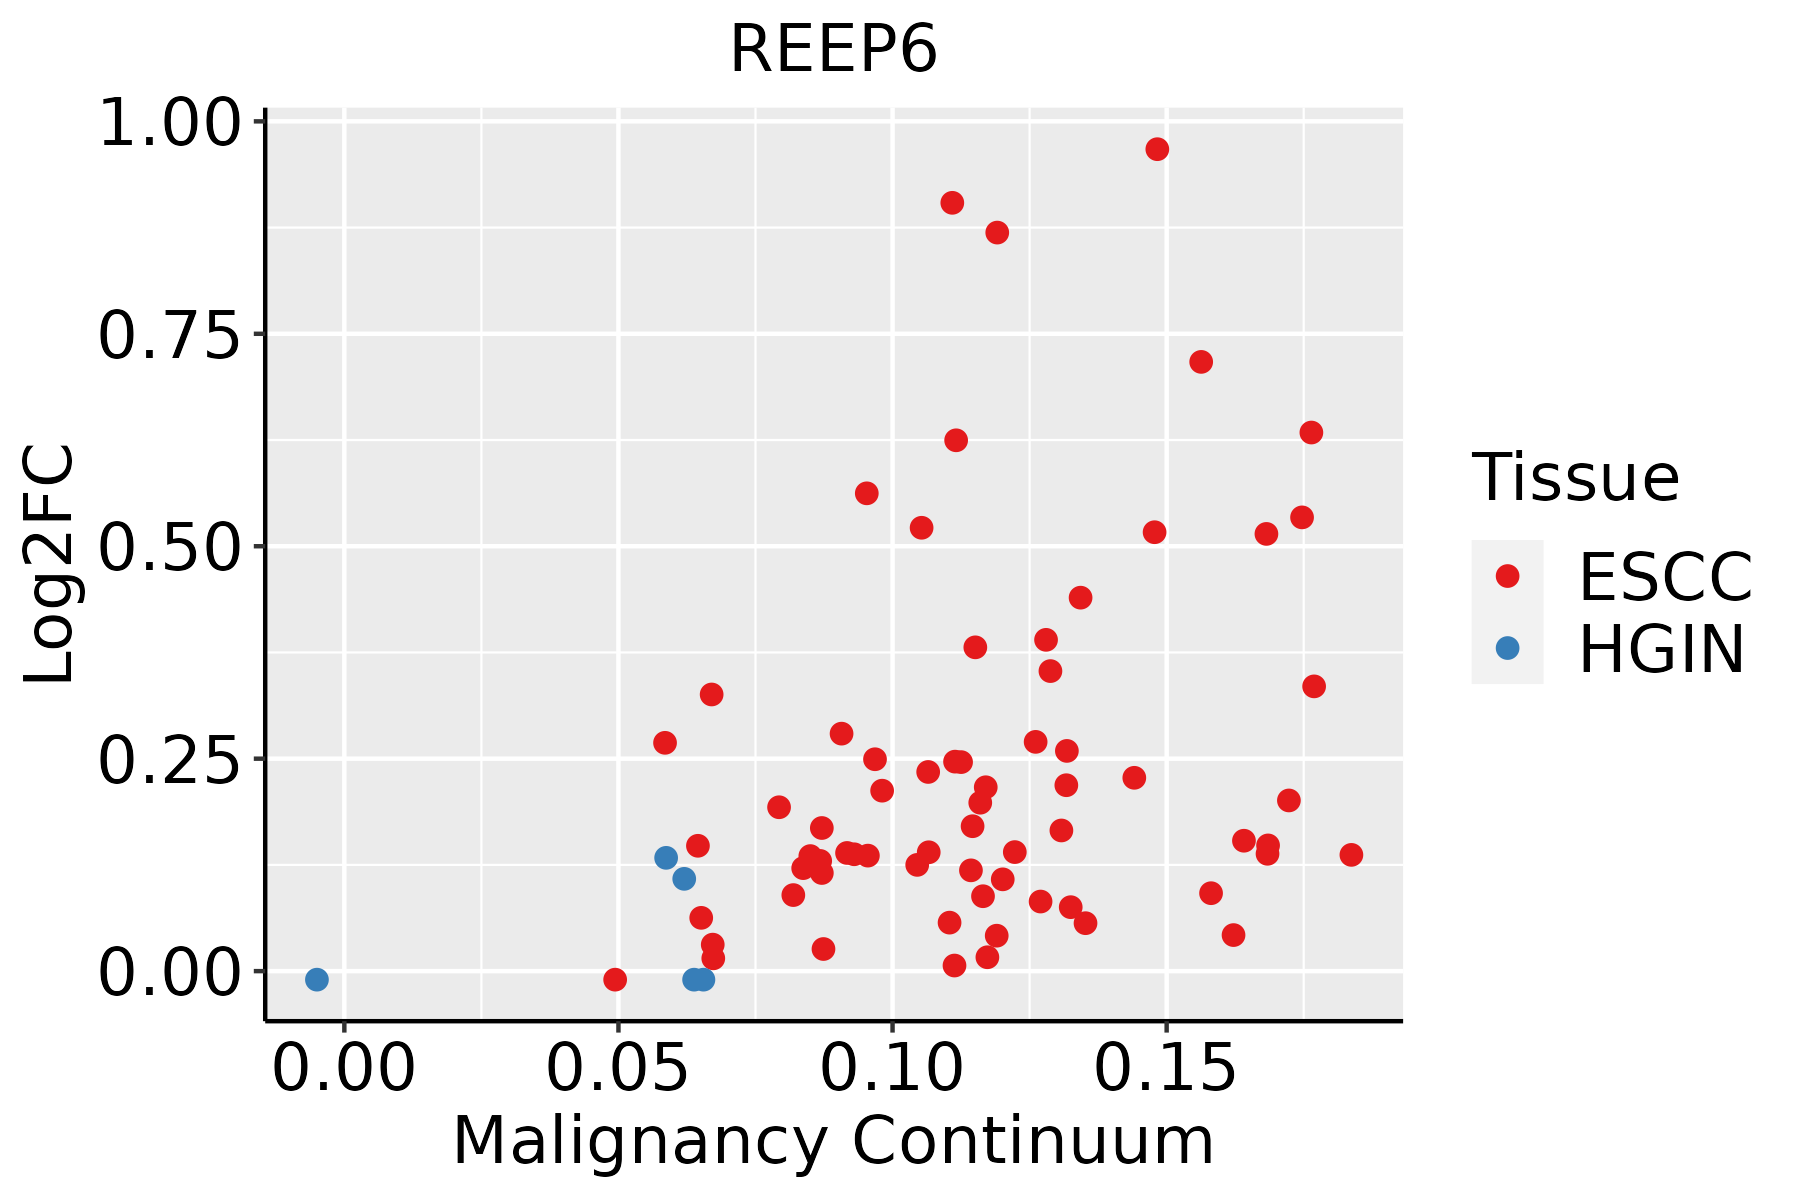 | ESCC: Esophageal squamous cell carcinoma |
| HGIN: High-grade intraepithelial neoplasias | ||
| LGIN: Low-grade intraepithelial neoplasias | ||
| GC | 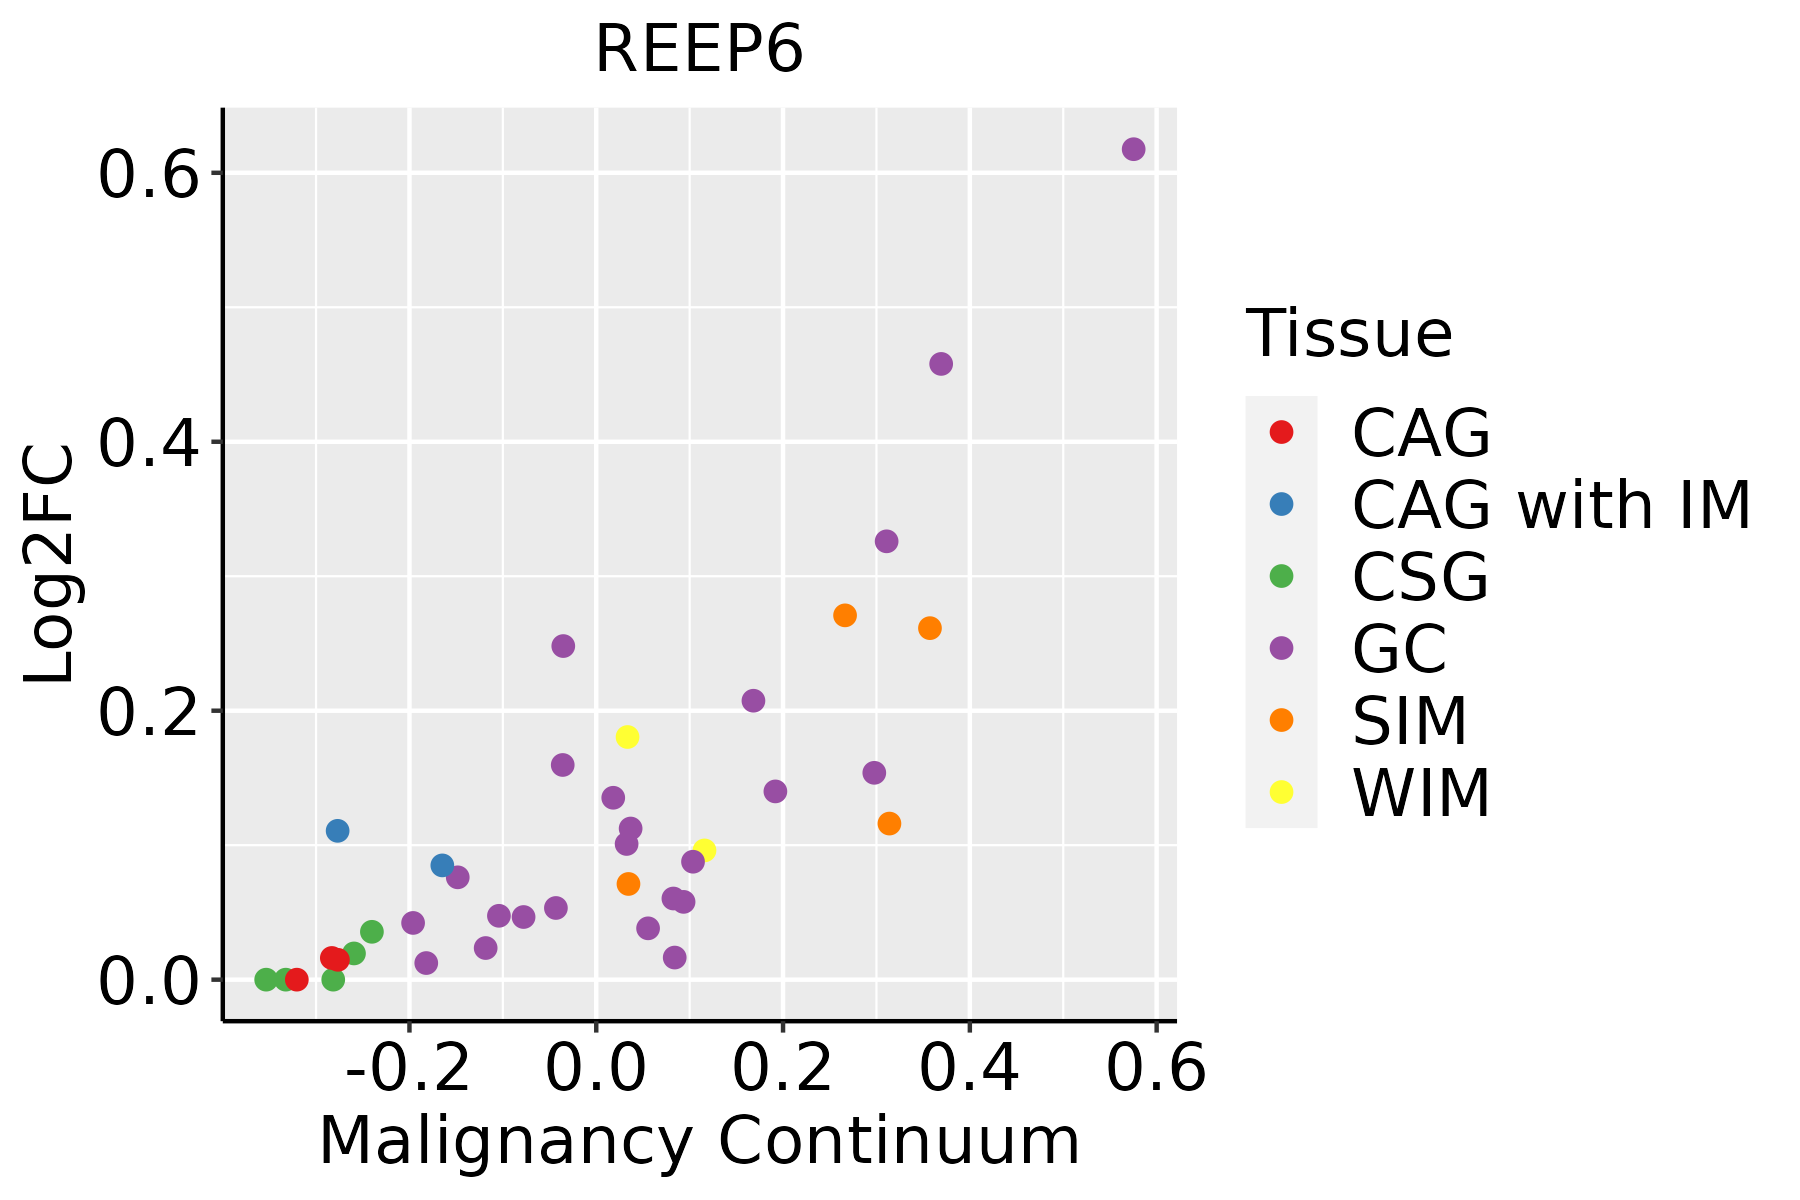 | CAG: Chronic atrophic gastritis |
| CAG with IM: Chronic atrophic gastritis with intestinal metaplasia | ||
| CSG: Chronic superficial gastritis | ||
| GC: Gastric cancer | ||
| SIM: Severe intestinal metaplasia | ||
| WIM: Wild intestinal metaplasia | ||
| Liver |  | HCC: Hepatocellular carcinoma |
| NAFLD: Non-alcoholic fatty liver disease |
| ∗log2FC in expression of this searched gene in stem-like cells from each diseased tissue sample relative to stem-like cells in normal samples in each tissue plotted against the malignancy continuum. Samples are colored based on if they are from different disease stage. |
Top |
Malignant transformation related pathway analysis |
| Find out the enriched GO biological processes and KEGG pathways involved in transition from healthy to precancer to cancer |
| Tissue | Disease Stage | Enriched GO biological Processes |
| Colorectum | AD |  |
| Colorectum | SER |  |
| Colorectum | MSS |  |
| Colorectum | MSI-H |  |
| Colorectum | FAP |  |
| ∗Top 15 enriched GO BP terms are showed in the bar plot of each disease state in each tissue. Each row represents a significant GO biological process which is colored according to the -log10(p.adjust). |
| Page: 1 2 3 4 5 6 7 8 9 |
| GO ID | Tissue | Disease Stage | Description | Gene Ratio | Bg Ratio | pvalue | p.adjust | Count |
| GO:003238618 | Esophagus | ESCC | regulation of intracellular transport | 243/8552 | 337/18723 | 3.20e-23 | 7.25e-21 | 243 |
| GO:000931419 | Esophagus | ESCC | response to radiation | 277/8552 | 456/18723 | 4.42e-11 | 1.43e-09 | 277 |
| GO:000702914 | Esophagus | ESCC | endoplasmic reticulum organization | 65/8552 | 87/18723 | 3.28e-08 | 6.08e-07 | 65 |
| GO:000941611 | Esophagus | ESCC | response to light stimulus | 183/8552 | 320/18723 | 2.03e-05 | 1.76e-04 | 183 |
| GO:003238611 | Liver | Cirrhotic | regulation of intracellular transport | 147/4634 | 337/18723 | 1.84e-14 | 1.72e-12 | 147 |
| GO:00070292 | Liver | Cirrhotic | endoplasmic reticulum organization | 42/4634 | 87/18723 | 1.67e-06 | 3.22e-05 | 42 |
| GO:003238621 | Liver | HCC | regulation of intracellular transport | 231/7958 | 337/18723 | 1.99e-22 | 3.40e-20 | 231 |
| GO:000702911 | Liver | HCC | endoplasmic reticulum organization | 64/7958 | 87/18723 | 3.92e-09 | 1.04e-07 | 64 |
| GO:00093146 | Liver | HCC | response to radiation | 223/7958 | 456/18723 | 3.08e-03 | 1.43e-02 | 223 |
| GO:0009314 | Stomach | GC | response to radiation | 47/1159 | 456/18723 | 4.21e-04 | 6.33e-03 | 47 |
| GO:00093145 | Stomach | SIM | response to radiation | 32/708 | 456/18723 | 6.19e-04 | 9.25e-03 | 32 |
| Page: 1 |
| Pathway ID | Tissue | Disease Stage | Description | Gene Ratio | Bg Ratio | pvalue | p.adjust | qvalue | Count |
| Page: 1 |
Top |
Cell-cell communication analysis |
| Identification of potential cell-cell interactions between two cell types and their ligand-receptor pairs for different disease states |
| Ligand | Receptor | LRpair | Pathway | Tissue | Disease Stage |
| Page: 1 |
Top |
Single-cell gene regulatory network inference analysis |
| Find out the significant the regulons (TFs) and the target genes of each regulon across cell types for different disease states |
| TF | Cell Type | Tissue | Disease Stage | Target Gene | RSS | Regulon Activity |
| ∗The dot plots of a searched regulon are shown for all cell subpopulations in each disease state of each tissue based on the regulon specific score inferred using pySCENIC and by calculating the average expression. |
| Page: 1 |
Top |
Somatic mutation of malignant transformation related genes |
| Annotation of somatic variants for genes involved in malignant transformation |
| Hugo Symbol | Variant Class | Variant Classification | dbSNP RS | HGVSc | HGVSp | HGVSp Short | SWISSPROT | BIOTYPE | SIFT | PolyPhen | Tumor Sample Barcode | Tissue | Histology | Sex | Age | Stage | Therapy Types | Drugs | Outcome |
| REEP6 | SNV | Missense_Mutation | rs745761712 | c.352N>A | p.Ala118Thr | p.A118T | Q96HR9 | protein_coding | tolerated(0.1) | possibly_damaging(0.788) | TCGA-FU-A3HZ-01 | Cervix | cervical & endocervical cancer | Female | <65 | I/II | Chemotherapy | cisplatin | CR |
| REEP6 | insertion | Frame_Shift_Ins | novel | c.194_195insC | p.Ala67ArgfsTer348 | p.A67Rfs*348 | Q96HR9 | protein_coding | TCGA-G4-6302-01 | Colorectum | colon adenocarcinoma | Female | >=65 | I/II | Unknown | Unknown | SD | ||
| REEP6 | SNV | Missense_Mutation | novel | c.242N>G | p.Asp81Gly | p.D81G | Q96HR9 | protein_coding | deleterious(0) | probably_damaging(1) | TCGA-AX-A2HC-01 | Endometrium | uterine corpus endometrioid carcinoma | Female | <65 | III/IV | Chemotherapy | paclitaxel | PD |
| REEP6 | SNV | Missense_Mutation | novel | c.277N>A | p.Ala93Thr | p.A93T | Q96HR9 | protein_coding | deleterious(0.01) | possibly_damaging(0.686) | TCGA-EO-A22R-01 | Endometrium | uterine corpus endometrioid carcinoma | Female | <65 | I/II | Unknown | Unknown | SD |
| REEP6 | SNV | Missense_Mutation | novel | c.542N>T | p.Pro181Leu | p.P181L | Q96HR9 | protein_coding | tolerated(0.26) | benign(0.005) | TCGA-EO-A22X-01 | Endometrium | uterine corpus endometrioid carcinoma | Female | <65 | III/IV | Unspecific | Carboplatin | Complete Response |
| REEP6 | SNV | Missense_Mutation | novel | c.97N>C | p.Lys33Gln | p.K33Q | Q96HR9 | protein_coding | deleterious(0.02) | possibly_damaging(0.756) | TCGA-EO-A3B0-01 | Endometrium | uterine corpus endometrioid carcinoma | Female | <65 | III/IV | Unknown | Unknown | SD |
| REEP6 | SNV | Missense_Mutation | novel | c.209C>T | p.Ser70Leu | p.S70L | Q96HR9 | protein_coding | deleterious(0) | probably_damaging(0.954) | TCGA-WQ-A9G7-01 | Liver | liver hepatocellular carcinoma | Female | >=65 | III/IV | Unknown | Unknown | SD |
| REEP6 | deletion | In_Frame_Del | novel | c.141_164delNNNNNNNNNNNNNNNNNNNNNNNN | p.Phe50_Leu57del | p.F50_L57del | Q96HR9 | protein_coding | TCGA-DD-AACA-01 | Liver | liver hepatocellular carcinoma | Male | >=65 | I/II | Unknown | Unknown | PD | ||
| REEP6 | SNV | Missense_Mutation | c.152N>T | p.Gly51Val | p.G51V | Q96HR9 | protein_coding | deleterious(0) | probably_damaging(0.999) | TCGA-75-5126-01 | Lung | lung adenocarcinoma | Female | Unknown | III/IV | Unknown | Unknown | SD | |
| REEP6 | SNV | Missense_Mutation | novel | c.517N>C | p.Val173Leu | p.V173L | Q96HR9 | protein_coding | tolerated(0.07) | benign(0.211) | TCGA-BB-A5HY-01 | Oral cavity | head & neck squamous cell carcinoma | Male | <65 | I/II | Chemotherapy | cisplatin | PD |
| Page: 1 |
Top |
Related drugs of malignant transformation related genes |
| Identification of chemicals and drugs interact with genes involved in malignant transfromation |
| (DGIdb 4.0) |
| Entrez ID | Symbol | Category | Interaction Types | Drug Claim Name | Drug Name | PMIDs |
| Page: 1 |

Copyright 2023-Present -The University of Texas Health Science Center at Houston |