
|
|||||
|
 | |
| |
| |
| |
| |
| |
|
Gene: REEP5 |
Gene summary for REEP5 |
| Gene information | Species | Human | Gene symbol | REEP5 | Gene ID | 7905 |
| Gene name | receptor accessory protein 5 | |
| Gene Alias | C5orf18 | |
| Cytomap | 5q22.2 | |
| Gene Type | protein-coding | GO ID | GO:0006810 | UniProtAcc | Q00765 |
Top |
Malignant transformation analysis |
| Identification of the aberrant gene expression in precancerous and cancerous lesions by comparing the gene expression of stem-like cells in diseased tissues with normal stem cells |
| Entrez ID | Symbol | Replicates | Species | Organ | Tissue | Adj P-value | Log2FC | Malignancy |
| 7905 | REEP5 | CA_HPV_1 | Human | Cervix | CC | 1.02e-04 | -2.13e-01 | 0.0264 |
| 7905 | REEP5 | CA_HPV_3 | Human | Cervix | CC | 2.95e-03 | 1.02e-01 | 0.0414 |
| 7905 | REEP5 | N_HPV_2 | Human | Cervix | N_HPV | 2.20e-02 | 9.60e-02 | -0.0131 |
| 7905 | REEP5 | CCI_1 | Human | Cervix | CC | 7.12e-09 | -6.79e-01 | 0.528 |
| 7905 | REEP5 | CCI_3 | Human | Cervix | CC | 4.98e-03 | -4.72e-01 | 0.516 |
| 7905 | REEP5 | CCII_1 | Human | Cervix | CC | 4.98e-23 | -7.20e-01 | 0.3249 |
| 7905 | REEP5 | sample3 | Human | Cervix | CC | 3.35e-04 | -2.67e-01 | 0.1387 |
| 7905 | REEP5 | L1 | Human | Cervix | CC | 3.63e-09 | -4.49e-01 | 0.0802 |
| 7905 | REEP5 | T3 | Human | Cervix | CC | 1.56e-07 | -2.92e-01 | 0.1389 |
| 7905 | REEP5 | AEH-subject1 | Human | Endometrium | AEH | 2.03e-06 | -2.20e-01 | -0.3059 |
| 7905 | REEP5 | AEH-subject2 | Human | Endometrium | AEH | 9.32e-17 | -2.99e-01 | -0.2525 |
| 7905 | REEP5 | AEH-subject3 | Human | Endometrium | AEH | 7.34e-04 | -1.11e-01 | -0.2576 |
| 7905 | REEP5 | AEH-subject4 | Human | Endometrium | AEH | 2.62e-08 | -8.03e-02 | -0.2657 |
| 7905 | REEP5 | EEC-subject1 | Human | Endometrium | EEC | 2.40e-10 | -2.75e-01 | -0.2682 |
| 7905 | REEP5 | EEC-subject2 | Human | Endometrium | EEC | 4.18e-11 | -3.39e-01 | -0.2607 |
| 7905 | REEP5 | EEC-subject3 | Human | Endometrium | EEC | 1.53e-29 | -3.00e-01 | -0.2525 |
| 7905 | REEP5 | EEC-subject4 | Human | Endometrium | EEC | 2.27e-04 | 1.09e-02 | -0.2571 |
| 7905 | REEP5 | EEC-subject5 | Human | Endometrium | EEC | 2.51e-07 | 2.31e-02 | -0.249 |
| 7905 | REEP5 | GSM5276934 | Human | Endometrium | EEC | 1.54e-04 | 1.34e-01 | -0.0913 |
| 7905 | REEP5 | GSM5276937 | Human | Endometrium | EEC | 1.75e-18 | 4.63e-01 | -0.0897 |
| Page: 1 2 3 4 5 6 7 8 9 |
| Tissue | Expression Dynamics | Abbreviation |
| Cervix |  | CC: Cervix cancer |
| HSIL_HPV: HPV-infected high-grade squamous intraepithelial lesions | ||
| N_HPV: HPV-infected normal cervix | ||
| Endometrium | 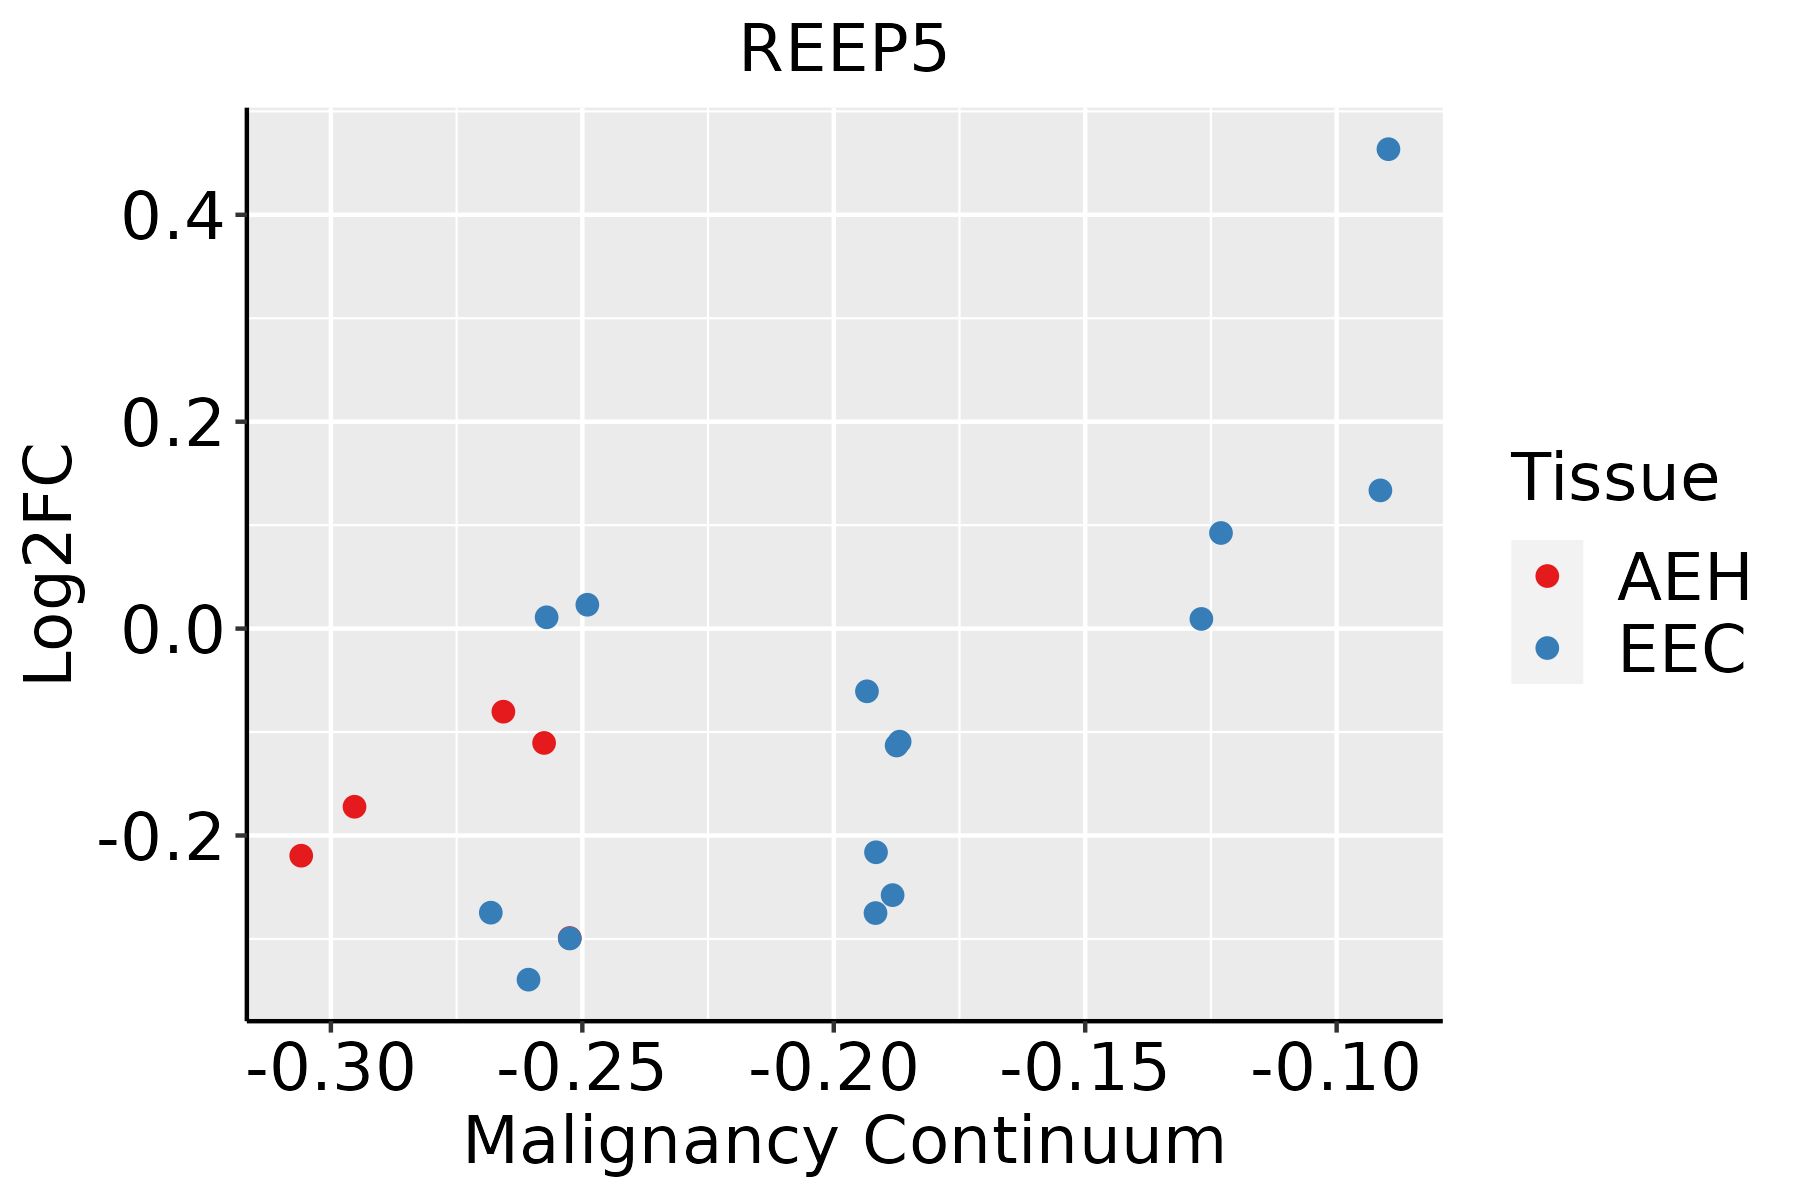 | AEH: Atypical endometrial hyperplasia |
| EEC: Endometrioid Cancer | ||
| Esophagus | 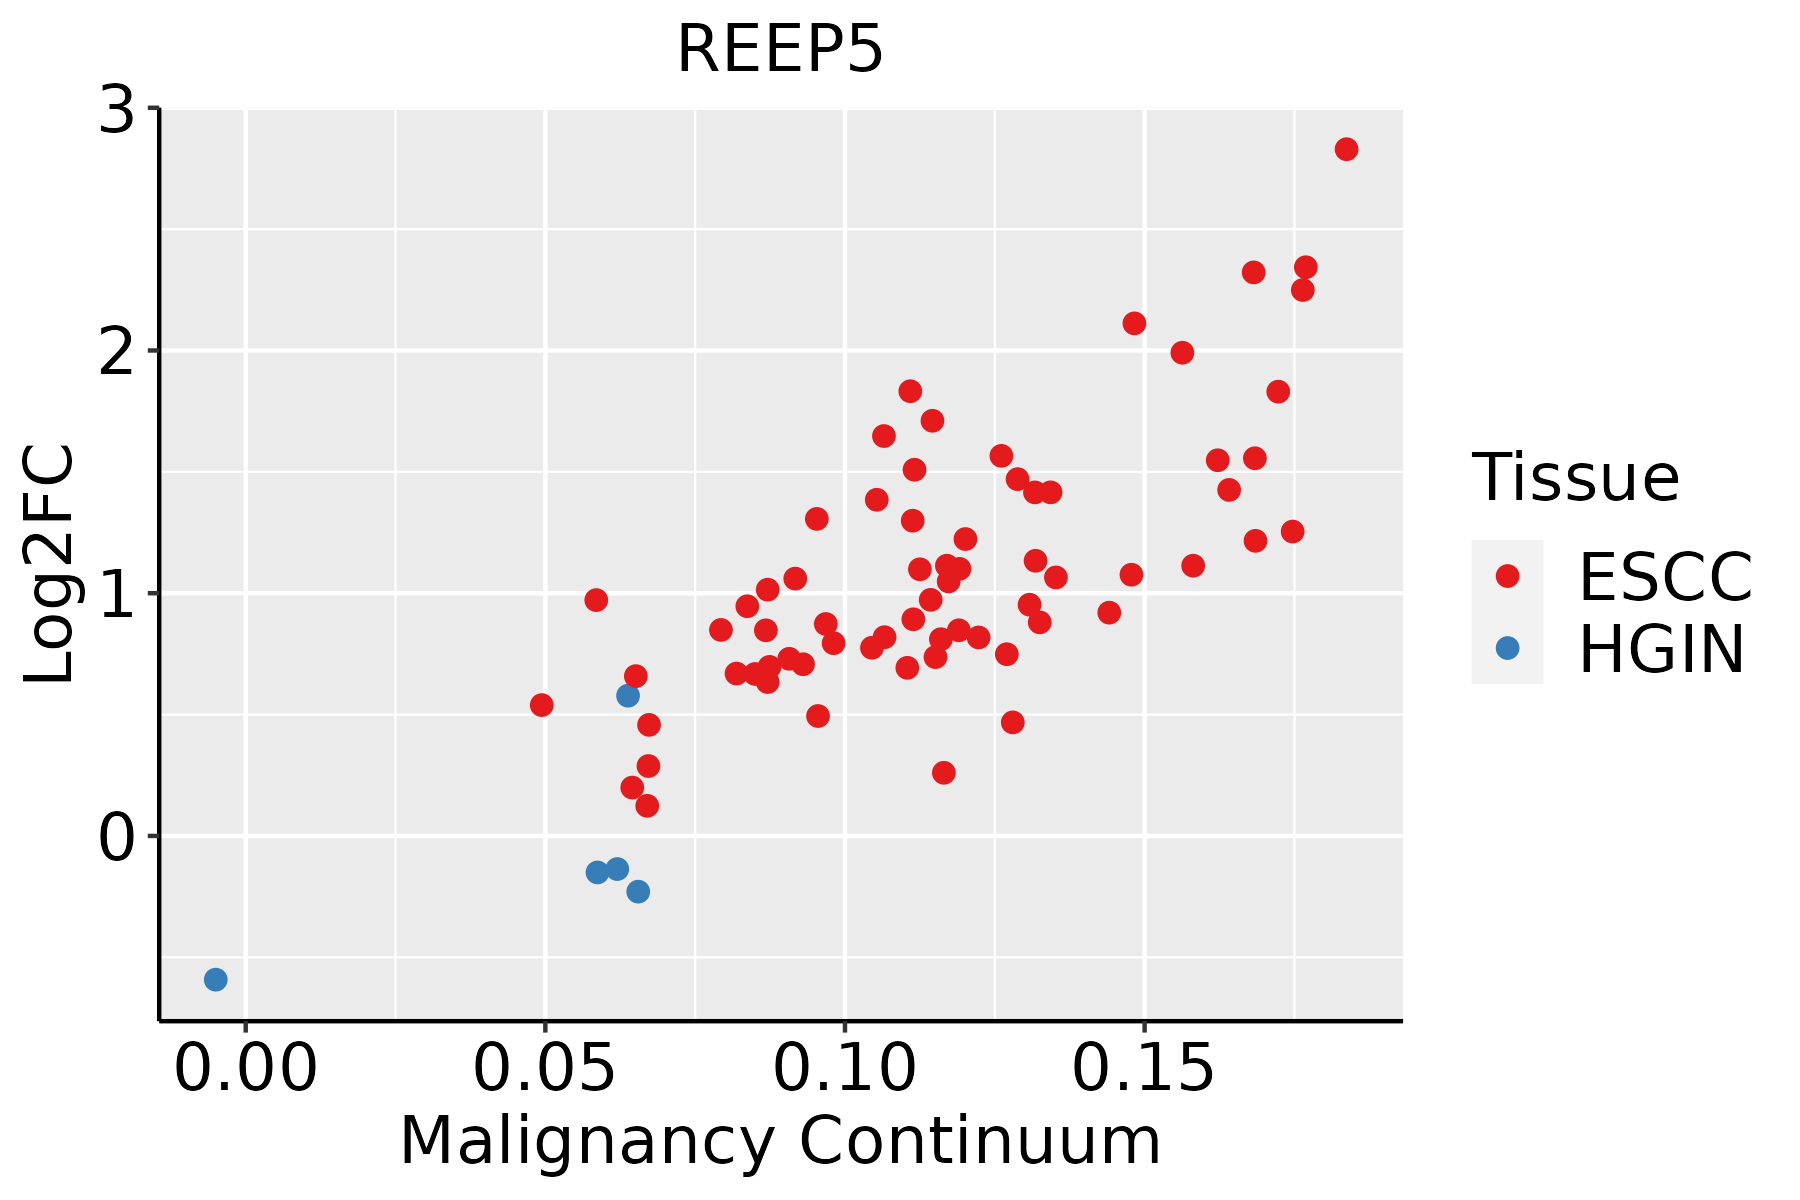 | ESCC: Esophageal squamous cell carcinoma |
| HGIN: High-grade intraepithelial neoplasias | ||
| LGIN: Low-grade intraepithelial neoplasias | ||
| Liver |  | HCC: Hepatocellular carcinoma |
| NAFLD: Non-alcoholic fatty liver disease | ||
| Oral Cavity | 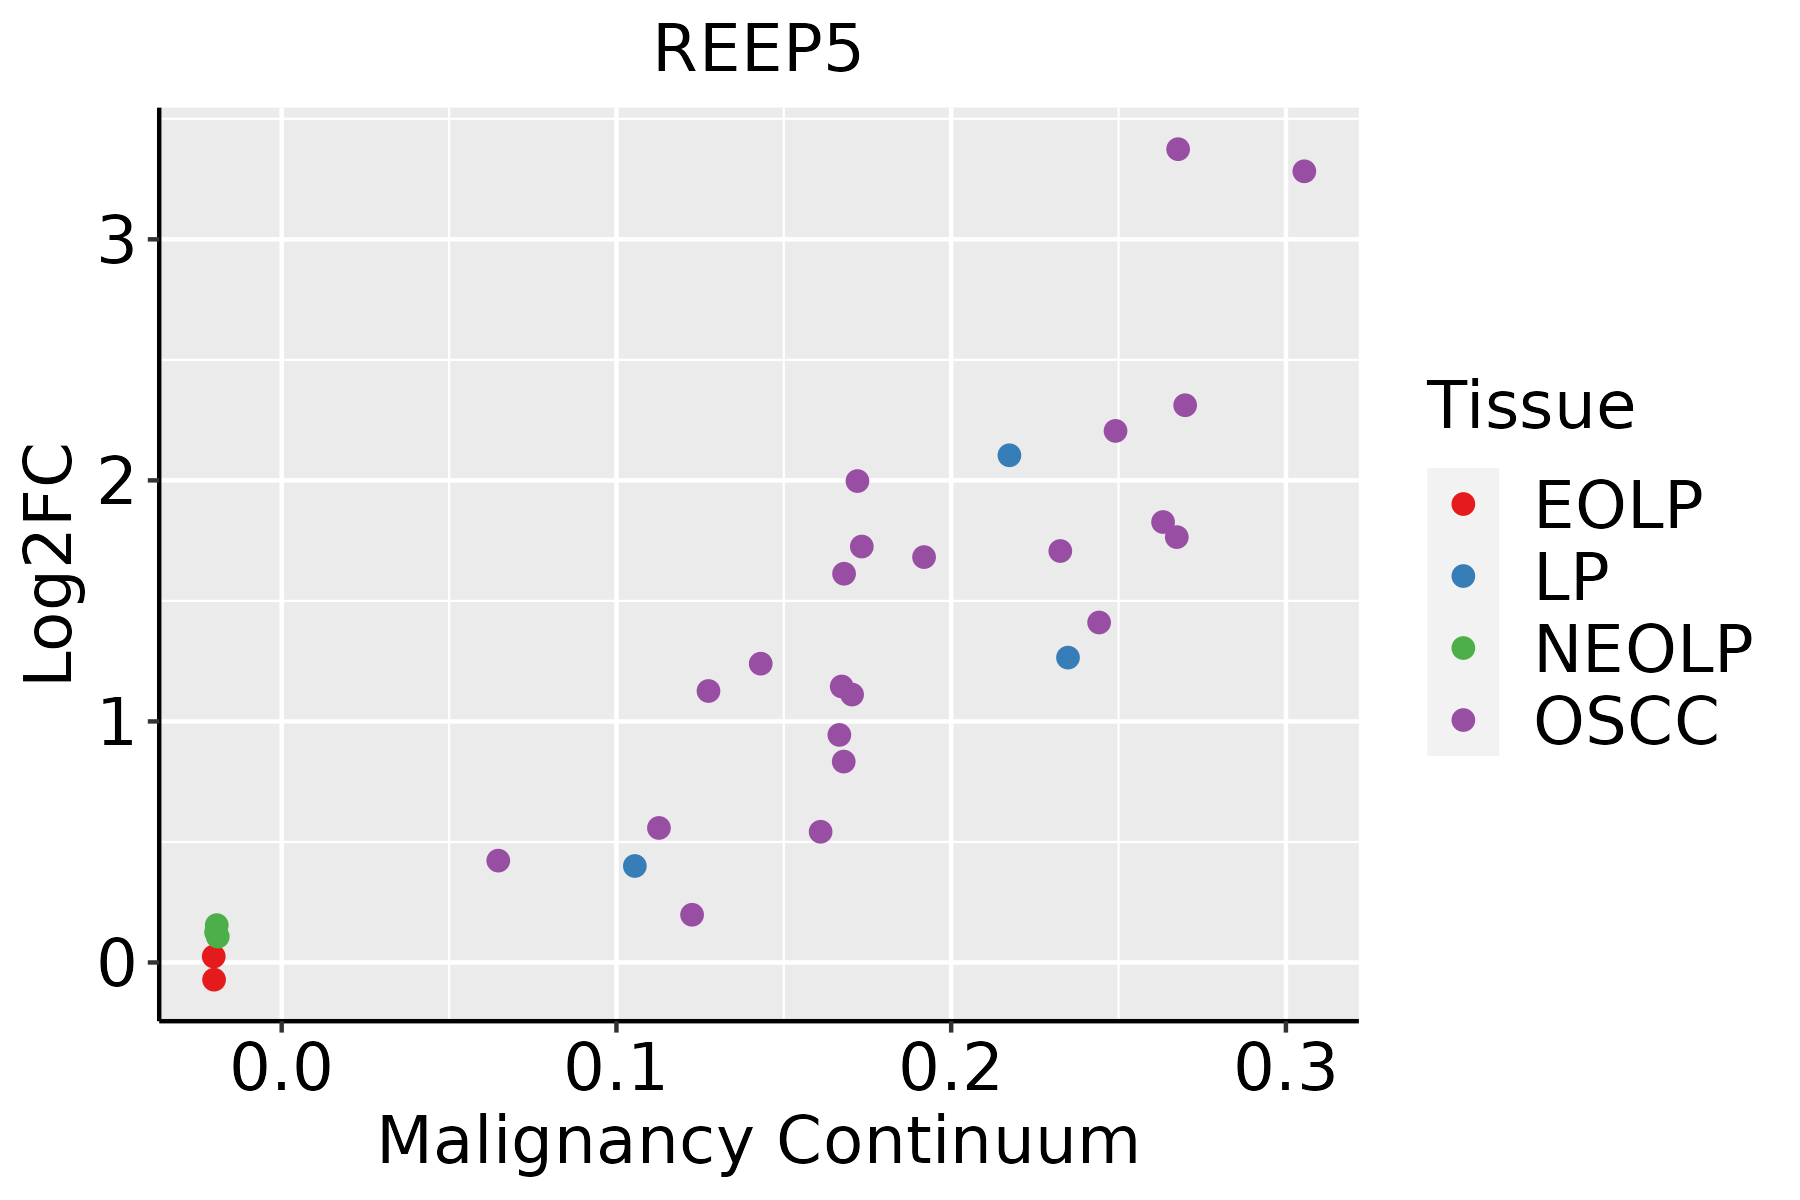 | EOLP: Erosive Oral lichen planus |
| LP: leukoplakia | ||
| NEOLP: Non-erosive oral lichen planus | ||
| OSCC: Oral squamous cell carcinoma | ||
| Prostate | 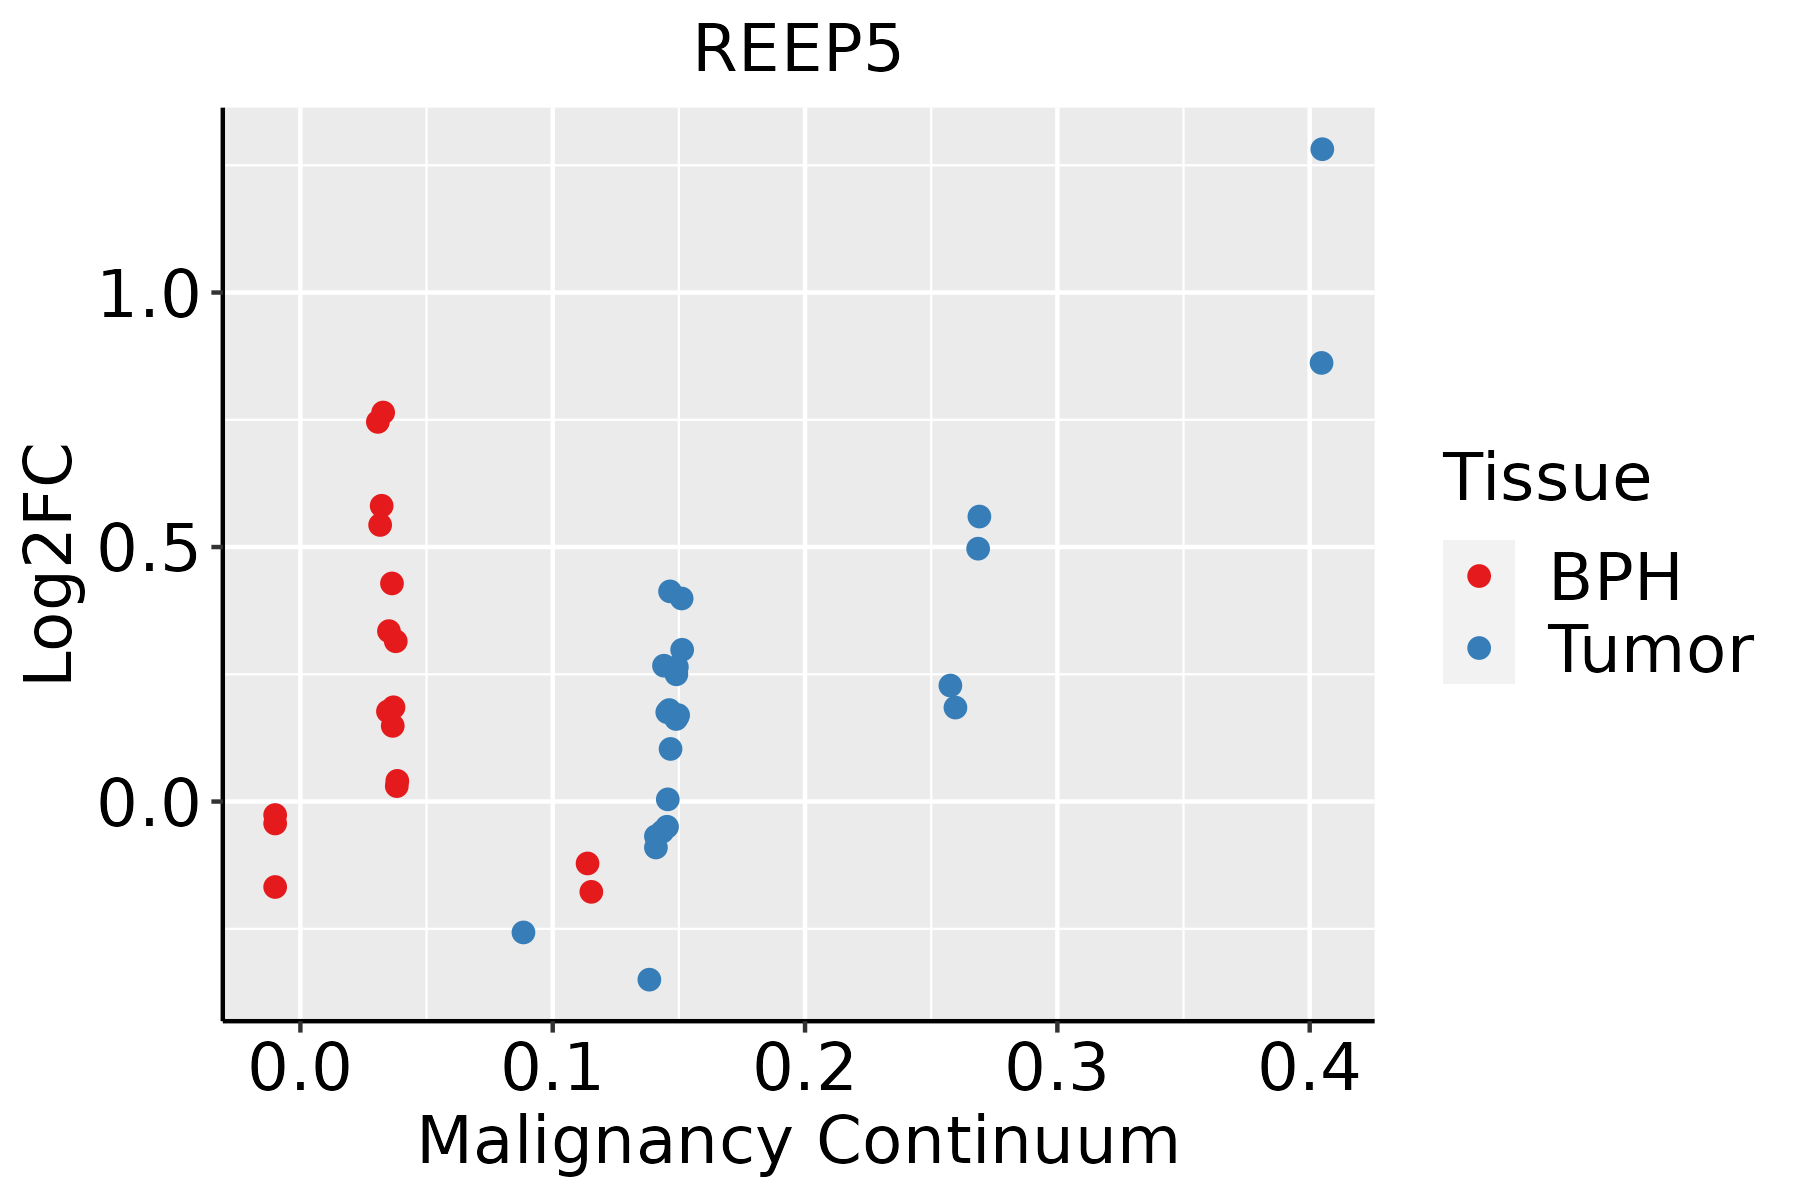 | BPH: Benign Prostatic Hyperplasia |
| Skin | 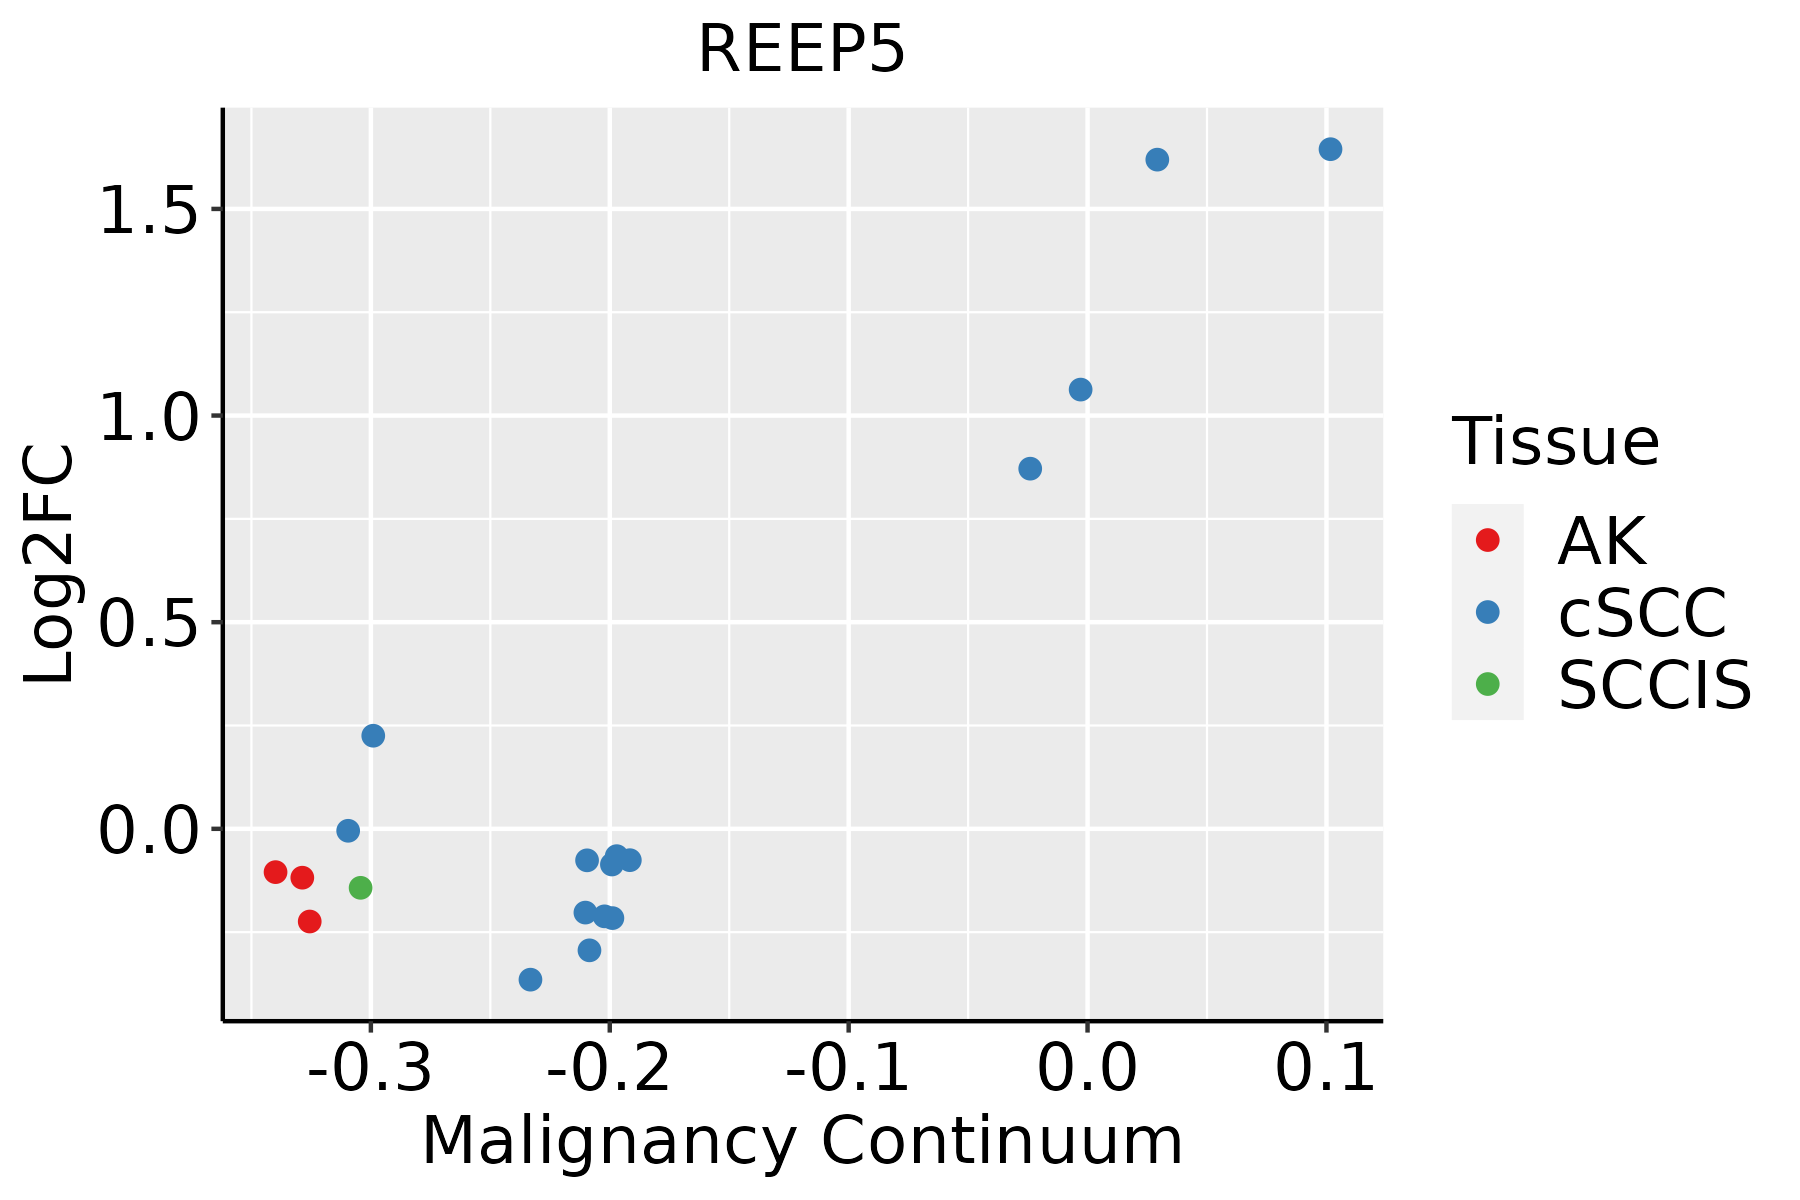 | AK: Actinic keratosis |
| cSCC: Cutaneous squamous cell carcinoma | ||
| SCCIS:squamous cell carcinoma in situ | ||
| Thyroid | 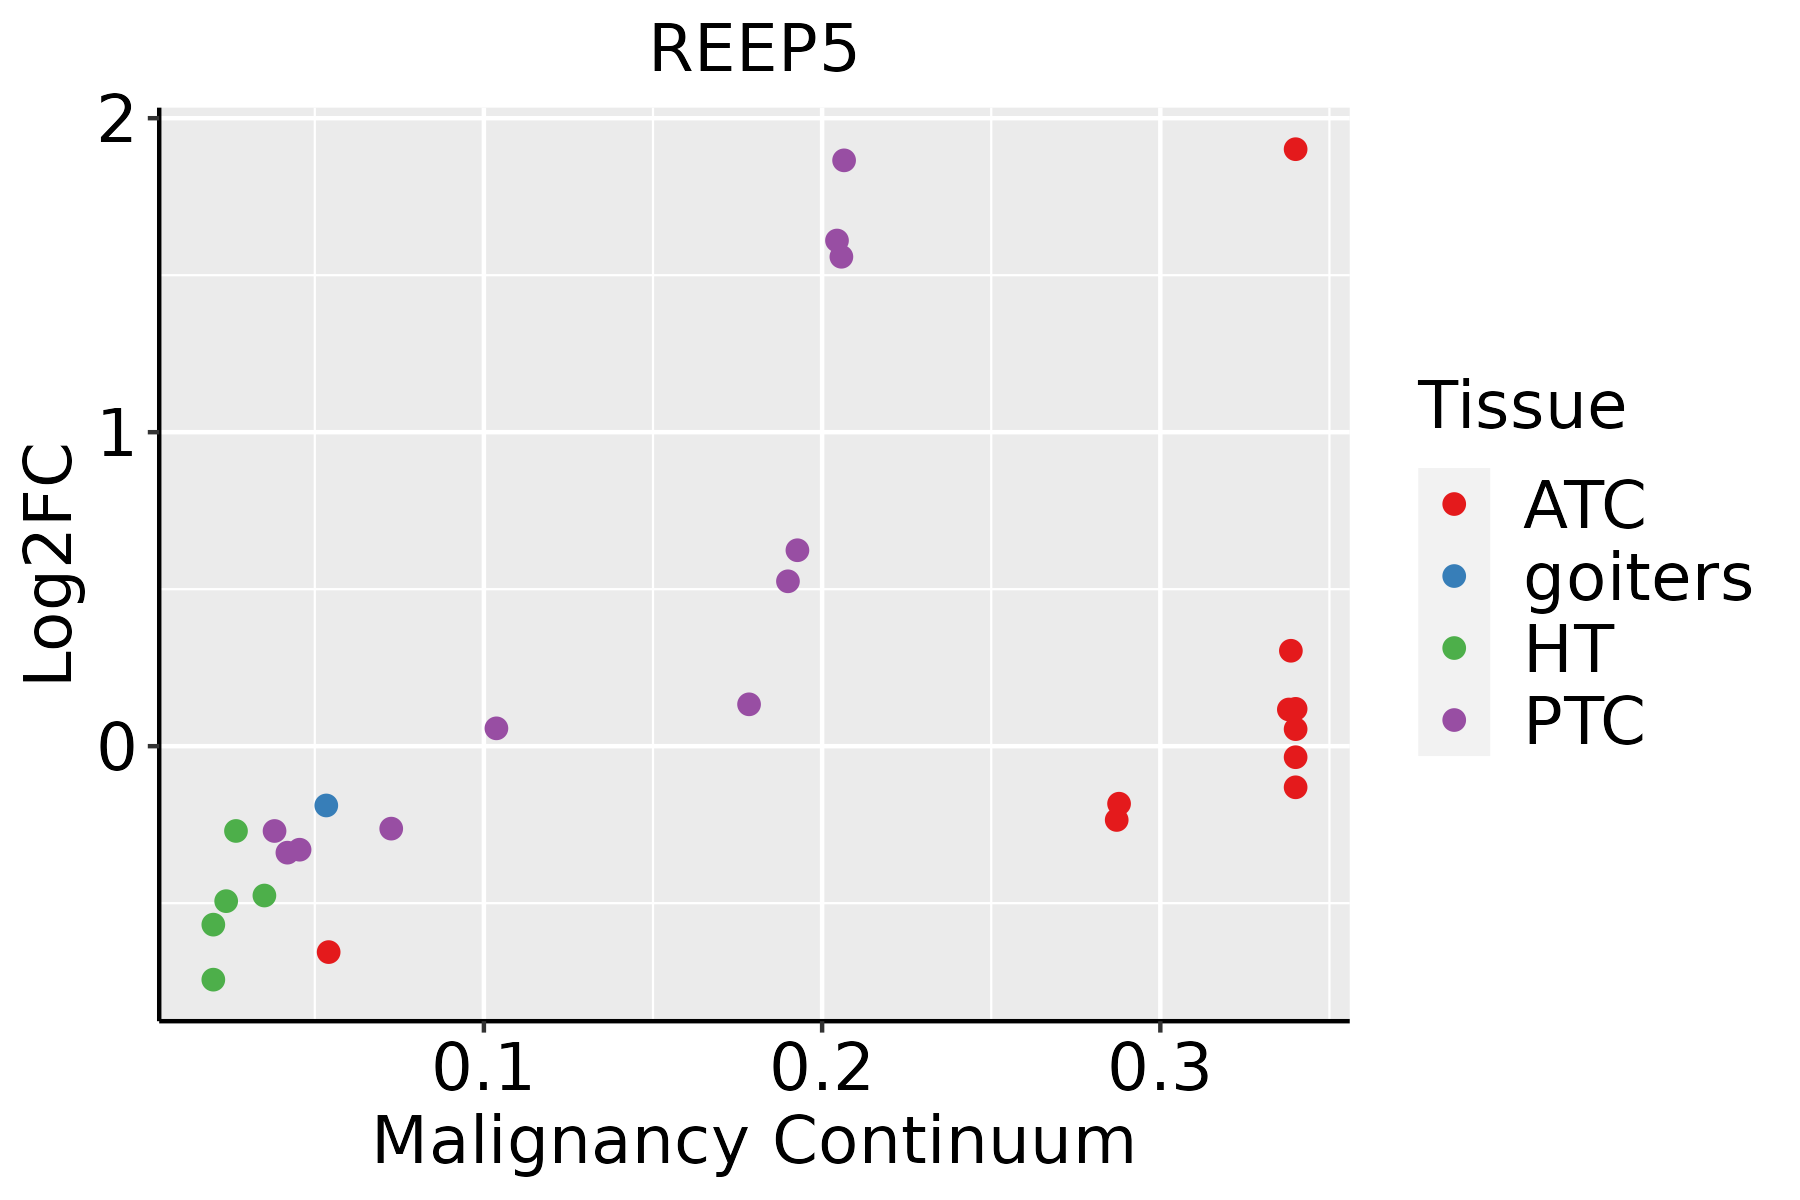 | ATC: Anaplastic thyroid cancer |
| HT: Hashimoto's thyroiditis | ||
| PTC: Papillary thyroid cancer |
| ∗log2FC in expression of this searched gene in stem-like cells from each diseased tissue sample relative to stem-like cells in normal samples in each tissue plotted against the malignancy continuum. Samples are colored based on if they are from different disease stage. |
Top |
Malignant transformation related pathway analysis |
| Find out the enriched GO biological processes and KEGG pathways involved in transition from healthy to precancer to cancer |
| Tissue | Disease Stage | Enriched GO biological Processes |
| Colorectum | AD |  |
| Colorectum | SER |  |
| Colorectum | MSS |  |
| Colorectum | MSI-H |  |
| Colorectum | FAP |  |
| ∗Top 15 enriched GO BP terms are showed in the bar plot of each disease state in each tissue. Each row represents a significant GO biological process which is colored according to the -log10(p.adjust). |
| Page: 1 2 3 4 5 6 7 8 9 |
| GO ID | Tissue | Disease Stage | Description | Gene Ratio | Bg Ratio | pvalue | p.adjust | Count |
| GO:00323868 | Cervix | CC | regulation of intracellular transport | 71/2311 | 337/18723 | 3.70e-06 | 9.74e-05 | 71 |
| GO:00323869 | Endometrium | AEH | regulation of intracellular transport | 66/2100 | 337/18723 | 4.18e-06 | 1.10e-04 | 66 |
| GO:003238613 | Endometrium | EEC | regulation of intracellular transport | 67/2168 | 337/18723 | 6.13e-06 | 1.48e-04 | 67 |
| GO:003238617 | Esophagus | HGIN | regulation of intracellular transport | 79/2587 | 337/18723 | 1.11e-06 | 4.36e-05 | 79 |
| GO:00070295 | Esophagus | HGIN | endoplasmic reticulum organization | 22/2587 | 87/18723 | 3.07e-03 | 2.90e-02 | 22 |
| GO:003238618 | Esophagus | ESCC | regulation of intracellular transport | 243/8552 | 337/18723 | 3.20e-23 | 7.25e-21 | 243 |
| GO:000702914 | Esophagus | ESCC | endoplasmic reticulum organization | 65/8552 | 87/18723 | 3.28e-08 | 6.08e-07 | 65 |
| GO:003238611 | Liver | Cirrhotic | regulation of intracellular transport | 147/4634 | 337/18723 | 1.84e-14 | 1.72e-12 | 147 |
| GO:00070292 | Liver | Cirrhotic | endoplasmic reticulum organization | 42/4634 | 87/18723 | 1.67e-06 | 3.22e-05 | 42 |
| GO:003238621 | Liver | HCC | regulation of intracellular transport | 231/7958 | 337/18723 | 1.99e-22 | 3.40e-20 | 231 |
| GO:000702911 | Liver | HCC | endoplasmic reticulum organization | 64/7958 | 87/18723 | 3.92e-09 | 1.04e-07 | 64 |
| GO:003238615 | Oral cavity | OSCC | regulation of intracellular transport | 218/7305 | 337/18723 | 6.91e-22 | 1.41e-19 | 218 |
| GO:00070294 | Oral cavity | OSCC | endoplasmic reticulum organization | 58/7305 | 87/18723 | 1.59e-07 | 2.61e-06 | 58 |
| GO:003238616 | Oral cavity | LP | regulation of intracellular transport | 145/4623 | 337/18723 | 8.58e-14 | 8.27e-12 | 145 |
| GO:000702913 | Oral cavity | LP | endoplasmic reticulum organization | 41/4623 | 87/18723 | 4.49e-06 | 9.16e-05 | 41 |
| GO:003238610 | Prostate | BPH | regulation of intracellular transport | 106/3107 | 337/18723 | 8.77e-12 | 6.70e-10 | 106 |
| GO:00070293 | Prostate | BPH | endoplasmic reticulum organization | 26/3107 | 87/18723 | 1.45e-03 | 8.61e-03 | 26 |
| GO:003238614 | Prostate | Tumor | regulation of intracellular transport | 111/3246 | 337/18723 | 1.83e-12 | 1.65e-10 | 111 |
| GO:000702912 | Prostate | Tumor | endoplasmic reticulum organization | 27/3246 | 87/18723 | 1.24e-03 | 7.83e-03 | 27 |
| GO:0032386110 | Skin | cSCC | regulation of intracellular transport | 156/4864 | 337/18723 | 4.48e-16 | 3.96e-14 | 156 |
| Page: 1 2 |
| Pathway ID | Tissue | Disease Stage | Description | Gene Ratio | Bg Ratio | pvalue | p.adjust | qvalue | Count |
| Page: 1 |
Top |
Cell-cell communication analysis |
| Identification of potential cell-cell interactions between two cell types and their ligand-receptor pairs for different disease states |
| Ligand | Receptor | LRpair | Pathway | Tissue | Disease Stage |
| Page: 1 |
Top |
Single-cell gene regulatory network inference analysis |
| Find out the significant the regulons (TFs) and the target genes of each regulon across cell types for different disease states |
| TF | Cell Type | Tissue | Disease Stage | Target Gene | RSS | Regulon Activity |
| ∗The dot plots of a searched regulon are shown for all cell subpopulations in each disease state of each tissue based on the regulon specific score inferred using pySCENIC and by calculating the average expression. |
| Page: 1 |
Top |
Somatic mutation of malignant transformation related genes |
| Annotation of somatic variants for genes involved in malignant transformation |
| Hugo Symbol | Variant Class | Variant Classification | dbSNP RS | HGVSc | HGVSp | HGVSp Short | SWISSPROT | BIOTYPE | SIFT | PolyPhen | Tumor Sample Barcode | Tissue | Histology | Sex | Age | Stage | Therapy Types | Drugs | Outcome |
| REEP5 | SNV | Missense_Mutation | novel | c.427C>G | p.Pro143Ala | p.P143A | Q00765 | protein_coding | deleterious(0) | probably_damaging(0.997) | TCGA-AC-A3W6-01 | Breast | breast invasive carcinoma | Female | >=65 | III/IV | Unknown | Unknown | SD |
| REEP5 | SNV | Missense_Mutation | c.79G>A | p.Glu27Lys | p.E27K | Q00765 | protein_coding | deleterious(0) | probably_damaging(0.994) | TCGA-C5-A3HE-01 | Cervix | cervical & endocervical cancer | Female | <65 | I/II | Unknown | Unknown | PD | |
| REEP5 | SNV | Missense_Mutation | novel | c.350N>T | p.Lys117Met | p.K117M | Q00765 | protein_coding | deleterious(0) | probably_damaging(1) | TCGA-VS-A94W-01 | Cervix | cervical & endocervical cancer | Female | <65 | I/II | Chemotherapy | cisplatin | CR |
| REEP5 | SNV | Missense_Mutation | novel | c.188N>A | p.Gly63Glu | p.G63E | Q00765 | protein_coding | deleterious(0) | probably_damaging(0.999) | TCGA-AA-3984-01 | Colorectum | colon adenocarcinoma | Female | <65 | I/II | Unknown | Unknown | SD |
| REEP5 | SNV | Missense_Mutation | novel | c.284N>G | p.Val95Gly | p.V95G | Q00765 | protein_coding | deleterious(0.03) | benign(0.213) | TCGA-AZ-4315-01 | Colorectum | colon adenocarcinoma | Male | <65 | I/II | Unknown | Unknown | SD |
| REEP5 | SNV | Missense_Mutation | rs755142860 | c.425G>A | p.Arg142His | p.R142H | Q00765 | protein_coding | deleterious(0.01) | possibly_damaging(0.804) | TCGA-AZ-6598-01 | Colorectum | colon adenocarcinoma | Female | >=65 | I/II | Unknown | Unknown | SD |
| REEP5 | SNV | Missense_Mutation | rs138223212 | c.416N>A | p.Arg139His | p.R139H | Q00765 | protein_coding | deleterious(0.04) | benign(0.087) | TCGA-EI-6882-01 | Colorectum | rectum adenocarcinoma | Male | <65 | I/II | Unknown | Unknown | SD |
| REEP5 | deletion | Frame_Shift_Del | c.380delN | p.Pro127ArgfsTer20 | p.P127Rfs*20 | Q00765 | protein_coding | TCGA-CK-5913-01 | Colorectum | colon adenocarcinoma | Female | <65 | I/II | Unknown | Unknown | SD | |||
| REEP5 | SNV | Missense_Mutation | novel | c.495G>T | p.Glu165Asp | p.E165D | Q00765 | protein_coding | tolerated(0.93) | benign(0.001) | TCGA-AJ-A3EK-01 | Endometrium | uterine corpus endometrioid carcinoma | Female | <65 | I/II | Chemotherapy | carboplatin | CR |
| REEP5 | SNV | Missense_Mutation | novel | c.442N>T | p.His148Tyr | p.H148Y | Q00765 | protein_coding | deleterious(0.04) | benign(0.061) | TCGA-AJ-A3EL-01 | Endometrium | uterine corpus endometrioid carcinoma | Female | <65 | I/II | Unknown | Unknown | SD |
| Page: 1 2 3 |
Top |
Related drugs of malignant transformation related genes |
| Identification of chemicals and drugs interact with genes involved in malignant transfromation |
| (DGIdb 4.0) |
| Entrez ID | Symbol | Category | Interaction Types | Drug Claim Name | Drug Name | PMIDs |
| 7905 | REEP5 | NA | sertraline | SERTRALINE | 22795047 | |
| 7905 | REEP5 | NA | citalopram | CITALOPRAM | 22795047 | |
| 7905 | REEP5 | NA | fluoxetine | FLUOXETINE | 22795047 | |
| 7905 | REEP5 | NA | paroxetine | PAROXETINE | 22795047 |
| Page: 1 |

Copyright 2023-Present -The University of Texas Health Science Center at Houston |