
|
|||||
|
 | |
| |
| |
| |
| |
| |
|
Gene: REEP3 |
Gene summary for REEP3 |
| Gene information | Species | Human | Gene symbol | REEP3 | Gene ID | 221035 |
| Gene name | receptor accessory protein 3 | |
| Gene Alias | C10orf74 | |
| Cytomap | 10q21.3 | |
| Gene Type | protein-coding | GO ID | GO:0000278 | UniProtAcc | Q6NUK4 |
Top |
Malignant transformation analysis |
| Identification of the aberrant gene expression in precancerous and cancerous lesions by comparing the gene expression of stem-like cells in diseased tissues with normal stem cells |
| Entrez ID | Symbol | Replicates | Species | Organ | Tissue | Adj P-value | Log2FC | Malignancy |
| 221035 | REEP3 | LZE2T | Human | Esophagus | ESCC | 1.69e-02 | 5.51e-01 | 0.082 |
| 221035 | REEP3 | LZE4T | Human | Esophagus | ESCC | 1.02e-07 | 7.52e-02 | 0.0811 |
| 221035 | REEP3 | LZE8T | Human | Esophagus | ESCC | 1.31e-02 | 2.55e-02 | 0.067 |
| 221035 | REEP3 | LZE20T | Human | Esophagus | ESCC | 3.16e-09 | 1.36e-01 | 0.0662 |
| 221035 | REEP3 | LZE24D1 | Human | Esophagus | HGIN | 4.62e-02 | 2.99e-01 | 0.054 |
| 221035 | REEP3 | LZE24T | Human | Esophagus | ESCC | 8.14e-10 | 4.93e-01 | 0.0596 |
| 221035 | REEP3 | LZE21T | Human | Esophagus | ESCC | 2.24e-07 | 2.43e-01 | 0.0655 |
| 221035 | REEP3 | P1T-E | Human | Esophagus | ESCC | 1.36e-14 | 6.89e-01 | 0.0875 |
| 221035 | REEP3 | P2T-E | Human | Esophagus | ESCC | 1.22e-28 | 6.07e-01 | 0.1177 |
| 221035 | REEP3 | P4T-E | Human | Esophagus | ESCC | 2.37e-29 | 7.72e-01 | 0.1323 |
| 221035 | REEP3 | P5T-E | Human | Esophagus | ESCC | 1.99e-42 | 9.33e-01 | 0.1327 |
| 221035 | REEP3 | P8T-E | Human | Esophagus | ESCC | 2.59e-33 | 7.14e-01 | 0.0889 |
| 221035 | REEP3 | P9T-E | Human | Esophagus | ESCC | 2.69e-10 | 2.49e-01 | 0.1131 |
| 221035 | REEP3 | P10T-E | Human | Esophagus | ESCC | 2.83e-22 | 3.97e-01 | 0.116 |
| 221035 | REEP3 | P11T-E | Human | Esophagus | ESCC | 1.59e-14 | 6.51e-01 | 0.1426 |
| 221035 | REEP3 | P12T-E | Human | Esophagus | ESCC | 1.60e-29 | 5.49e-01 | 0.1122 |
| 221035 | REEP3 | P15T-E | Human | Esophagus | ESCC | 2.62e-27 | 7.08e-01 | 0.1149 |
| 221035 | REEP3 | P16T-E | Human | Esophagus | ESCC | 8.58e-29 | 3.78e-01 | 0.1153 |
| 221035 | REEP3 | P17T-E | Human | Esophagus | ESCC | 6.10e-14 | 5.73e-01 | 0.1278 |
| 221035 | REEP3 | P20T-E | Human | Esophagus | ESCC | 1.33e-21 | 5.62e-01 | 0.1124 |
| Page: 1 2 3 4 5 6 7 |
| Tissue | Expression Dynamics | Abbreviation |
| Esophagus | 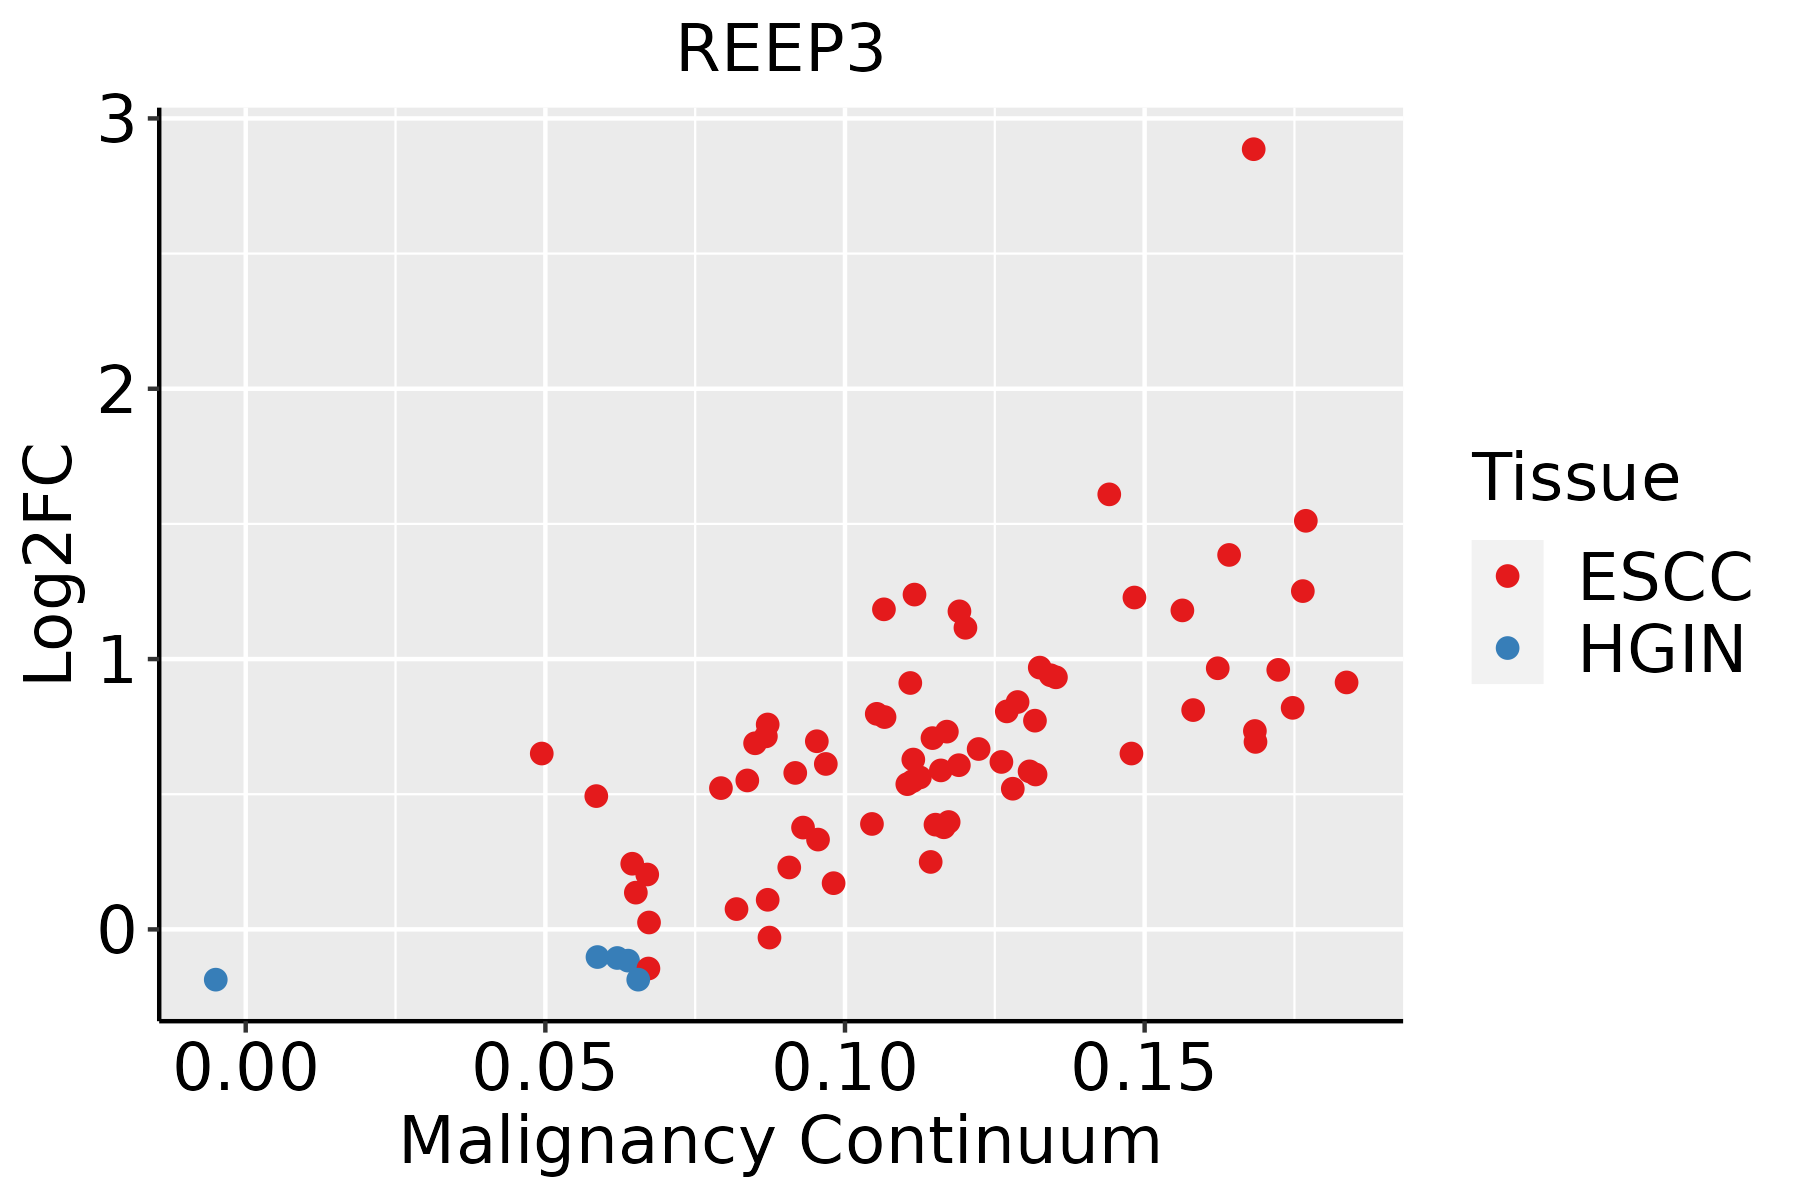 | ESCC: Esophageal squamous cell carcinoma |
| HGIN: High-grade intraepithelial neoplasias | ||
| LGIN: Low-grade intraepithelial neoplasias | ||
| Liver | 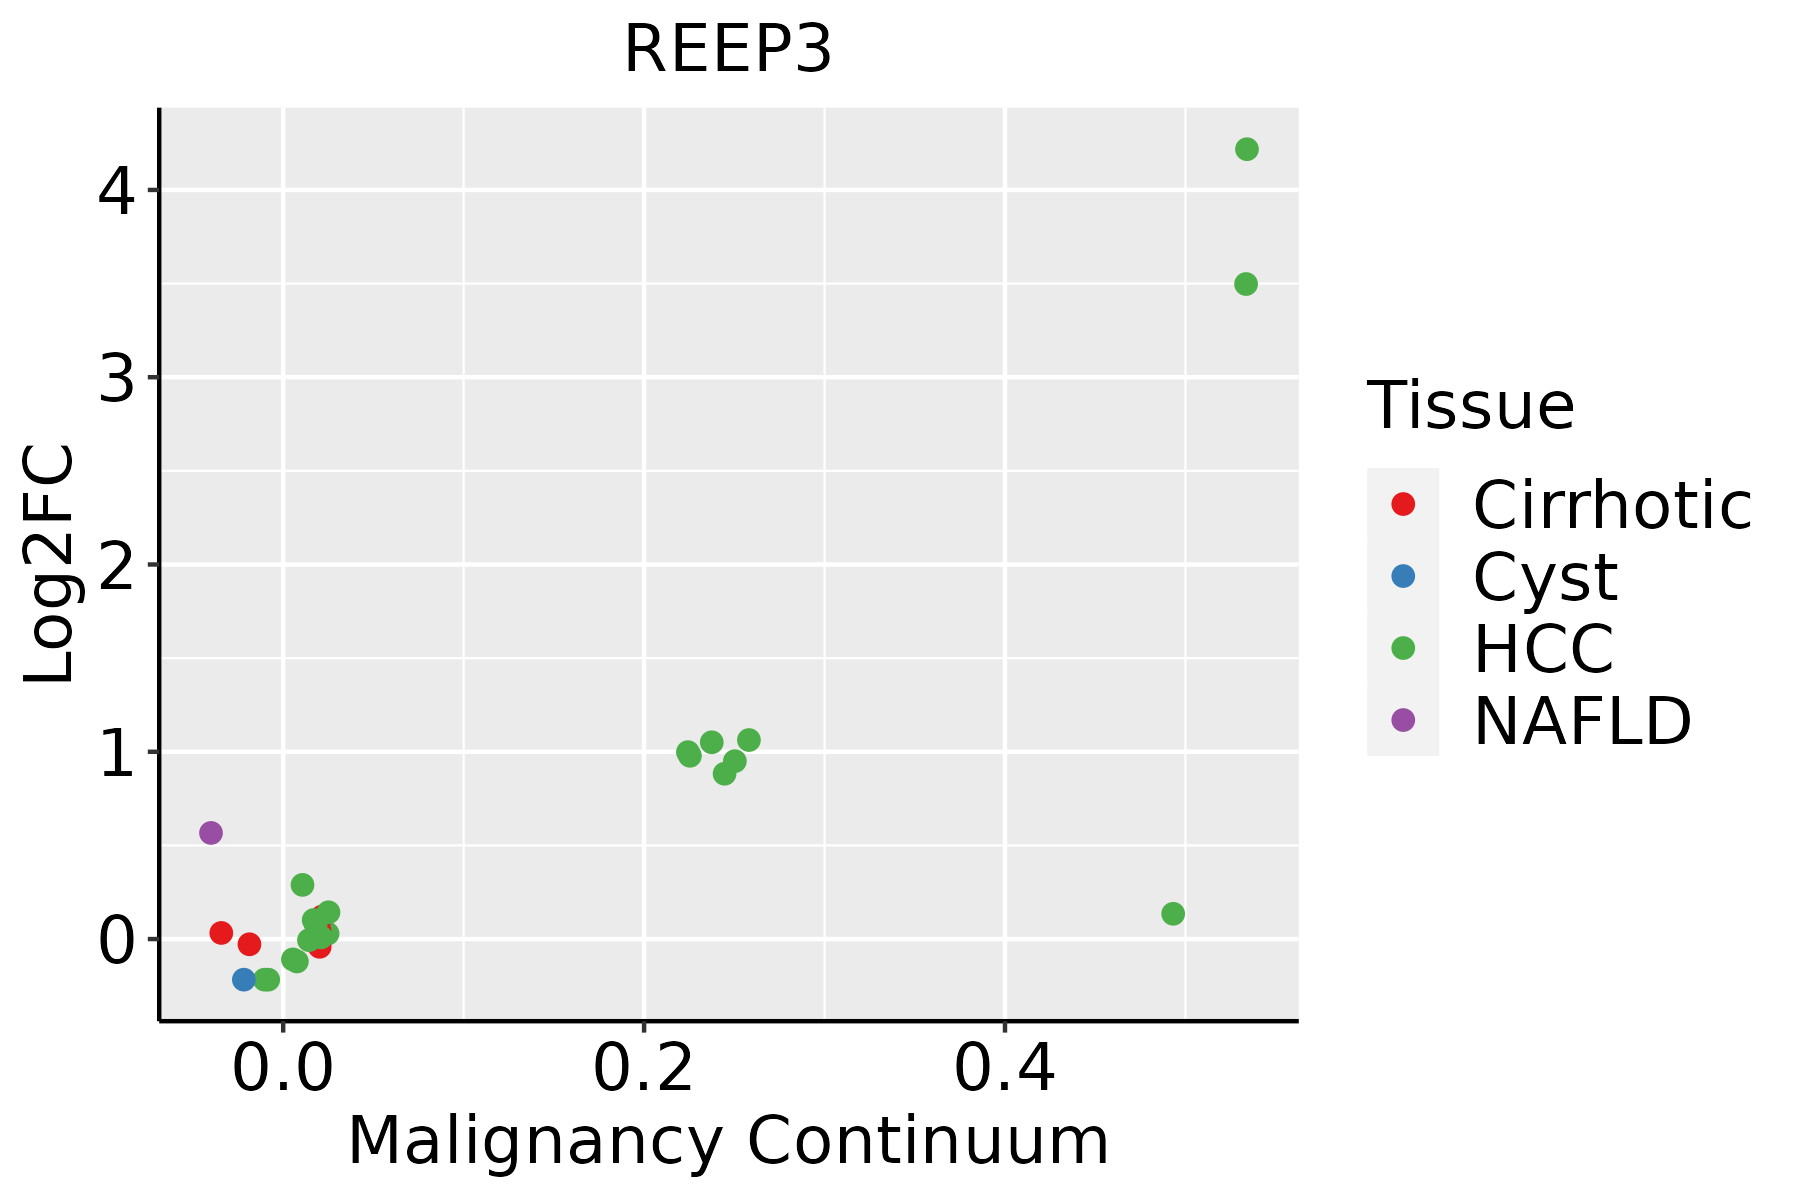 | HCC: Hepatocellular carcinoma |
| NAFLD: Non-alcoholic fatty liver disease | ||
| Lung |  | AAH: Atypical adenomatous hyperplasia |
| AIS: Adenocarcinoma in situ | ||
| IAC: Invasive lung adenocarcinoma | ||
| MIA: Minimally invasive adenocarcinoma | ||
| Oral Cavity | 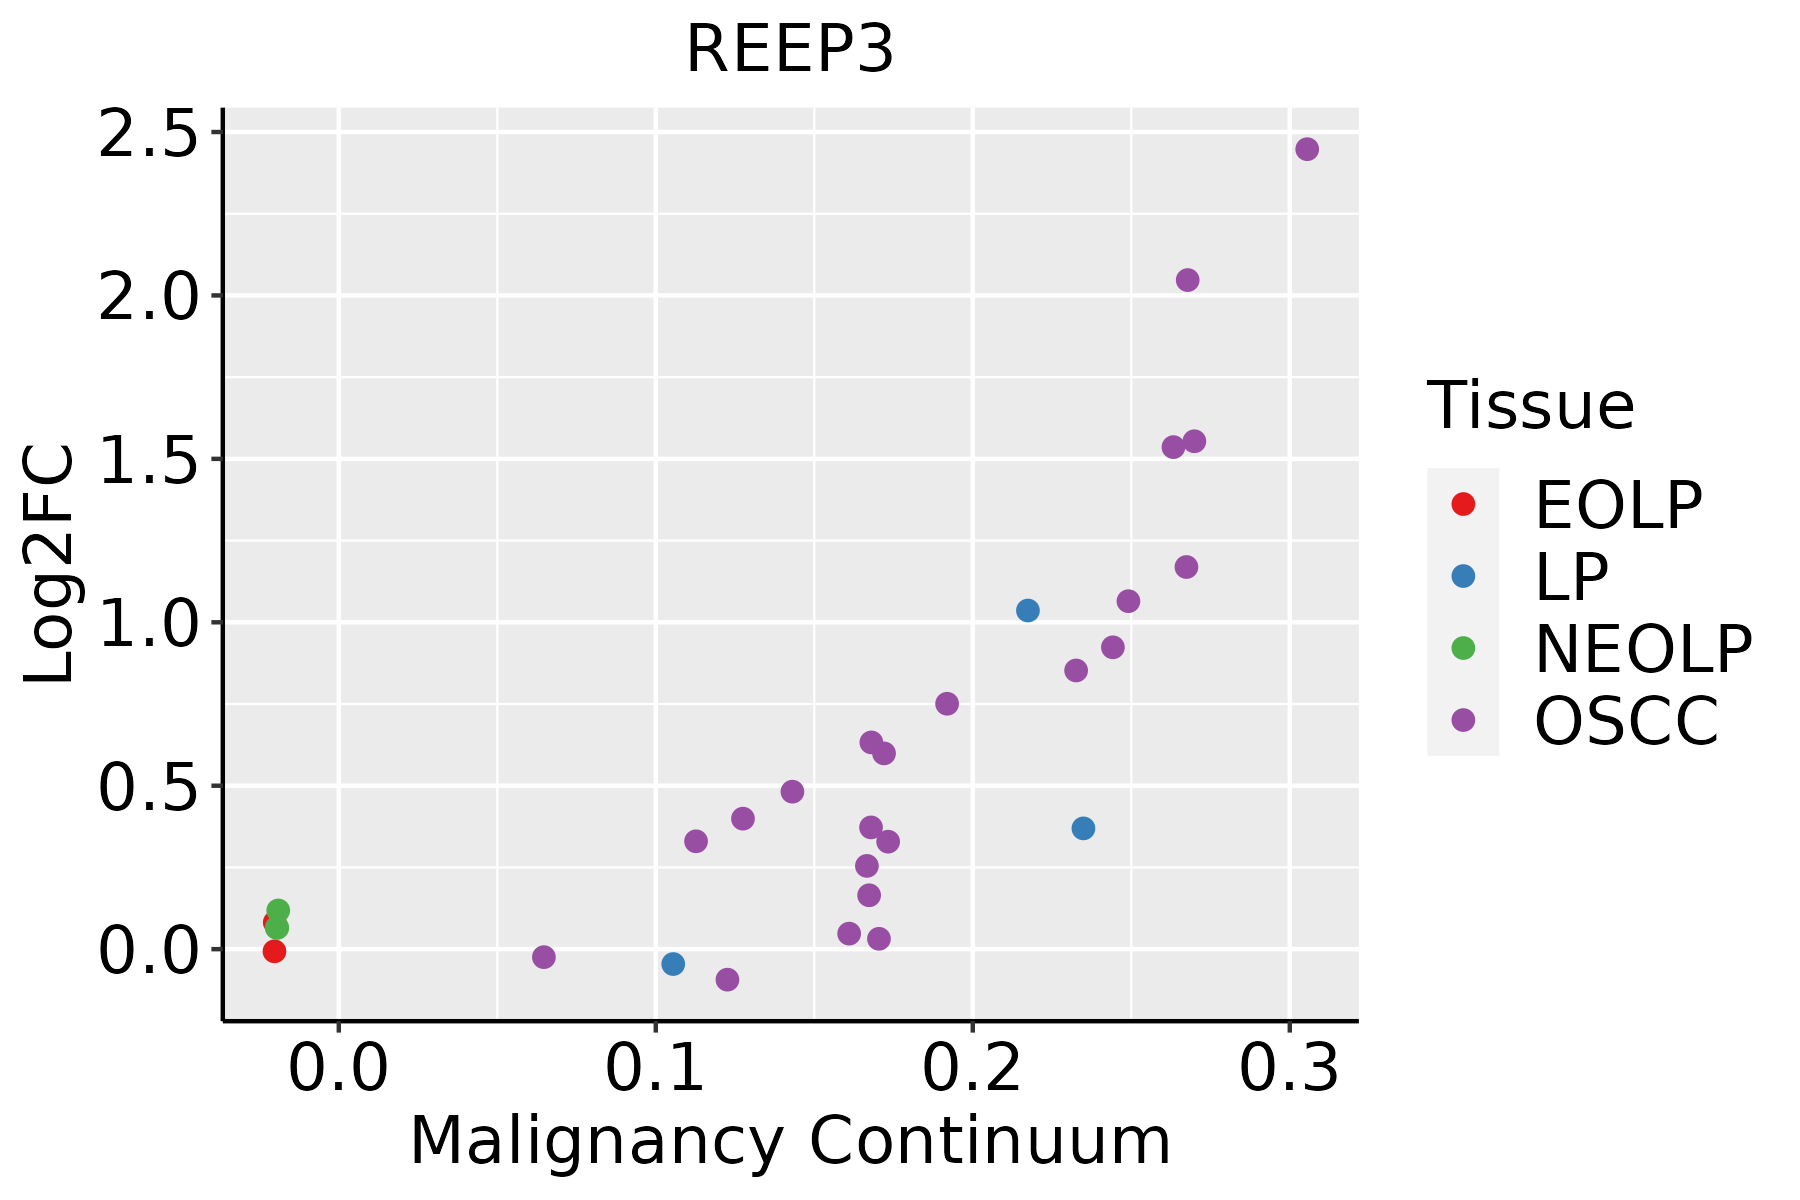 | EOLP: Erosive Oral lichen planus |
| LP: leukoplakia | ||
| NEOLP: Non-erosive oral lichen planus | ||
| OSCC: Oral squamous cell carcinoma | ||
| Prostate |  | BPH: Benign Prostatic Hyperplasia |
| Skin | 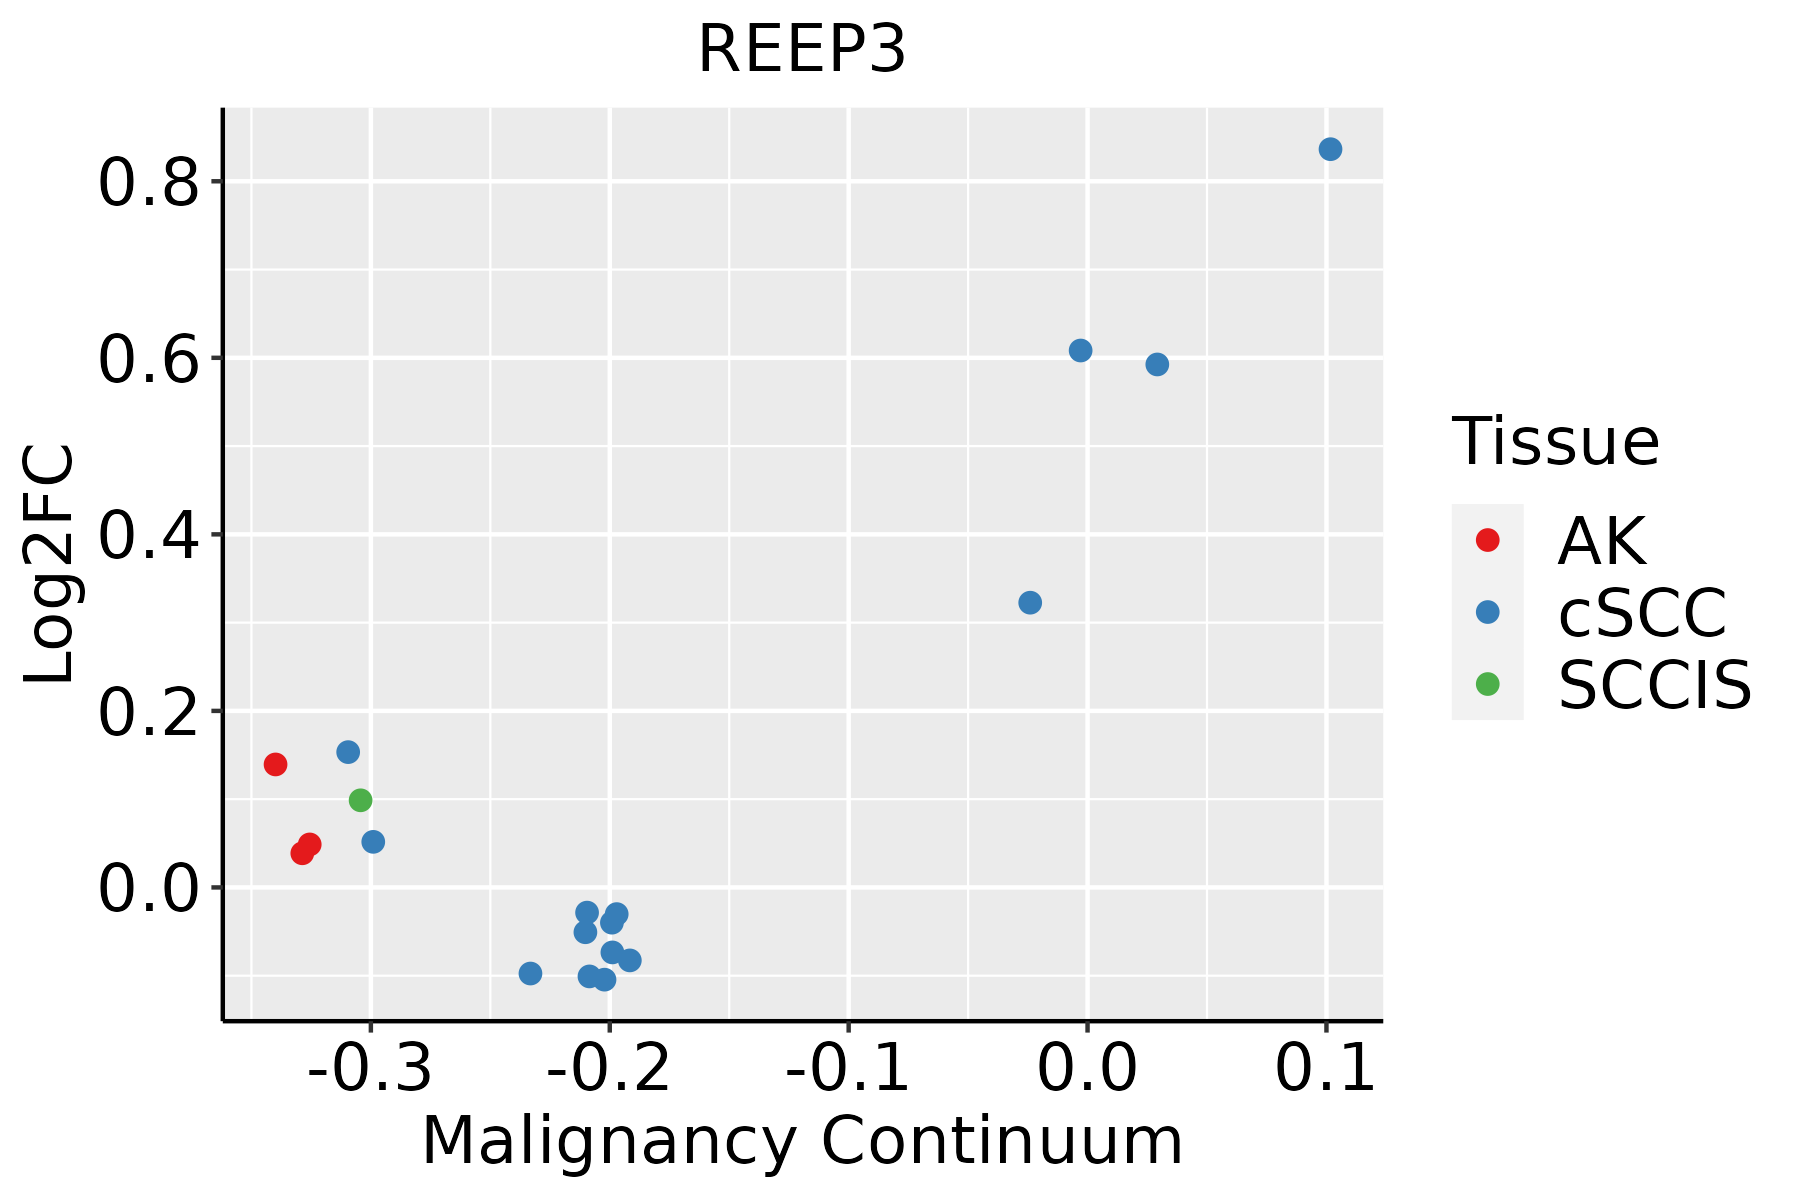 | AK: Actinic keratosis |
| cSCC: Cutaneous squamous cell carcinoma | ||
| SCCIS:squamous cell carcinoma in situ | ||
| Thyroid | 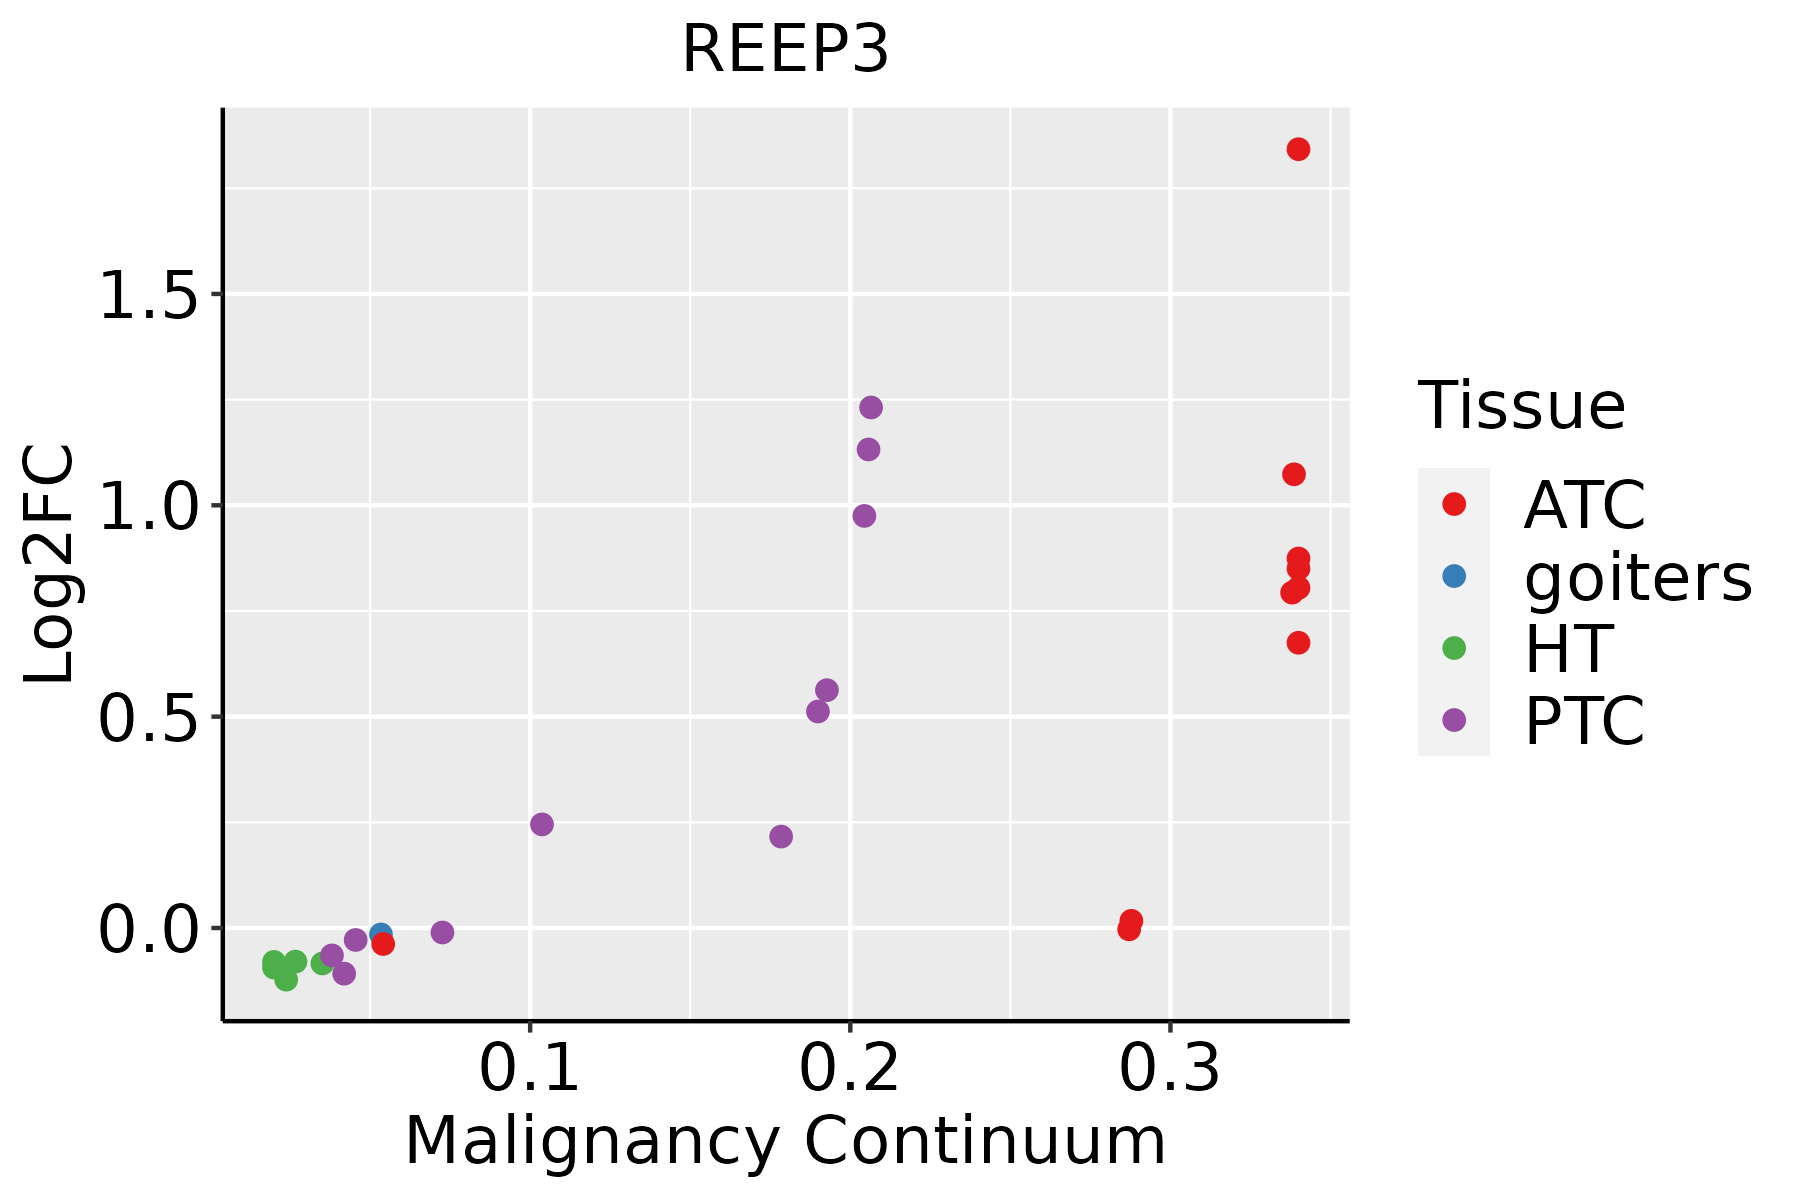 | ATC: Anaplastic thyroid cancer |
| HT: Hashimoto's thyroiditis | ||
| PTC: Papillary thyroid cancer |
| ∗log2FC in expression of this searched gene in stem-like cells from each diseased tissue sample relative to stem-like cells in normal samples in each tissue plotted against the malignancy continuum. Samples are colored based on if they are from different disease stage. |
Top |
Malignant transformation related pathway analysis |
| Find out the enriched GO biological processes and KEGG pathways involved in transition from healthy to precancer to cancer |
| Tissue | Disease Stage | Enriched GO biological Processes |
| Colorectum | AD |  |
| Colorectum | SER |  |
| Colorectum | MSS |  |
| Colorectum | MSI-H |  |
| Colorectum | FAP |  |
| ∗Top 15 enriched GO BP terms are showed in the bar plot of each disease state in each tissue. Each row represents a significant GO biological process which is colored according to the -log10(p.adjust). |
| Page: 1 2 3 4 5 6 7 8 9 |
| GO ID | Tissue | Disease Stage | Description | Gene Ratio | Bg Ratio | pvalue | p.adjust | Count |
| GO:014001414 | Esophagus | ESCC | mitotic nuclear division | 218/8552 | 287/18723 | 6.17e-26 | 1.78e-23 | 218 |
| GO:00482853 | Esophagus | ESCC | organelle fission | 301/8552 | 488/18723 | 4.64e-13 | 2.12e-11 | 301 |
| GO:00002802 | Esophagus | ESCC | nuclear division | 270/8552 | 439/18723 | 1.17e-11 | 4.24e-10 | 270 |
| GO:000699713 | Esophagus | ESCC | nucleus organization | 96/8552 | 133/18723 | 4.66e-10 | 1.21e-08 | 96 |
| GO:000702914 | Esophagus | ESCC | endoplasmic reticulum organization | 65/8552 | 87/18723 | 3.28e-08 | 6.08e-07 | 65 |
| GO:000699811 | Esophagus | ESCC | nuclear envelope organization | 39/8552 | 47/18723 | 1.48e-07 | 2.35e-06 | 39 |
| GO:007176312 | Esophagus | ESCC | nuclear membrane organization | 29/8552 | 33/18723 | 5.30e-07 | 7.04e-06 | 29 |
| GO:003146811 | Esophagus | ESCC | nuclear envelope reassembly | 14/8552 | 14/18723 | 1.71e-05 | 1.52e-04 | 14 |
| GO:00440918 | Esophagus | ESCC | membrane biogenesis | 38/8552 | 55/18723 | 3.78e-04 | 2.19e-03 | 38 |
| GO:00717099 | Esophagus | ESCC | membrane assembly | 35/8552 | 50/18723 | 4.33e-04 | 2.44e-03 | 35 |
| GO:00717865 | Esophagus | ESCC | endoplasmic reticulum tubular network organization | 15/8552 | 18/18723 | 1.20e-03 | 5.88e-03 | 15 |
| GO:00717863 | Liver | NAFLD | endoplasmic reticulum tubular network organization | 6/1882 | 18/18723 | 6.55e-03 | 4.69e-02 | 6 |
| GO:00070292 | Liver | Cirrhotic | endoplasmic reticulum organization | 42/4634 | 87/18723 | 1.67e-06 | 3.22e-05 | 42 |
| GO:01400142 | Liver | Cirrhotic | mitotic nuclear division | 97/4634 | 287/18723 | 3.32e-04 | 2.87e-03 | 97 |
| GO:00440914 | Liver | Cirrhotic | membrane biogenesis | 25/4634 | 55/18723 | 6.51e-04 | 4.96e-03 | 25 |
| GO:00717094 | Liver | Cirrhotic | membrane assembly | 23/4634 | 50/18723 | 8.62e-04 | 6.22e-03 | 23 |
| GO:00717861 | Liver | Cirrhotic | endoplasmic reticulum tubular network organization | 11/4634 | 18/18723 | 1.13e-03 | 7.73e-03 | 11 |
| GO:0006997 | Liver | Cirrhotic | nucleus organization | 48/4634 | 133/18723 | 2.27e-03 | 1.38e-02 | 48 |
| GO:0071763 | Liver | Cirrhotic | nuclear membrane organization | 15/4634 | 33/18723 | 7.61e-03 | 3.60e-02 | 15 |
| GO:014001411 | Liver | HCC | mitotic nuclear division | 174/7958 | 287/18723 | 3.74e-10 | 1.23e-08 | 174 |
| Page: 1 2 3 4 5 |
| Pathway ID | Tissue | Disease Stage | Description | Gene Ratio | Bg Ratio | pvalue | p.adjust | qvalue | Count |
| Page: 1 |
Top |
Cell-cell communication analysis |
| Identification of potential cell-cell interactions between two cell types and their ligand-receptor pairs for different disease states |
| Ligand | Receptor | LRpair | Pathway | Tissue | Disease Stage |
| Page: 1 |
Top |
Single-cell gene regulatory network inference analysis |
| Find out the significant the regulons (TFs) and the target genes of each regulon across cell types for different disease states |
| TF | Cell Type | Tissue | Disease Stage | Target Gene | RSS | Regulon Activity |
| ∗The dot plots of a searched regulon are shown for all cell subpopulations in each disease state of each tissue based on the regulon specific score inferred using pySCENIC and by calculating the average expression. |
| Page: 1 |
Top |
Somatic mutation of malignant transformation related genes |
| Annotation of somatic variants for genes involved in malignant transformation |
| Hugo Symbol | Variant Class | Variant Classification | dbSNP RS | HGVSc | HGVSp | HGVSp Short | SWISSPROT | BIOTYPE | SIFT | PolyPhen | Tumor Sample Barcode | Tissue | Histology | Sex | Age | Stage | Therapy Types | Drugs | Outcome |
| REEP3 | insertion | Nonsense_Mutation | novel | c.297_298insTGGAAGTTGCAGTAAGCCGAGATTGCACCACTGCACTCCACCCT | p.Glu100TrpfsTer5 | p.E100Wfs*5 | Q6NUK4 | protein_coding | TCGA-AR-A0TY-01 | Breast | breast invasive carcinoma | Female | <65 | I/II | Unspecific | Paclitaxel | PD | ||
| REEP3 | SNV | Missense_Mutation | rs747010885 | c.197N>G | p.Tyr66Cys | p.Y66C | Q6NUK4 | protein_coding | deleterious(0.02) | benign(0.148) | TCGA-AA-3966-01 | Colorectum | colon adenocarcinoma | Female | >=65 | I/II | Unknown | Unknown | SD |
| REEP3 | SNV | Missense_Mutation | c.653N>G | p.Lys218Arg | p.K218R | Q6NUK4 | protein_coding | tolerated(0.31) | benign(0.003) | TCGA-AA-A02R-01 | Colorectum | colon adenocarcinoma | Female | >=65 | I/II | Unknown | Unknown | PD | |
| REEP3 | SNV | Missense_Mutation | novel | c.440N>A | p.Arg147His | p.R147H | Q6NUK4 | protein_coding | tolerated(0.08) | possibly_damaging(0.556) | TCGA-EI-6917-01 | Colorectum | rectum adenocarcinoma | Male | <65 | III/IV | Chemotherapy | 5fluorouracil+oxaciplatina+l-folinian | SD |
| REEP3 | deletion | Frame_Shift_Del | c.131delN | p.Phe45LeufsTer6 | p.F45Lfs*6 | Q6NUK4 | protein_coding | TCGA-A6-6653-01 | Colorectum | colon adenocarcinoma | Male | >=65 | I/II | Unknown | Unknown | SD | |||
| REEP3 | deletion | Frame_Shift_Del | c.271delN | p.Phe91SerfsTer29 | p.F91Sfs*29 | Q6NUK4 | protein_coding | TCGA-F5-6812-01 | Colorectum | rectum adenocarcinoma | Male | >=65 | I/II | Unknown | Unknown | SD | |||
| REEP3 | SNV | Missense_Mutation | rs773095084 | c.703N>T | p.Arg235Cys | p.R235C | Q6NUK4 | protein_coding | deleterious(0.02) | probably_damaging(0.997) | TCGA-A5-A1OF-01 | Endometrium | uterine corpus endometrioid carcinoma | Female | <65 | I/II | Unknown | Unknown | SD |
| REEP3 | SNV | Missense_Mutation | novel | c.290C>A | p.Ser97Tyr | p.S97Y | Q6NUK4 | protein_coding | deleterious(0) | probably_damaging(0.95) | TCGA-AX-A2HC-01 | Endometrium | uterine corpus endometrioid carcinoma | Female | <65 | III/IV | Chemotherapy | paclitaxel | PD |
| REEP3 | SNV | Missense_Mutation | rs371406997 | c.668C>T | p.Ser223Leu | p.S223L | Q6NUK4 | protein_coding | deleterious(0) | benign(0.375) | TCGA-AX-A2HC-01 | Endometrium | uterine corpus endometrioid carcinoma | Female | <65 | III/IV | Chemotherapy | paclitaxel | PD |
| REEP3 | SNV | Missense_Mutation | novel | c.286N>A | p.Leu96Ile | p.L96I | Q6NUK4 | protein_coding | deleterious(0) | probably_damaging(0.998) | TCGA-B5-A3FC-01 | Endometrium | uterine corpus endometrioid carcinoma | Female | <65 | I/II | Unknown | Unknown | SD |
| Page: 1 2 |
Top |
Related drugs of malignant transformation related genes |
| Identification of chemicals and drugs interact with genes involved in malignant transfromation |
| (DGIdb 4.0) |
| Entrez ID | Symbol | Category | Interaction Types | Drug Claim Name | Drug Name | PMIDs |
| Page: 1 |

Copyright 2023-Present -The University of Texas Health Science Center at Houston |