
|
|||||
|
 | |
| |
| |
| |
| |
| |
|
Gene: REEP2 |
Gene summary for REEP2 |
| Gene information | Species | Human | Gene symbol | REEP2 | Gene ID | 51308 |
| Gene name | receptor accessory protein 2 | |
| Gene Alias | C5orf19 | |
| Cytomap | 5q31.2 | |
| Gene Type | protein-coding | GO ID | GO:0003008 | UniProtAcc | A8K3D2 |
Top |
Malignant transformation analysis |
| Identification of the aberrant gene expression in precancerous and cancerous lesions by comparing the gene expression of stem-like cells in diseased tissues with normal stem cells |
| Entrez ID | Symbol | Replicates | Species | Organ | Tissue | Adj P-value | Log2FC | Malignancy |
| 51308 | REEP2 | P2T-E | Human | Esophagus | ESCC | 9.44e-07 | 1.46e-01 | 0.1177 |
| 51308 | REEP2 | P4T-E | Human | Esophagus | ESCC | 2.23e-06 | 1.79e-01 | 0.1323 |
| 51308 | REEP2 | P10T-E | Human | Esophagus | ESCC | 9.44e-07 | 1.69e-01 | 0.116 |
| 51308 | REEP2 | P12T-E | Human | Esophagus | ESCC | 1.75e-25 | 5.19e-01 | 0.1122 |
| 51308 | REEP2 | P16T-E | Human | Esophagus | ESCC | 9.35e-10 | 2.05e-01 | 0.1153 |
| 51308 | REEP2 | P26T-E | Human | Esophagus | ESCC | 1.76e-12 | 2.60e-01 | 0.1276 |
| 51308 | REEP2 | P27T-E | Human | Esophagus | ESCC | 8.84e-05 | 1.42e-01 | 0.1055 |
| 51308 | REEP2 | P32T-E | Human | Esophagus | ESCC | 3.75e-03 | 9.50e-02 | 0.1666 |
| 51308 | REEP2 | P56T-E | Human | Esophagus | ESCC | 1.75e-02 | 3.70e-01 | 0.1613 |
| 51308 | REEP2 | P61T-E | Human | Esophagus | ESCC | 1.01e-07 | 1.96e-01 | 0.099 |
| 51308 | REEP2 | P74T-E | Human | Esophagus | ESCC | 1.24e-46 | 1.19e+00 | 0.1479 |
| 51308 | REEP2 | P130T-E | Human | Esophagus | ESCC | 9.56e-08 | 2.11e-01 | 0.1676 |
| Page: 1 |
| Tissue | Expression Dynamics | Abbreviation |
| Esophagus | 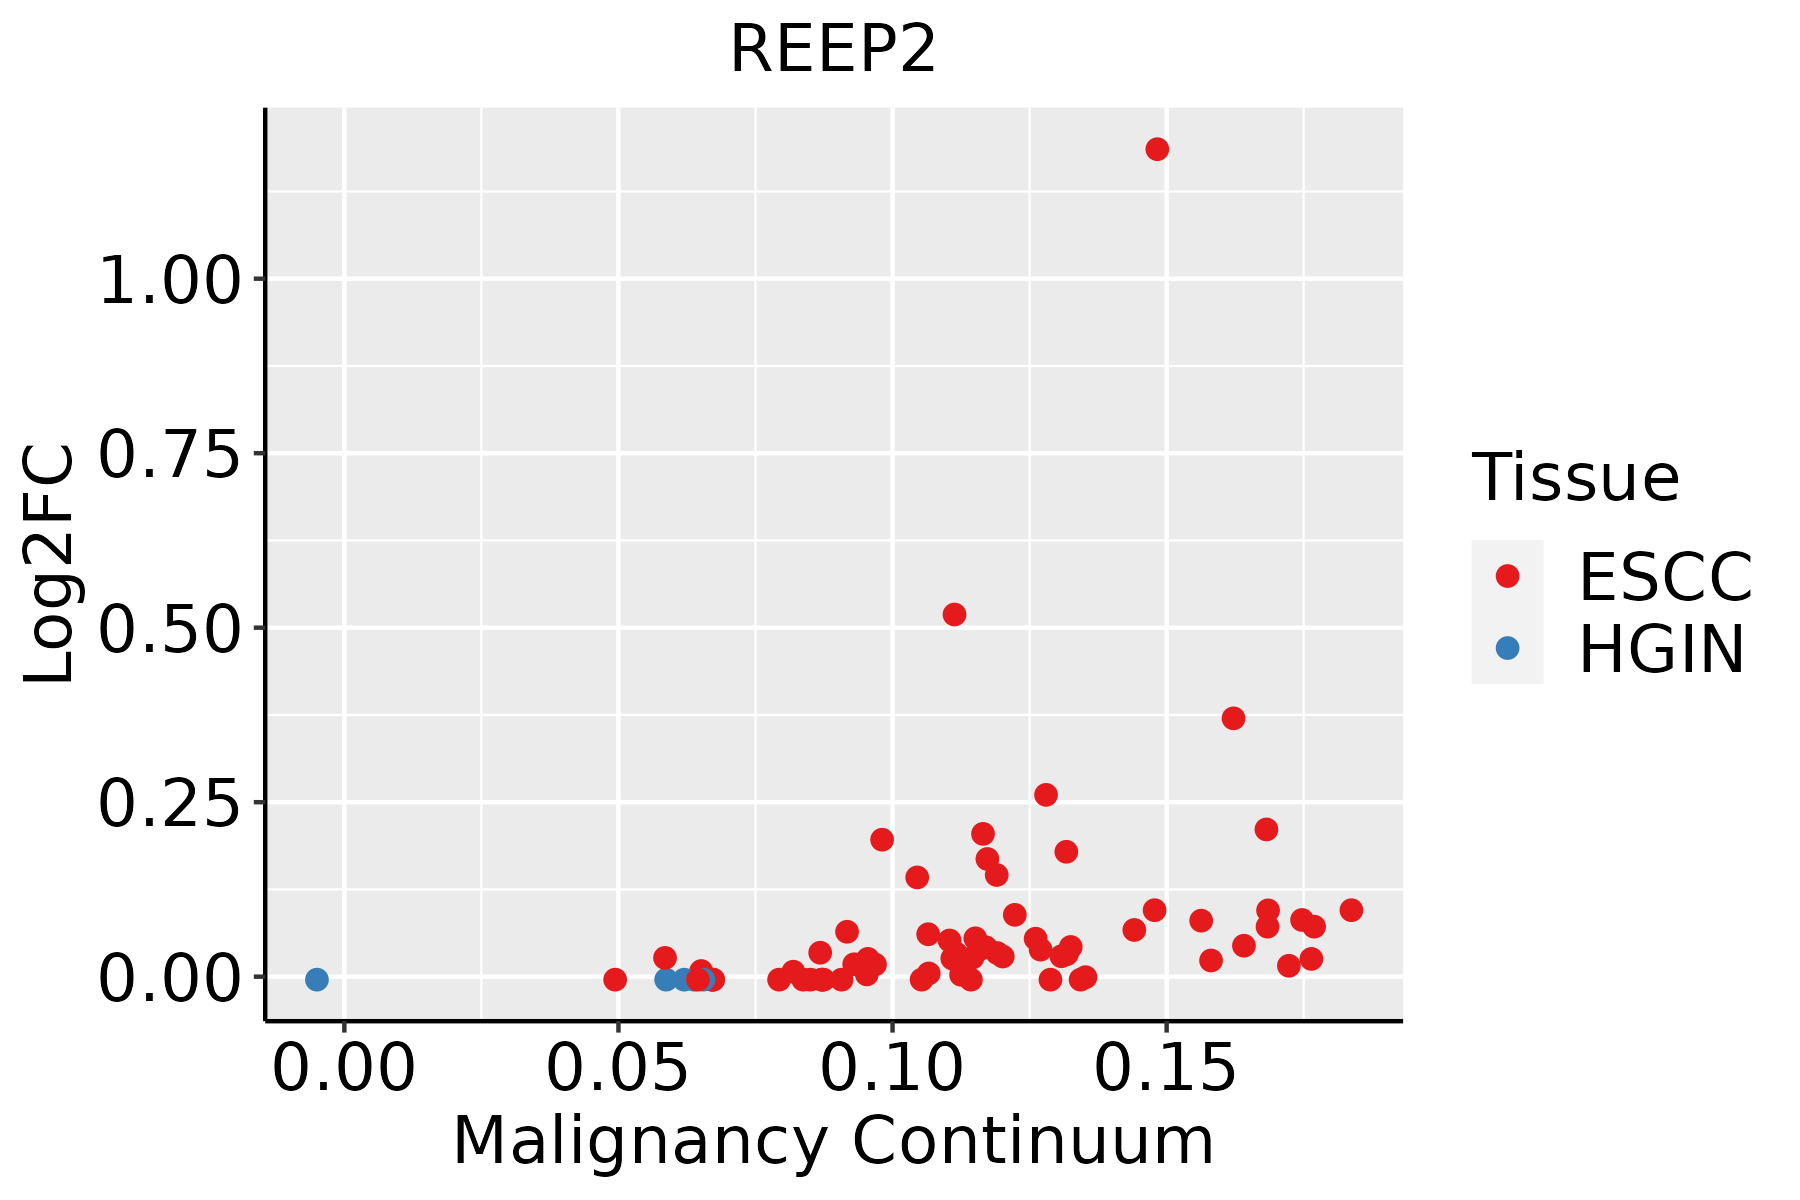 | ESCC: Esophageal squamous cell carcinoma |
| HGIN: High-grade intraepithelial neoplasias | ||
| LGIN: Low-grade intraepithelial neoplasias |
| ∗log2FC in expression of this searched gene in stem-like cells from each diseased tissue sample relative to stem-like cells in normal samples in each tissue plotted against the malignancy continuum. Samples are colored based on if they are from different disease stage. |
Top |
Malignant transformation related pathway analysis |
| Find out the enriched GO biological processes and KEGG pathways involved in transition from healthy to precancer to cancer |
| Tissue | Disease Stage | Enriched GO biological Processes |
| Colorectum | AD |  |
| Colorectum | SER |  |
| Colorectum | MSS |  |
| Colorectum | MSI-H |  |
| Colorectum | FAP |  |
| ∗Top 15 enriched GO BP terms are showed in the bar plot of each disease state in each tissue. Each row represents a significant GO biological process which is colored according to the -log10(p.adjust). |
| Page: 1 2 3 4 5 6 7 8 9 |
| GO ID | Tissue | Disease Stage | Description | Gene Ratio | Bg Ratio | pvalue | p.adjust | Count |
| GO:003238618 | Esophagus | ESCC | regulation of intracellular transport | 243/8552 | 337/18723 | 3.20e-23 | 7.25e-21 | 243 |
| GO:0090150110 | Esophagus | ESCC | establishment of protein localization to membrane | 182/8552 | 260/18723 | 1.27e-15 | 8.19e-14 | 182 |
| GO:000702914 | Esophagus | ESCC | endoplasmic reticulum organization | 65/8552 | 87/18723 | 3.28e-08 | 6.08e-07 | 65 |
| GO:00717865 | Esophagus | ESCC | endoplasmic reticulum tubular network organization | 15/8552 | 18/18723 | 1.20e-03 | 5.88e-03 | 15 |
| Page: 1 |
| Pathway ID | Tissue | Disease Stage | Description | Gene Ratio | Bg Ratio | pvalue | p.adjust | qvalue | Count |
| Page: 1 |
Top |
Cell-cell communication analysis |
| Identification of potential cell-cell interactions between two cell types and their ligand-receptor pairs for different disease states |
| Ligand | Receptor | LRpair | Pathway | Tissue | Disease Stage |
| Page: 1 |
Top |
Single-cell gene regulatory network inference analysis |
| Find out the significant the regulons (TFs) and the target genes of each regulon across cell types for different disease states |
| TF | Cell Type | Tissue | Disease Stage | Target Gene | RSS | Regulon Activity |
| ∗The dot plots of a searched regulon are shown for all cell subpopulations in each disease state of each tissue based on the regulon specific score inferred using pySCENIC and by calculating the average expression. |
| Page: 1 |
Top |
Somatic mutation of malignant transformation related genes |
| Annotation of somatic variants for genes involved in malignant transformation |
| Hugo Symbol | Variant Class | Variant Classification | dbSNP RS | HGVSc | HGVSp | HGVSp Short | SWISSPROT | BIOTYPE | SIFT | PolyPhen | Tumor Sample Barcode | Tissue | Histology | Sex | Age | Stage | Therapy Types | Drugs | Outcome |
| REEP2 | SNV | Missense_Mutation | novel | c.524G>T | p.Arg175Leu | p.R175L | Q9BRK0 | protein_coding | tolerated(0.13) | benign(0.031) | TCGA-5L-AAT0-01 | Breast | breast invasive carcinoma | Female | <65 | I/II | Hormone Therapy | tamoxiphen | SD |
| REEP2 | insertion | Nonsense_Mutation | novel | c.166_167insCCATGACTCTTTGAAATACACAGTTCTGAATGTGTCCTTTC | p.Asp56AlafsTer5 | p.D56Afs*5 | Q9BRK0 | protein_coding | TCGA-A8-A095-01 | Breast | breast invasive carcinoma | Female | <65 | I/II | Chemotherapy | 5-fluorouracil | CR | ||
| REEP2 | SNV | Missense_Mutation | c.339N>C | p.Lys113Asn | p.K113N | Q9BRK0 | protein_coding | deleterious(0) | possibly_damaging(0.449) | TCGA-IR-A3LH-01 | Cervix | cervical & endocervical cancer | Female | <65 | I/II | Chemotherapy | cisplatin | CR | |
| REEP2 | SNV | Missense_Mutation | rs756864410 | c.478C>T | p.Arg160Trp | p.R160W | Q9BRK0 | protein_coding | deleterious(0) | possibly_damaging(0.676) | TCGA-A6-5661-01 | Colorectum | colon adenocarcinoma | Female | >=65 | I/II | Unknown | Unknown | SD |
| REEP2 | SNV | Missense_Mutation | rs771711751 | c.313N>A | p.Glu105Lys | p.E105K | Q9BRK0 | protein_coding | deleterious(0.02) | benign(0.372) | TCGA-AA-3984-01 | Colorectum | colon adenocarcinoma | Female | <65 | I/II | Unknown | Unknown | SD |
| REEP2 | SNV | Missense_Mutation | rs755450430 | c.265C>T | p.Arg89Cys | p.R89C | Q9BRK0 | protein_coding | deleterious(0) | probably_damaging(0.999) | TCGA-AA-A022-01 | Colorectum | colon adenocarcinoma | Female | >=65 | I/II | Unknown | Unknown | SD |
| REEP2 | SNV | Missense_Mutation | c.530N>A | p.Ser177Asn | p.S177N | Q9BRK0 | protein_coding | tolerated(0.36) | benign(0.017) | TCGA-AZ-4615-01 | Colorectum | colon adenocarcinoma | Male | >=65 | III/IV | Chemotherapy | xeloda | PD | |
| REEP2 | SNV | Missense_Mutation | c.295A>G | p.Lys99Glu | p.K99E | Q9BRK0 | protein_coding | deleterious(0) | possibly_damaging(0.459) | TCGA-AG-4008-01 | Colorectum | rectum adenocarcinoma | Male | <65 | I/II | Chemotherapy | 5-fluorouracil | CR | |
| REEP2 | SNV | Missense_Mutation | novel | c.71A>G | p.Tyr24Cys | p.Y24C | Q9BRK0 | protein_coding | deleterious(0) | probably_damaging(0.916) | TCGA-AG-A002-01 | Colorectum | rectum adenocarcinoma | Male | <65 | I/II | Unknown | Unknown | SD |
| REEP2 | SNV | Missense_Mutation | novel | c.376N>A | p.Leu126Met | p.L126M | Q9BRK0 | protein_coding | deleterious(0) | possibly_damaging(0.77) | TCGA-A5-A0G1-01 | Endometrium | uterine corpus endometrioid carcinoma | Female | >=65 | I/II | Unknown | Unknown | SD |
| Page: 1 2 3 |
Top |
Related drugs of malignant transformation related genes |
| Identification of chemicals and drugs interact with genes involved in malignant transfromation |
| (DGIdb 4.0) |
| Entrez ID | Symbol | Category | Interaction Types | Drug Claim Name | Drug Name | PMIDs |
| Page: 1 |

Copyright 2023-Present -The University of Texas Health Science Center at Houston |