| Tissue | Expression Dynamics | Abbreviation |
| Esophagus |  | ESCC: Esophageal squamous cell carcinoma |
| HGIN: High-grade intraepithelial neoplasias |
| LGIN: Low-grade intraepithelial neoplasias |
| Liver | 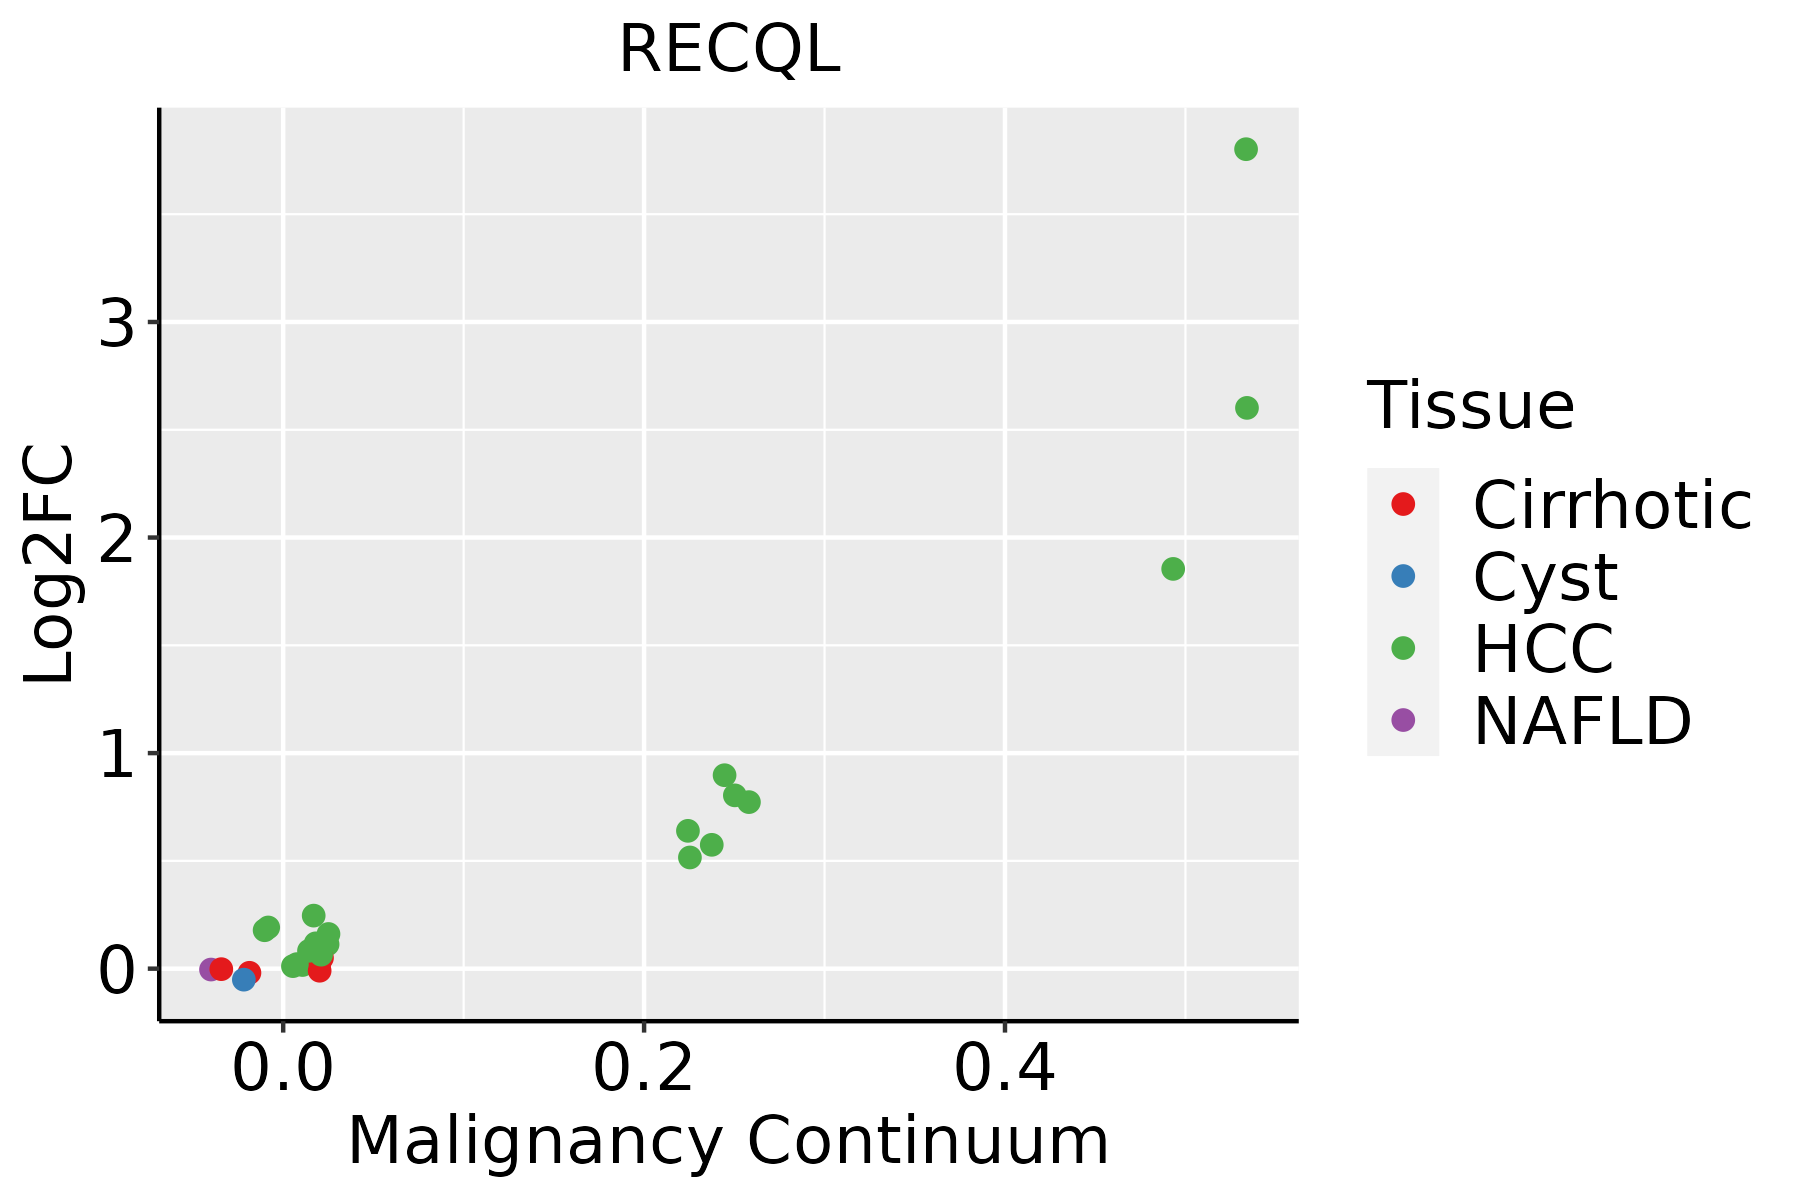 | HCC: Hepatocellular carcinoma |
| NAFLD: Non-alcoholic fatty liver disease |
| Oral Cavity |  | EOLP: Erosive Oral lichen planus |
| LP: leukoplakia |
| NEOLP: Non-erosive oral lichen planus |
| OSCC: Oral squamous cell carcinoma |
| Skin |  | AK: Actinic keratosis |
| cSCC: Cutaneous squamous cell carcinoma |
| SCCIS:squamous cell carcinoma in situ |
| Thyroid | 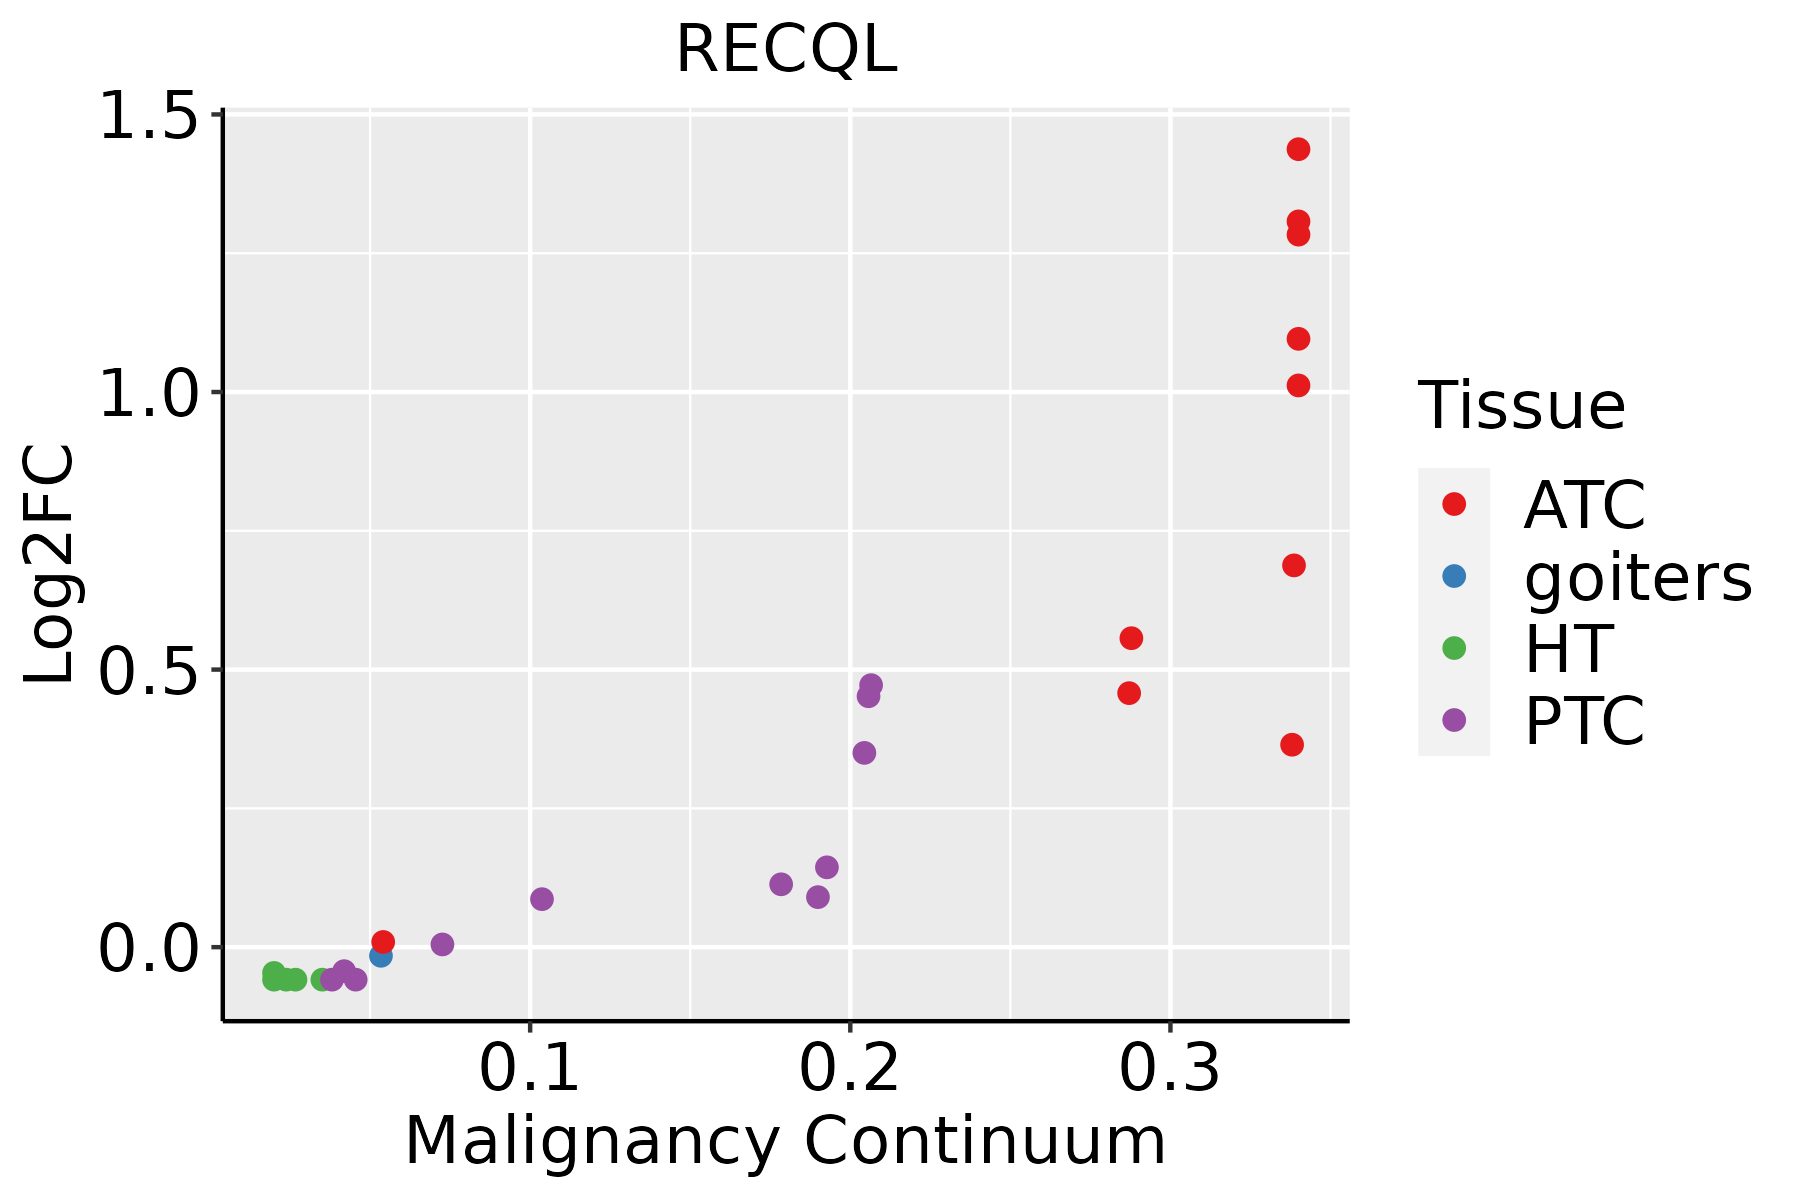 | ATC: Anaplastic thyroid cancer |
| HT: Hashimoto's thyroiditis |
| PTC: Papillary thyroid cancer |
| GO ID | Tissue | Disease Stage | Description | Gene Ratio | Bg Ratio | pvalue | p.adjust | Count |
| GO:000705911 | Esophagus | ESCC | chromosome segregation | 238/8552 | 346/18723 | 1.72e-18 | 1.82e-16 | 238 |
| GO:00062604 | Esophagus | ESCC | DNA replication | 181/8552 | 260/18723 | 3.55e-15 | 2.05e-13 | 181 |
| GO:000635414 | Esophagus | ESCC | DNA-templated transcription, elongation | 76/8552 | 91/18723 | 8.35e-14 | 4.11e-12 | 76 |
| GO:005105215 | Esophagus | ESCC | regulation of DNA metabolic process | 232/8552 | 359/18723 | 2.40e-13 | 1.13e-11 | 232 |
| GO:000072319 | Esophagus | ESCC | telomere maintenance | 99/8552 | 131/18723 | 2.68e-12 | 1.08e-10 | 99 |
| GO:2001020110 | Esophagus | ESCC | regulation of response to DNA damage stimulus | 145/8552 | 219/18723 | 5.97e-10 | 1.50e-08 | 145 |
| GO:000636814 | Esophagus | ESCC | transcription elongation from RNA polymerase II promoter | 56/8552 | 69/18723 | 1.40e-09 | 3.30e-08 | 56 |
| GO:003278412 | Esophagus | ESCC | regulation of DNA-templated transcription, elongation | 45/8552 | 53/18723 | 3.64e-09 | 7.61e-08 | 45 |
| GO:00062612 | Esophagus | ESCC | DNA-dependent DNA replication | 100/8552 | 151/18723 | 2.61e-07 | 3.94e-06 | 100 |
| GO:003424312 | Esophagus | ESCC | regulation of transcription elongation from RNA polymerase II promoter | 28/8552 | 32/18723 | 1.02e-06 | 1.29e-05 | 28 |
| GO:00063024 | Esophagus | ESCC | double-strand break repair | 152/8552 | 251/18723 | 1.33e-06 | 1.62e-05 | 152 |
| GO:003239214 | Esophagus | ESCC | DNA geometric change | 62/8552 | 90/18723 | 7.02e-06 | 7.04e-05 | 62 |
| GO:003250813 | Esophagus | ESCC | DNA duplex unwinding | 58/8552 | 84/18723 | 1.23e-05 | 1.14e-04 | 58 |
| GO:003220014 | Esophagus | ESCC | telomere organization | 99/8552 | 159/18723 | 1.77e-05 | 1.57e-04 | 99 |
| GO:00513042 | Esophagus | ESCC | chromosome separation | 64/8552 | 96/18723 | 2.61e-05 | 2.20e-04 | 64 |
| GO:000941020 | Esophagus | ESCC | response to xenobiotic stimulus | 253/8552 | 462/18723 | 4.55e-05 | 3.58e-04 | 253 |
| GO:00062826 | Esophagus | ESCC | regulation of DNA repair | 82/8552 | 130/18723 | 4.65e-05 | 3.66e-04 | 82 |
| GO:200102112 | Esophagus | ESCC | negative regulation of response to DNA damage stimulus | 54/8552 | 81/18723 | 1.09e-04 | 7.64e-04 | 54 |
| GO:00063101 | Esophagus | ESCC | DNA recombination | 168/8552 | 305/18723 | 5.58e-04 | 3.05e-03 | 168 |
| GO:003424411 | Esophagus | ESCC | negative regulation of transcription elongation from RNA polymerase II promoter | 14/8552 | 16/18723 | 6.78e-04 | 3.56e-03 | 14 |
| Hugo Symbol | Variant Class | Variant Classification | dbSNP RS | HGVSc | HGVSp | HGVSp Short | SWISSPROT | BIOTYPE | SIFT | PolyPhen | Tumor Sample Barcode | Tissue | Histology | Sex | Age | Stage | Therapy Types | Drugs | Outcome |
| RECQL | SNV | Missense_Mutation | novel | c.1494N>T | p.Lys498Asn | p.K498N | P46063 | protein_coding | tolerated(0.1) | benign(0.242) | TCGA-AN-A046-01 | Breast | breast invasive carcinoma | Female | >=65 | I/II | Unknown | Unknown | SD |
| RECQL | SNV | Missense_Mutation | novel | c.32N>C | p.Leu11Pro | p.L11P | P46063 | protein_coding | deleterious(0) | probably_damaging(0.996) | TCGA-AR-A0U2-01 | Breast | breast invasive carcinoma | Female | <65 | III/IV | Hormone Therapy | tamoxiphen | PD |
| RECQL | SNV | Missense_Mutation | novel | c.715G>C | p.Gly239Arg | p.G239R | P46063 | protein_coding | deleterious(0) | probably_damaging(0.957) | TCGA-AR-A250-01 | Breast | breast invasive carcinoma | Female | <65 | I/II | Chemotherapy | doxorubicin | SD |
| RECQL | SNV | Missense_Mutation | | c.1603C>T | p.Pro535Ser | p.P535S | P46063 | protein_coding | deleterious(0.01) | benign(0.442) | TCGA-BH-A18V-01 | Breast | breast invasive carcinoma | Female | <65 | I/II | Unknown | Unknown | SD |
| RECQL | SNV | Missense_Mutation | | c.857N>A | p.Leu286Gln | p.L286Q | P46063 | protein_coding | deleterious(0) | probably_damaging(0.999) | TCGA-E9-A1NF-01 | Breast | breast invasive carcinoma | Female | <65 | I/II | Chemotherapy | doxorubicin | PD |
| RECQL | insertion | Nonsense_Mutation | novel | c.84_85insCACTGAAATGGGGTAC | p.Thr29HisfsTer2 | p.T29Hfs*2 | P46063 | protein_coding | | | TCGA-A2-A0CP-01 | Breast | breast invasive carcinoma | Female | <65 | I/II | Chemotherapy | cytoxan | SD |
| RECQL | insertion | Nonsense_Mutation | novel | c.624_625insTAATA | p.Glu209Ter | p.E209* | P46063 | protein_coding | | | TCGA-A7-A26I-01 | Breast | breast invasive carcinoma | Female | >=65 | I/II | Chemotherapy | cytoxan | SD |
| RECQL | insertion | Nonsense_Mutation | novel | c.713_714insGGTCTCTTAATAATTGGGTTATCAGT | p.Gly239ValfsTer3 | p.G239Vfs*3 | P46063 | protein_coding | | | TCGA-AN-A0FX-01 | Breast | breast invasive carcinoma | Female | <65 | I/II | Unknown | Unknown | SD |
| RECQL | insertion | Frame_Shift_Ins | novel | c.812_813insATTAAATCTATTC | p.Glu272LeufsTer5 | p.E272Lfs*5 | P46063 | protein_coding | | | TCGA-AR-A0U0-01 | Breast | breast invasive carcinoma | Female | >=65 | I/II | Unknown | Unknown | SD |
| RECQL | SNV | Missense_Mutation | | c.241G>T | p.Asp81Tyr | p.D81Y | P46063 | protein_coding | deleterious(0.02) | benign(0.028) | TCGA-FU-A3HZ-01 | Cervix | cervical & endocervical cancer | Female | <65 | I/II | Chemotherapy | cisplatin | CR |
| Entrez ID | Symbol | Category | Interaction Types | Drug Claim Name | Drug Name | PMIDs |
| 5965 | RECQL | DRUGGABLE GENOME, DNA REPAIR, ENZYME | | PURPURIN | PURPURIN | |
| 5965 | RECQL | DRUGGABLE GENOME, DNA REPAIR, ENZYME | | ELLIPTECINE | ELLIPTECINE | |
| 5965 | RECQL | DRUGGABLE GENOME, DNA REPAIR, ENZYME | | LEVONORDEFRIN | LEVONORDEFRIN | |
| 5965 | RECQL | DRUGGABLE GENOME, DNA REPAIR, ENZYME | | STICTIC ACID | STICTIC ACID | |
| 5965 | RECQL | DRUGGABLE GENOME, DNA REPAIR, ENZYME | | GNF-PF-5159 | CHEMBL1493528 | |
| 5965 | RECQL | DRUGGABLE GENOME, DNA REPAIR, ENZYME | | NSC-228155 | CHEMBL505670 | |
| 5965 | RECQL | DRUGGABLE GENOME, DNA REPAIR, ENZYME | | VERAPAMIL HYDROCHLORIDE | VERAPAMIL HYDROCHLORIDE | |
| 5965 | RECQL | DRUGGABLE GENOME, DNA REPAIR, ENZYME | | MMV009085 | CHEMBL581225 | |
| 5965 | RECQL | DRUGGABLE GENOME, DNA REPAIR, ENZYME | | N-PHENETHYLCINNAMAMIDE | CHEMBL1305393 | |
| 5965 | RECQL | DRUGGABLE GENOME, DNA REPAIR, ENZYME | | ROSE BENGAL | ROSE BENGAL | |


