
|
|||||
|
 | |
| |
| |
| |
| |
| |
|
Gene: REC8 |
Gene summary for REC8 |
| Gene information | Species | Human | Gene symbol | REC8 | Gene ID | 9985 |
| Gene name | REC8 meiotic recombination protein | |
| Gene Alias | HR21spB | |
| Cytomap | 14q12 | |
| Gene Type | protein-coding | GO ID | GO:0000003 | UniProtAcc | O95072 |
Top |
Malignant transformation analysis |
| Identification of the aberrant gene expression in precancerous and cancerous lesions by comparing the gene expression of stem-like cells in diseased tissues with normal stem cells |
| Entrez ID | Symbol | Replicates | Species | Organ | Tissue | Adj P-value | Log2FC | Malignancy |
| 9985 | REC8 | P2T-E | Human | Esophagus | ESCC | 1.88e-04 | 9.14e-02 | 0.1177 |
| 9985 | REC8 | P8T-E | Human | Esophagus | ESCC | 1.05e-08 | 1.69e-01 | 0.0889 |
| 9985 | REC8 | P9T-E | Human | Esophagus | ESCC | 1.79e-06 | 1.52e-01 | 0.1131 |
| 9985 | REC8 | P11T-E | Human | Esophagus | ESCC | 2.51e-05 | 2.98e-01 | 0.1426 |
| 9985 | REC8 | P12T-E | Human | Esophagus | ESCC | 4.10e-02 | 8.24e-02 | 0.1122 |
| 9985 | REC8 | P15T-E | Human | Esophagus | ESCC | 2.74e-12 | 2.56e-01 | 0.1149 |
| 9985 | REC8 | P21T-E | Human | Esophagus | ESCC | 4.93e-02 | 8.76e-02 | 0.1617 |
| 9985 | REC8 | P27T-E | Human | Esophagus | ESCC | 5.28e-09 | 9.29e-02 | 0.1055 |
| 9985 | REC8 | P28T-E | Human | Esophagus | ESCC | 3.50e-06 | 1.51e-01 | 0.1149 |
| 9985 | REC8 | P31T-E | Human | Esophagus | ESCC | 9.66e-04 | 1.16e-01 | 0.1251 |
| 9985 | REC8 | P37T-E | Human | Esophagus | ESCC | 4.57e-04 | 5.31e-02 | 0.1371 |
| 9985 | REC8 | P48T-E | Human | Esophagus | ESCC | 1.17e-02 | 1.14e-01 | 0.0959 |
| 9985 | REC8 | P61T-E | Human | Esophagus | ESCC | 5.22e-10 | 2.88e-01 | 0.099 |
| 9985 | REC8 | P62T-E | Human | Esophagus | ESCC | 4.52e-05 | 1.00e-01 | 0.1302 |
| 9985 | REC8 | P74T-E | Human | Esophagus | ESCC | 4.38e-02 | 1.06e-01 | 0.1479 |
| 9985 | REC8 | P75T-E | Human | Esophagus | ESCC | 6.31e-09 | 1.96e-01 | 0.1125 |
| 9985 | REC8 | P91T-E | Human | Esophagus | ESCC | 1.72e-07 | 6.93e-01 | 0.1828 |
| 9985 | REC8 | P104T-E | Human | Esophagus | ESCC | 9.09e-06 | 5.24e-01 | 0.0931 |
| 9985 | REC8 | P107T-E | Human | Esophagus | ESCC | 2.26e-02 | 1.16e-01 | 0.171 |
| 9985 | REC8 | C21 | Human | Oral cavity | OSCC | 2.78e-02 | 1.20e-01 | 0.2678 |
| Page: 1 2 |
| Tissue | Expression Dynamics | Abbreviation |
| Esophagus | 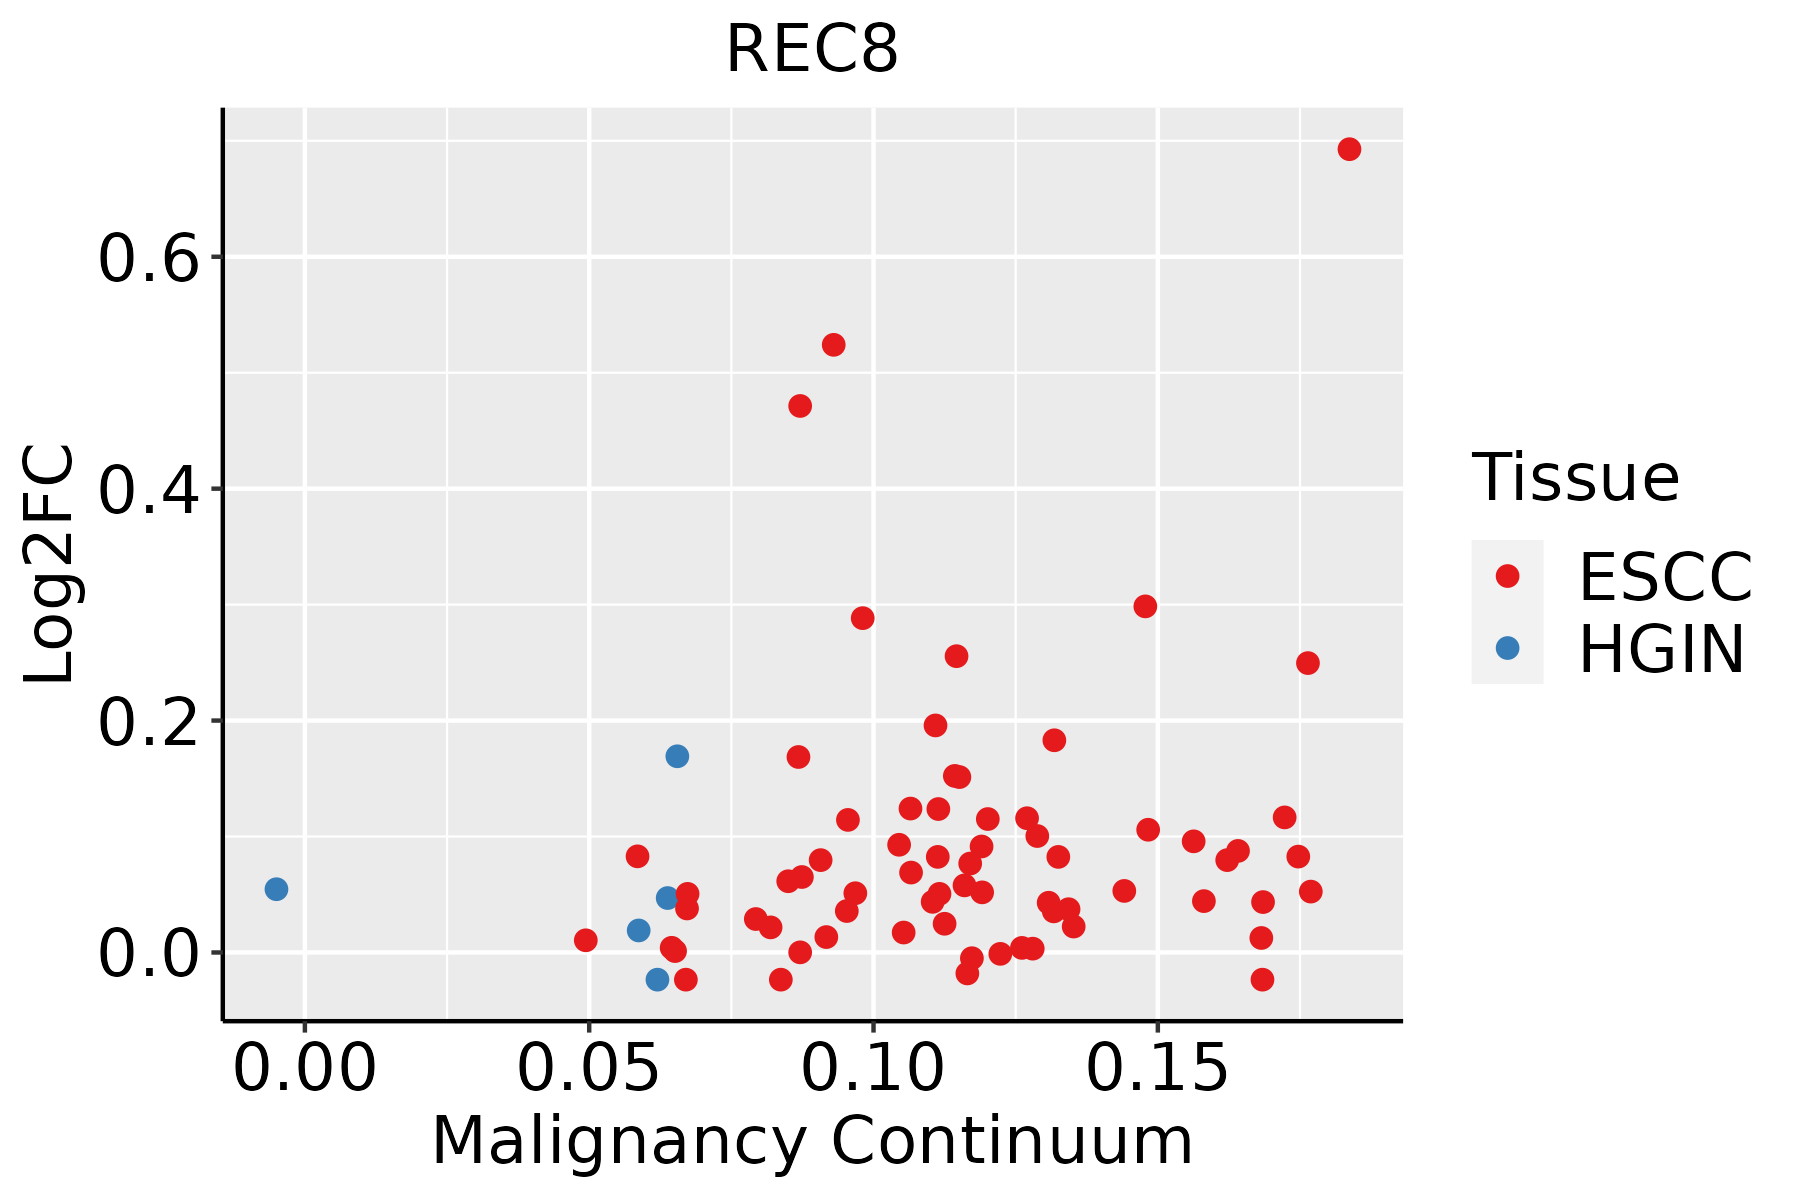 | ESCC: Esophageal squamous cell carcinoma |
| HGIN: High-grade intraepithelial neoplasias | ||
| LGIN: Low-grade intraepithelial neoplasias | ||
| Oral Cavity | 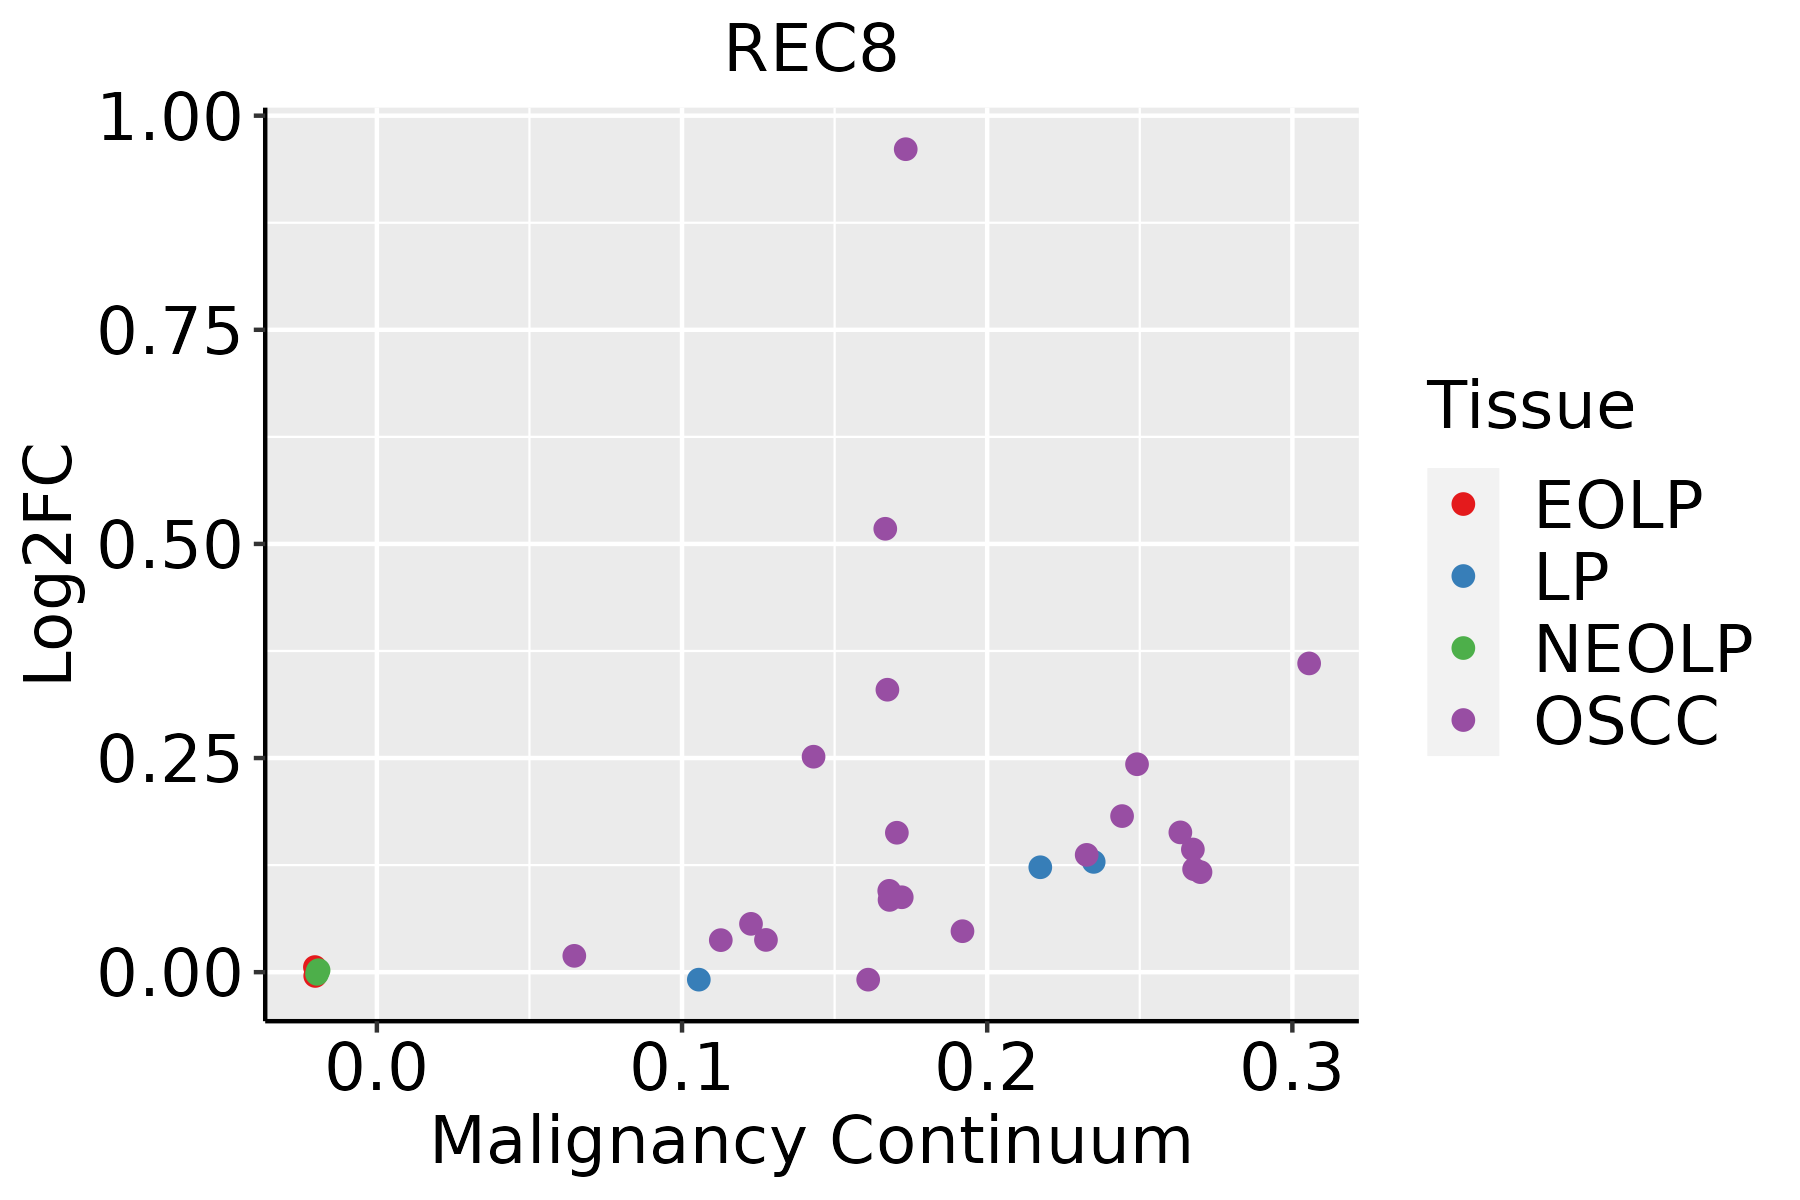 | EOLP: Erosive Oral lichen planus |
| LP: leukoplakia | ||
| NEOLP: Non-erosive oral lichen planus | ||
| OSCC: Oral squamous cell carcinoma |
| ∗log2FC in expression of this searched gene in stem-like cells from each diseased tissue sample relative to stem-like cells in normal samples in each tissue plotted against the malignancy continuum. Samples are colored based on if they are from different disease stage. |
Top |
Malignant transformation related pathway analysis |
| Find out the enriched GO biological processes and KEGG pathways involved in transition from healthy to precancer to cancer |
| Tissue | Disease Stage | Enriched GO biological Processes |
| Colorectum | AD |  |
| Colorectum | SER |  |
| Colorectum | MSS |  |
| Colorectum | MSI-H |  |
| Colorectum | FAP |  |
| ∗Top 15 enriched GO BP terms are showed in the bar plot of each disease state in each tissue. Each row represents a significant GO biological process which is colored according to the -log10(p.adjust). |
| Page: 1 2 3 4 5 6 7 8 9 |
| GO ID | Tissue | Disease Stage | Description | Gene Ratio | Bg Ratio | pvalue | p.adjust | Count |
| GO:014001414 | Esophagus | ESCC | mitotic nuclear division | 218/8552 | 287/18723 | 6.17e-26 | 1.78e-23 | 218 |
| GO:000007011 | Esophagus | ESCC | mitotic sister chromatid segregation | 138/8552 | 168/18723 | 1.37e-22 | 2.63e-20 | 138 |
| GO:00008194 | Esophagus | ESCC | sister chromatid segregation | 157/8552 | 202/18723 | 8.41e-21 | 1.33e-18 | 157 |
| GO:000705911 | Esophagus | ESCC | chromosome segregation | 238/8552 | 346/18723 | 1.72e-18 | 1.82e-16 | 238 |
| GO:00482853 | Esophagus | ESCC | organelle fission | 301/8552 | 488/18723 | 4.64e-13 | 2.12e-11 | 301 |
| GO:00988133 | Esophagus | ESCC | nuclear chromosome segregation | 187/8552 | 281/18723 | 1.00e-12 | 4.36e-11 | 187 |
| GO:00002802 | Esophagus | ESCC | nuclear division | 270/8552 | 439/18723 | 1.17e-11 | 4.24e-10 | 270 |
| GO:0061458110 | Esophagus | ESCC | reproductive system development | 247/8552 | 427/18723 | 2.24e-07 | 3.42e-06 | 247 |
| GO:004860818 | Esophagus | ESCC | reproductive structure development | 245/8552 | 424/18723 | 2.82e-07 | 4.14e-06 | 245 |
| GO:00063024 | Esophagus | ESCC | double-strand break repair | 152/8552 | 251/18723 | 1.33e-06 | 1.62e-05 | 152 |
| GO:00070648 | Esophagus | ESCC | mitotic sister chromatid cohesion | 23/8552 | 28/18723 | 8.23e-05 | 6.01e-04 | 23 |
| GO:00063101 | Esophagus | ESCC | DNA recombination | 168/8552 | 305/18723 | 5.58e-04 | 3.05e-03 | 168 |
| GO:00070627 | Esophagus | ESCC | sister chromatid cohesion | 40/8552 | 62/18723 | 2.14e-03 | 9.54e-03 | 40 |
| GO:00007241 | Esophagus | ESCC | double-strand break repair via homologous recombination | 79/8552 | 138/18723 | 4.05e-03 | 1.62e-02 | 79 |
| GO:00007251 | Esophagus | ESCC | recombinational repair | 80/8552 | 140/18723 | 4.10e-03 | 1.63e-02 | 80 |
| GO:01400145 | Oral cavity | OSCC | mitotic nuclear division | 191/7305 | 287/18723 | 1.99e-21 | 3.70e-19 | 191 |
| GO:00000702 | Oral cavity | OSCC | mitotic sister chromatid segregation | 118/7305 | 168/18723 | 1.89e-16 | 1.48e-14 | 118 |
| GO:00008193 | Oral cavity | OSCC | sister chromatid segregation | 135/7305 | 202/18723 | 8.88e-16 | 6.52e-14 | 135 |
| GO:00070592 | Oral cavity | OSCC | chromosome segregation | 206/7305 | 346/18723 | 5.82e-15 | 3.76e-13 | 206 |
| GO:00482852 | Oral cavity | OSCC | organelle fission | 265/7305 | 488/18723 | 3.22e-12 | 1.27e-10 | 265 |
| Page: 1 2 |
| Pathway ID | Tissue | Disease Stage | Description | Gene Ratio | Bg Ratio | pvalue | p.adjust | qvalue | Count |
| hsa041146 | Esophagus | ESCC | Oocyte meiosis | 77/4205 | 131/8465 | 2.19e-02 | 4.80e-02 | 2.46e-02 | 77 |
| hsa0411411 | Esophagus | ESCC | Oocyte meiosis | 77/4205 | 131/8465 | 2.19e-02 | 4.80e-02 | 2.46e-02 | 77 |
| hsa04114 | Oral cavity | OSCC | Oocyte meiosis | 74/3704 | 131/8465 | 2.13e-03 | 5.75e-03 | 2.92e-03 | 74 |
| hsa041141 | Oral cavity | OSCC | Oocyte meiosis | 74/3704 | 131/8465 | 2.13e-03 | 5.75e-03 | 2.92e-03 | 74 |
| Page: 1 |
Top |
Cell-cell communication analysis |
| Identification of potential cell-cell interactions between two cell types and their ligand-receptor pairs for different disease states |
| Ligand | Receptor | LRpair | Pathway | Tissue | Disease Stage |
| Page: 1 |
Top |
Single-cell gene regulatory network inference analysis |
| Find out the significant the regulons (TFs) and the target genes of each regulon across cell types for different disease states |
| TF | Cell Type | Tissue | Disease Stage | Target Gene | RSS | Regulon Activity |
| ∗The dot plots of a searched regulon are shown for all cell subpopulations in each disease state of each tissue based on the regulon specific score inferred using pySCENIC and by calculating the average expression. |
| Page: 1 |
Top |
Somatic mutation of malignant transformation related genes |
| Annotation of somatic variants for genes involved in malignant transformation |
| Hugo Symbol | Variant Class | Variant Classification | dbSNP RS | HGVSc | HGVSp | HGVSp Short | SWISSPROT | BIOTYPE | SIFT | PolyPhen | Tumor Sample Barcode | Tissue | Histology | Sex | Age | Stage | Therapy Types | Drugs | Outcome |
| REC8 | SNV | Missense_Mutation | novel | c.195N>G | p.Phe65Leu | p.F65L | O95072 | protein_coding | deleterious(0) | probably_damaging(0.992) | TCGA-A2-A0YK-01 | Breast | breast invasive carcinoma | Female | <65 | I/II | Chemotherapy | cytoxan | SD |
| REC8 | SNV | Missense_Mutation | rs541776858 | c.1279N>A | p.Glu427Lys | p.E427K | O95072 | protein_coding | deleterious(0.01) | benign(0.358) | TCGA-A2-A3Y0-01 | Breast | breast invasive carcinoma | Female | <65 | I/II | Chemotherapy | adriamycin | CR |
| REC8 | SNV | Missense_Mutation | novel | c.1534N>A | p.Ala512Thr | p.A512T | O95072 | protein_coding | tolerated(0.05) | possibly_damaging(0.61) | TCGA-A7-A26G-01 | Breast | breast invasive carcinoma | Female | <65 | I/II | Chemotherapy | taxotere | SD |
| REC8 | SNV | Missense_Mutation | novel | c.1238N>A | p.Leu413His | p.L413H | O95072 | protein_coding | deleterious(0.02) | probably_damaging(0.927) | TCGA-A8-A079-01 | Breast | breast invasive carcinoma | Female | >=65 | III/IV | Chemotherapy | 5-fluorouracil | SD |
| REC8 | SNV | Missense_Mutation | rs561304496 | c.1315N>T | p.Arg439Trp | p.R439W | O95072 | protein_coding | deleterious(0.01) | benign(0.01) | TCGA-AO-A128-01 | Breast | breast invasive carcinoma | Female | <65 | I/II | Chemotherapy | doxorubicin | SD |
| REC8 | SNV | Missense_Mutation | rs371804350 | c.1384N>A | p.Val462Met | p.V462M | O95072 | protein_coding | tolerated(0.18) | benign(0.014) | TCGA-D8-A1JK-01 | Breast | breast invasive carcinoma | Female | >=65 | I/II | Unknown | Unknown | SD |
| REC8 | SNV | Missense_Mutation | novel | c.1520N>T | p.Pro507Leu | p.P507L | O95072 | protein_coding | deleterious(0) | possibly_damaging(0.76) | TCGA-S3-AA15-01 | Breast | breast invasive carcinoma | Female | <65 | I/II | Chemotherapy | adriamycin | CR |
| REC8 | insertion | Frame_Shift_Ins | novel | c.1102_1103insGCGTG | p.His368ArgfsTer52 | p.H368Rfs*52 | O95072 | protein_coding | TCGA-BH-A0HK-01 | Breast | breast invasive carcinoma | Female | >=65 | I/II | Hormone Therapy | arimidex | SD | ||
| REC8 | insertion | Frame_Shift_Ins | novel | c.1103_1104insGCCACCATACTCGGCT | p.His368GlnfsTer21 | p.H368Qfs*21 | O95072 | protein_coding | TCGA-BH-A0HK-01 | Breast | breast invasive carcinoma | Female | >=65 | I/II | Hormone Therapy | arimidex | SD | ||
| REC8 | SNV | Missense_Mutation | novel | c.1600N>T | p.Pro534Ser | p.P534S | O95072 | protein_coding | deleterious(0.01) | possibly_damaging(0.682) | TCGA-2W-A8YY-01 | Cervix | cervical & endocervical cancer | Female | <65 | I/II | Chemotherapy | cisplatin | CR |
| Page: 1 2 3 4 5 6 |
Top |
Related drugs of malignant transformation related genes |
| Identification of chemicals and drugs interact with genes involved in malignant transfromation |
| (DGIdb 4.0) |
| Entrez ID | Symbol | Category | Interaction Types | Drug Claim Name | Drug Name | PMIDs |
| Page: 1 |

Copyright 2023-Present -The University of Texas Health Science Center at Houston |