
|
|||||
|
 | |
| |
| |
| |
| |
| |
|
Gene: RDH14 |
Gene summary for RDH14 |
| Gene information | Species | Human | Gene symbol | RDH14 | Gene ID | 57665 |
| Gene name | retinol dehydrogenase 14 | |
| Gene Alias | PAN2 | |
| Cytomap | 2p24.2 | |
| Gene Type | protein-coding | GO ID | GO:0001503 | UniProtAcc | Q53RX3 |
Top |
Malignant transformation analysis |
| Identification of the aberrant gene expression in precancerous and cancerous lesions by comparing the gene expression of stem-like cells in diseased tissues with normal stem cells |
| Entrez ID | Symbol | Replicates | Species | Organ | Tissue | Adj P-value | Log2FC | Malignancy |
| 57665 | RDH14 | LZE20T | Human | Esophagus | ESCC | 6.84e-08 | 2.32e-01 | 0.0662 |
| 57665 | RDH14 | LZE22T | Human | Esophagus | ESCC | 2.90e-04 | 4.02e-01 | 0.068 |
| 57665 | RDH14 | LZE24T | Human | Esophagus | ESCC | 5.10e-30 | 8.20e-01 | 0.0596 |
| 57665 | RDH14 | LZE21T | Human | Esophagus | ESCC | 7.58e-06 | 3.27e-01 | 0.0655 |
| 57665 | RDH14 | P1T-E | Human | Esophagus | ESCC | 1.39e-10 | 4.09e-01 | 0.0875 |
| 57665 | RDH14 | P2T-E | Human | Esophagus | ESCC | 5.50e-63 | 1.09e+00 | 0.1177 |
| 57665 | RDH14 | P4T-E | Human | Esophagus | ESCC | 1.08e-36 | 7.12e-01 | 0.1323 |
| 57665 | RDH14 | P5T-E | Human | Esophagus | ESCC | 1.49e-23 | 4.31e-01 | 0.1327 |
| 57665 | RDH14 | P8T-E | Human | Esophagus | ESCC | 6.61e-34 | 5.46e-01 | 0.0889 |
| 57665 | RDH14 | P9T-E | Human | Esophagus | ESCC | 2.51e-17 | 4.08e-01 | 0.1131 |
| 57665 | RDH14 | P10T-E | Human | Esophagus | ESCC | 3.27e-50 | 7.07e-01 | 0.116 |
| 57665 | RDH14 | P11T-E | Human | Esophagus | ESCC | 1.40e-23 | 8.91e-01 | 0.1426 |
| 57665 | RDH14 | P12T-E | Human | Esophagus | ESCC | 1.06e-43 | 8.12e-01 | 0.1122 |
| 57665 | RDH14 | P15T-E | Human | Esophagus | ESCC | 1.53e-22 | 4.87e-01 | 0.1149 |
| 57665 | RDH14 | P16T-E | Human | Esophagus | ESCC | 9.49e-30 | 4.69e-01 | 0.1153 |
| 57665 | RDH14 | P17T-E | Human | Esophagus | ESCC | 1.45e-08 | 3.62e-01 | 0.1278 |
| 57665 | RDH14 | P19T-E | Human | Esophagus | ESCC | 1.61e-04 | 4.52e-01 | 0.1662 |
| 57665 | RDH14 | P20T-E | Human | Esophagus | ESCC | 2.82e-18 | 3.99e-01 | 0.1124 |
| 57665 | RDH14 | P21T-E | Human | Esophagus | ESCC | 1.51e-28 | 4.62e-01 | 0.1617 |
| 57665 | RDH14 | P22T-E | Human | Esophagus | ESCC | 1.04e-53 | 9.17e-01 | 0.1236 |
| Page: 1 2 3 4 5 6 |
| Tissue | Expression Dynamics | Abbreviation |
| Esophagus | 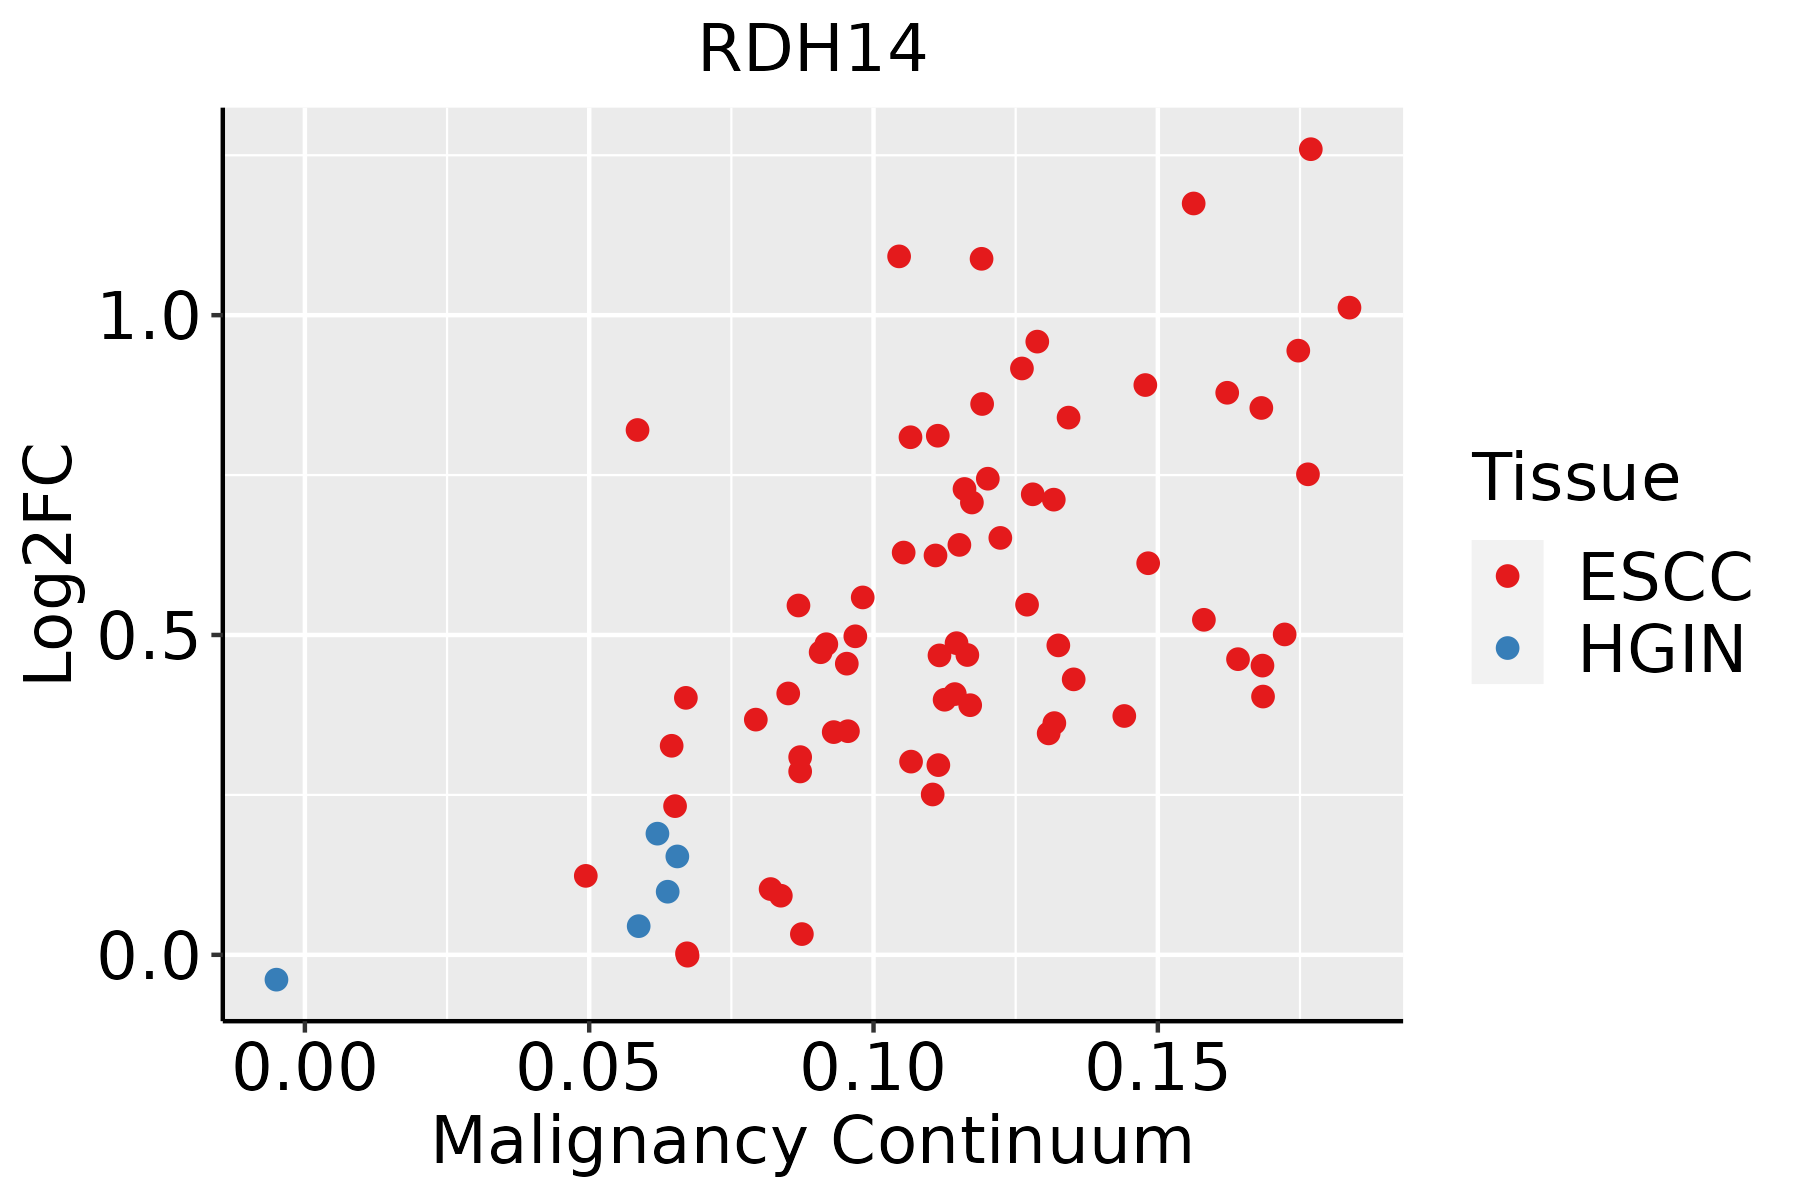 | ESCC: Esophageal squamous cell carcinoma |
| HGIN: High-grade intraepithelial neoplasias | ||
| LGIN: Low-grade intraepithelial neoplasias | ||
| Liver | 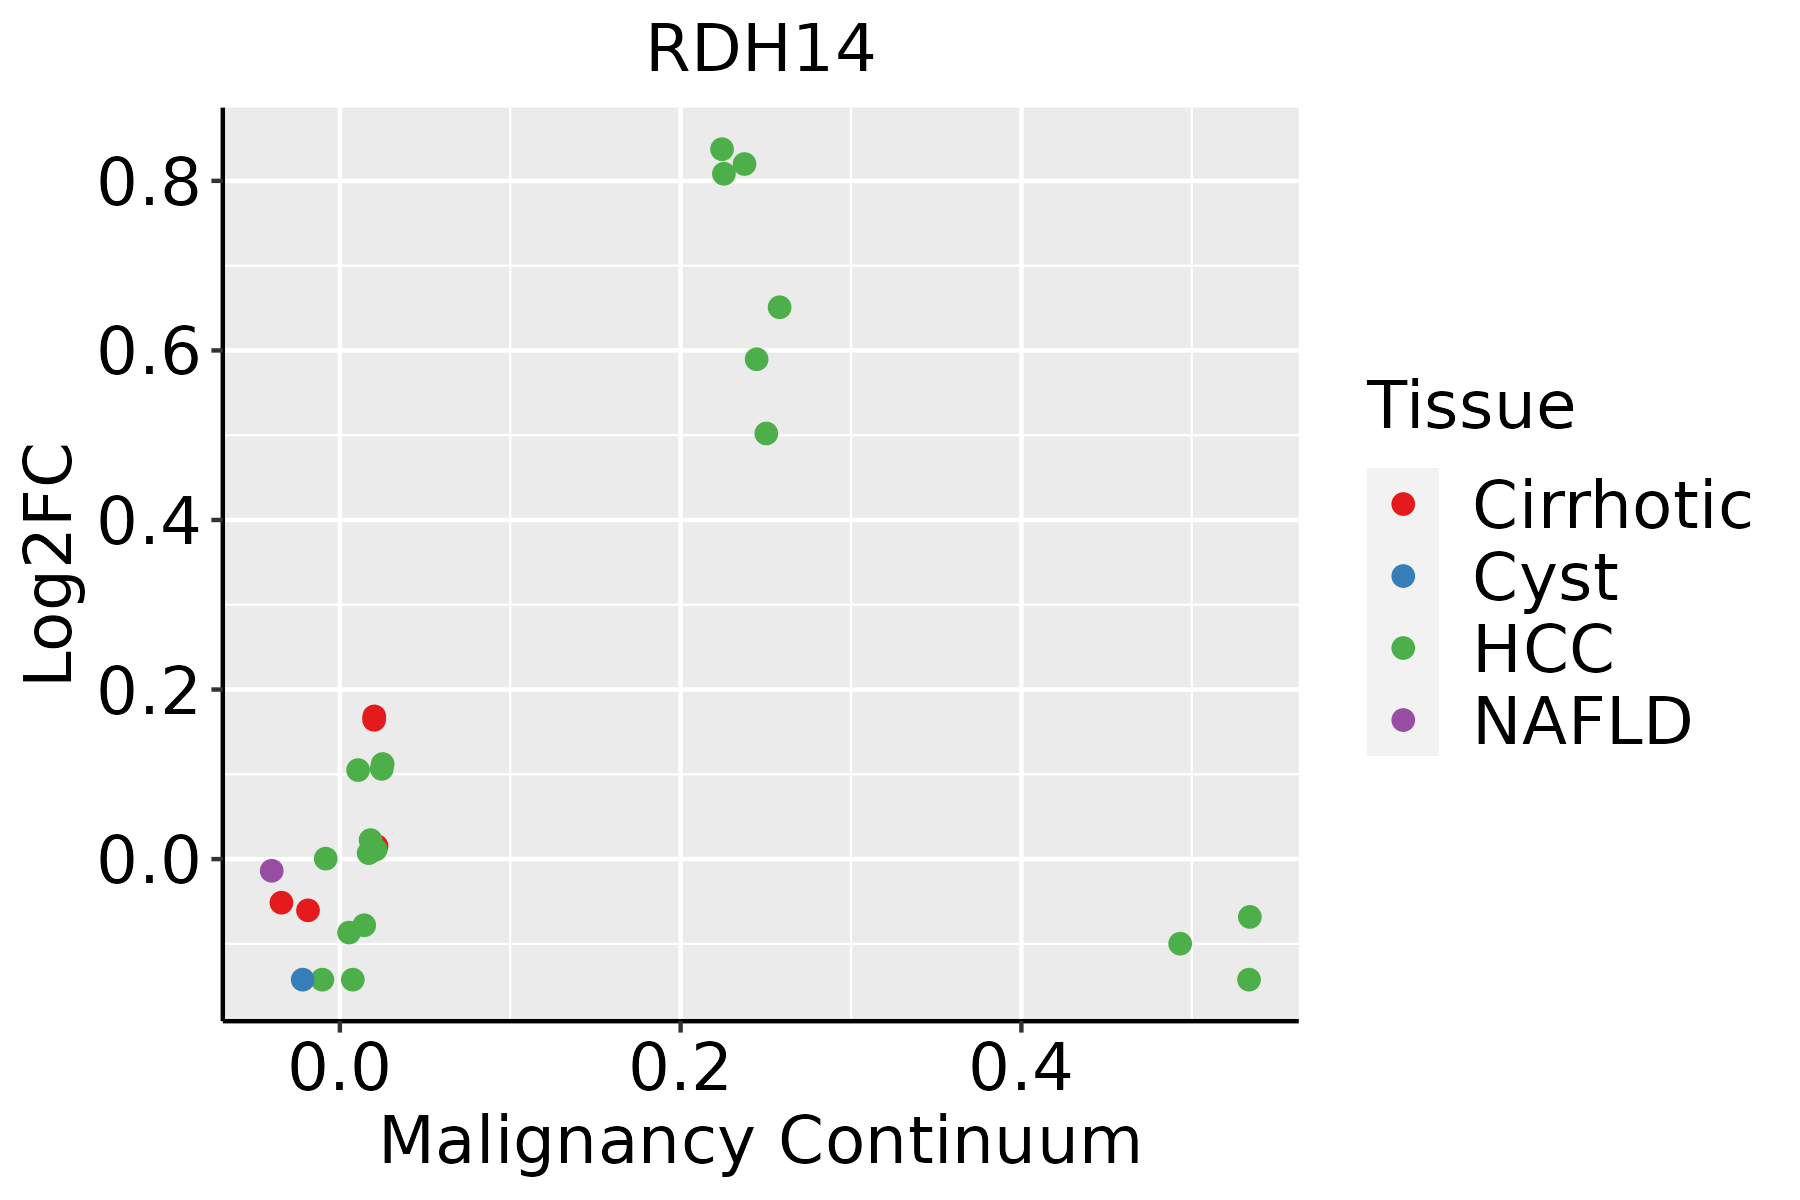 | HCC: Hepatocellular carcinoma |
| NAFLD: Non-alcoholic fatty liver disease | ||
| Oral Cavity | 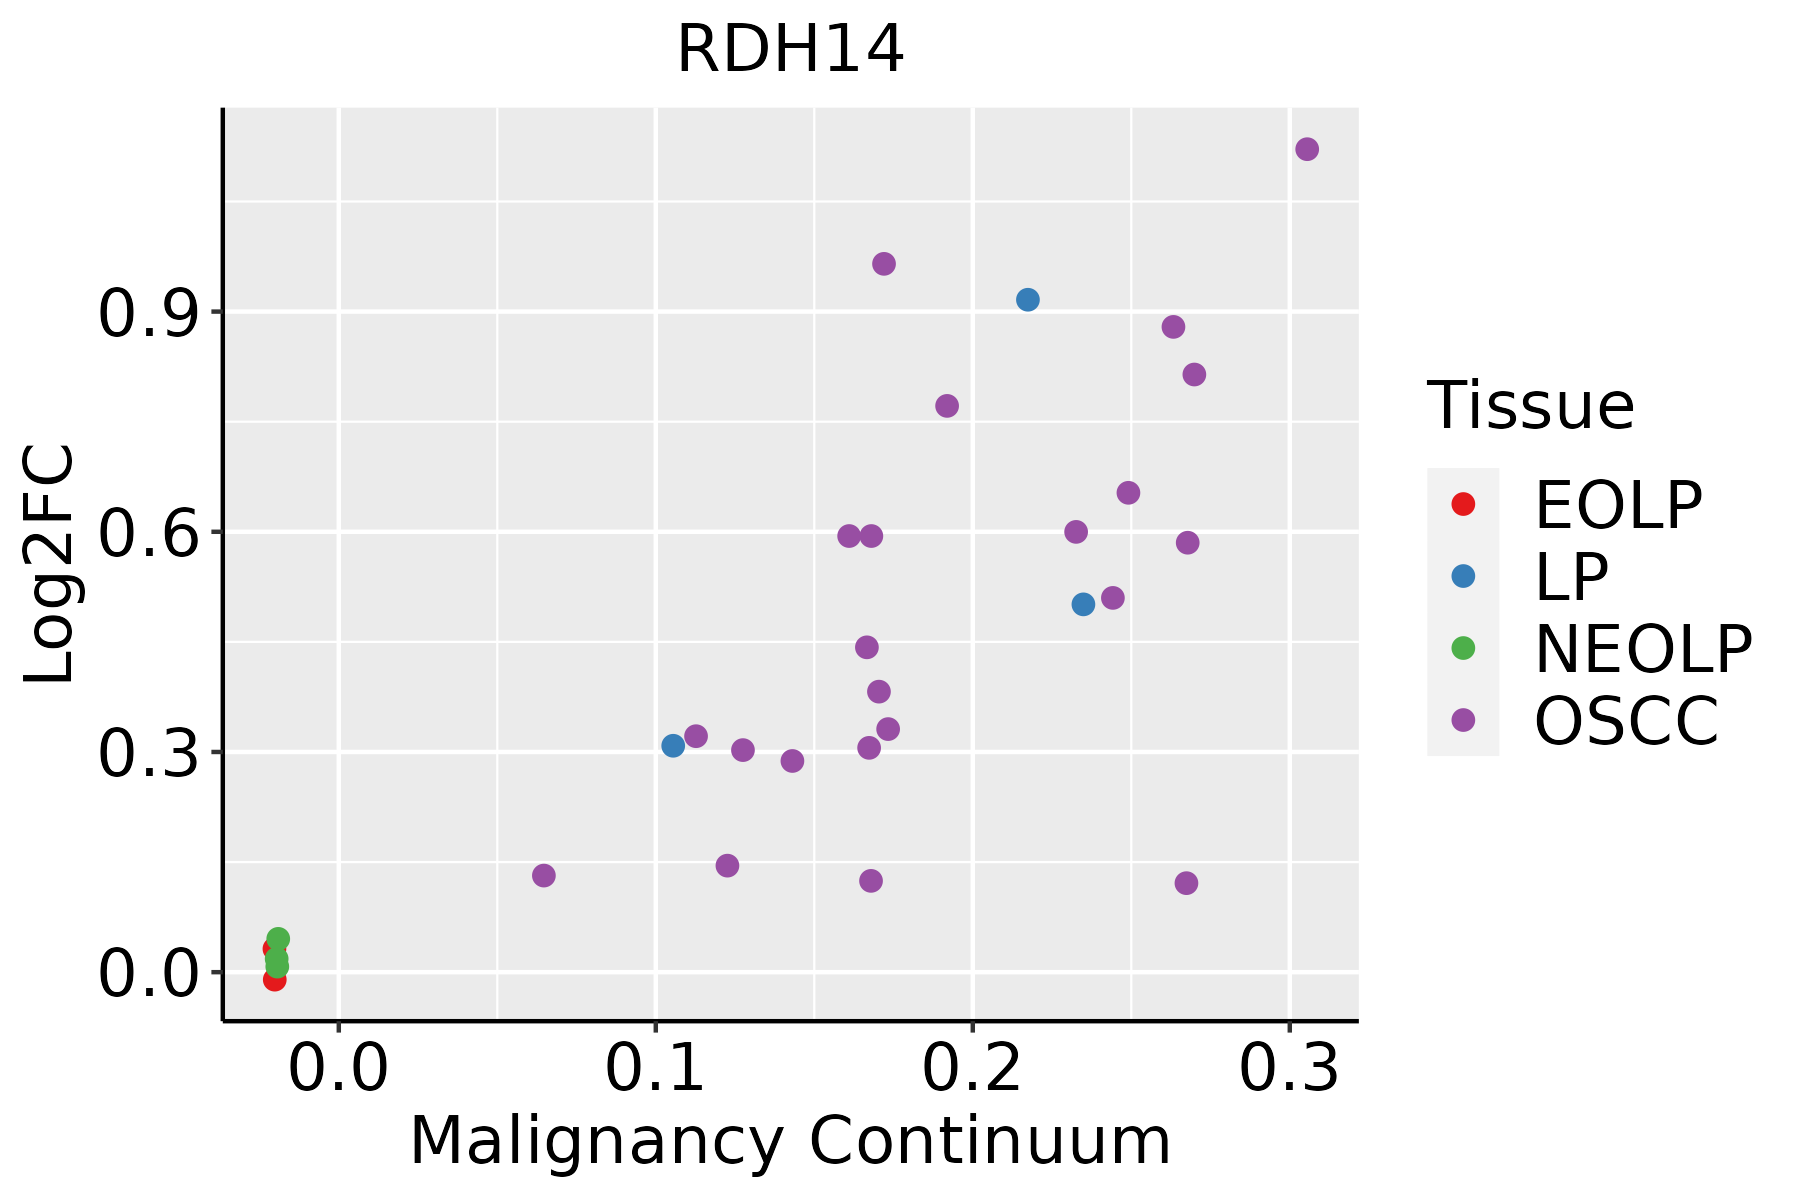 | EOLP: Erosive Oral lichen planus |
| LP: leukoplakia | ||
| NEOLP: Non-erosive oral lichen planus | ||
| OSCC: Oral squamous cell carcinoma | ||
| Skin |  | AK: Actinic keratosis |
| cSCC: Cutaneous squamous cell carcinoma | ||
| SCCIS:squamous cell carcinoma in situ | ||
| Thyroid | 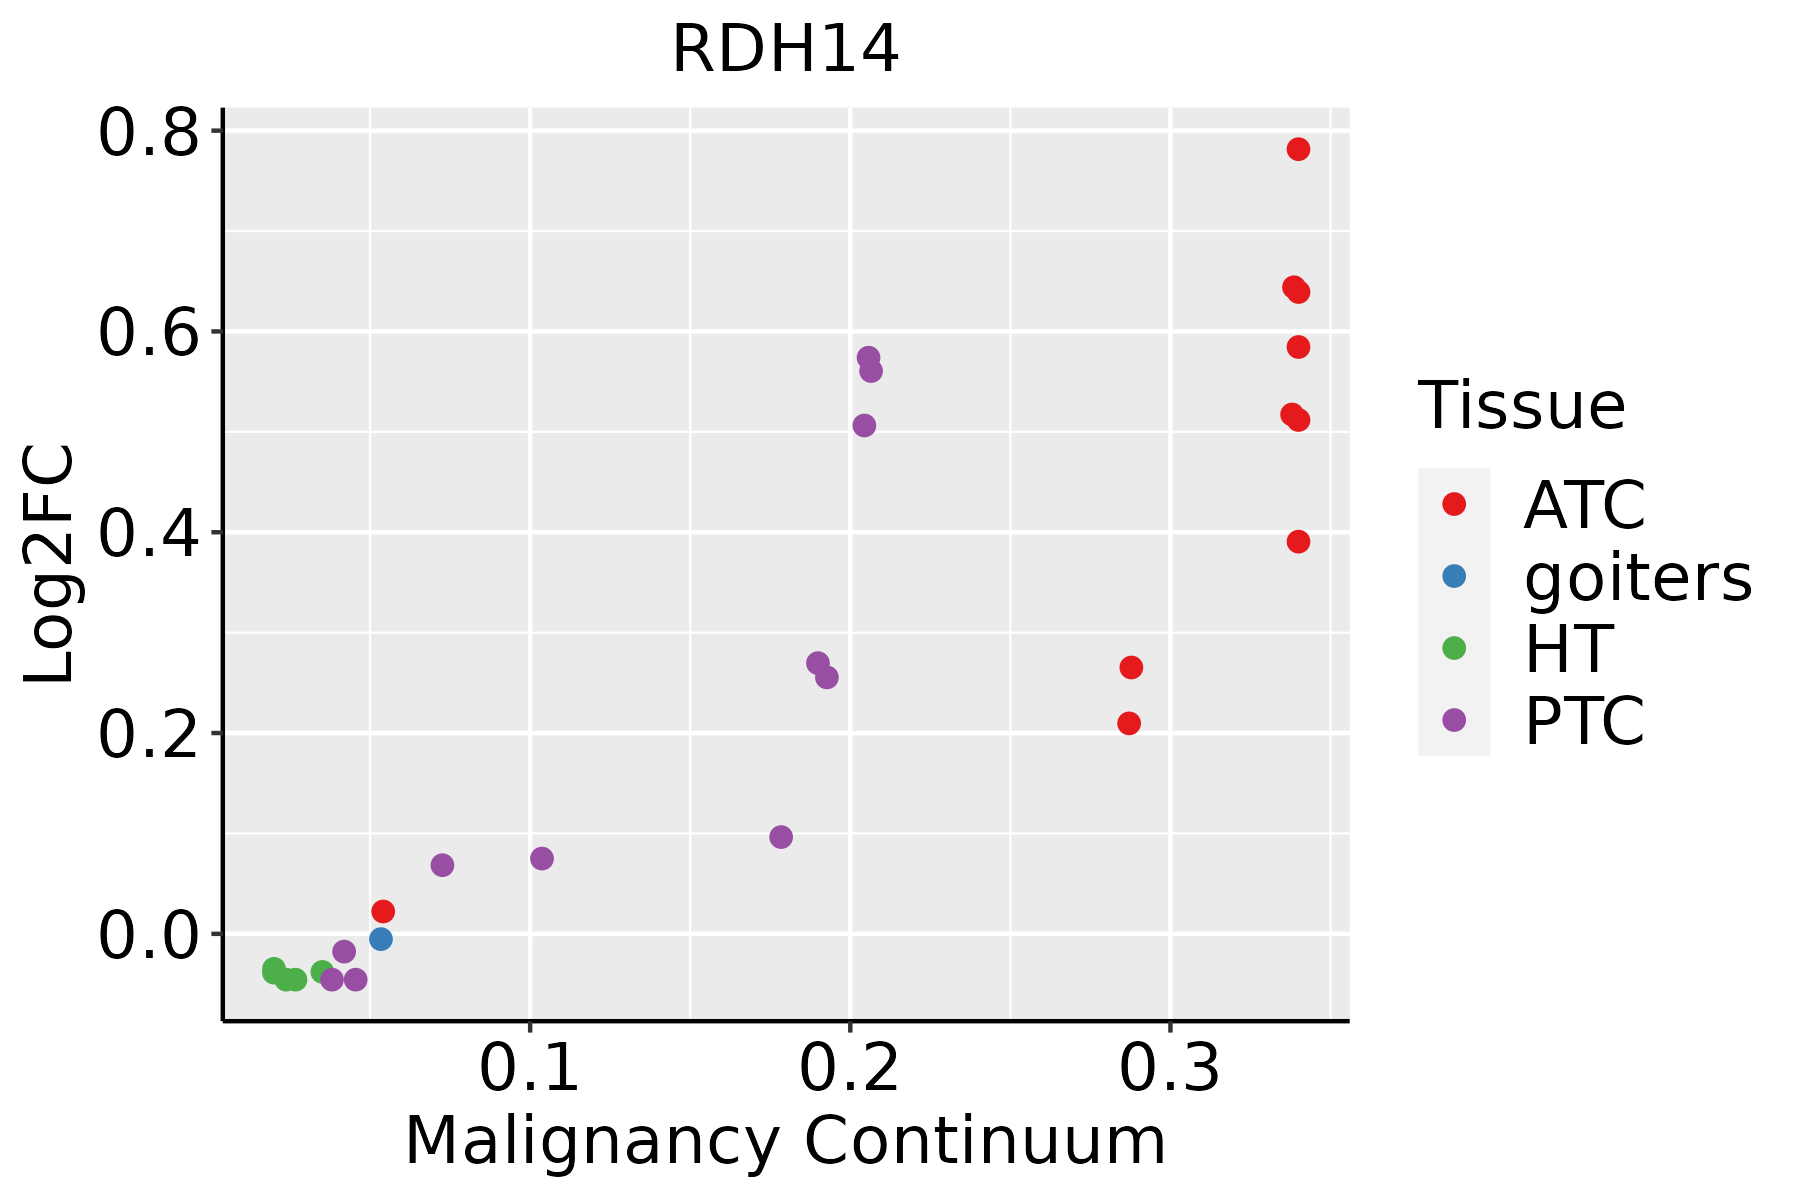 | ATC: Anaplastic thyroid cancer |
| HT: Hashimoto's thyroiditis | ||
| PTC: Papillary thyroid cancer |
| ∗log2FC in expression of this searched gene in stem-like cells from each diseased tissue sample relative to stem-like cells in normal samples in each tissue plotted against the malignancy continuum. Samples are colored based on if they are from different disease stage. |
Top |
Malignant transformation related pathway analysis |
| Find out the enriched GO biological processes and KEGG pathways involved in transition from healthy to precancer to cancer |
| Tissue | Disease Stage | Enriched GO biological Processes |
| Colorectum | AD |  |
| Colorectum | SER |  |
| Colorectum | MSS |  |
| Colorectum | MSI-H |  |
| Colorectum | FAP |  |
| ∗Top 15 enriched GO BP terms are showed in the bar plot of each disease state in each tissue. Each row represents a significant GO biological process which is colored according to the -log10(p.adjust). |
| Page: 1 2 3 4 5 6 7 8 9 |
| GO ID | Tissue | Disease Stage | Description | Gene Ratio | Bg Ratio | pvalue | p.adjust | Count |
| GO:000164918 | Esophagus | ESCC | osteoblast differentiation | 140/8552 | 229/18723 | 1.63e-06 | 1.95e-05 | 140 |
| GO:000150317 | Esophagus | ESCC | ossification | 232/8552 | 408/18723 | 3.00e-06 | 3.40e-05 | 232 |
| GO:00060668 | Esophagus | ESCC | alcohol metabolic process | 202/8552 | 353/18723 | 7.32e-06 | 7.26e-05 | 202 |
| GO:000606612 | Liver | Cirrhotic | alcohol metabolic process | 141/4634 | 353/18723 | 1.57e-10 | 8.03e-09 | 141 |
| GO:00067202 | Liver | Cirrhotic | isoprenoid metabolic process | 46/4634 | 116/18723 | 2.71e-04 | 2.41e-03 | 46 |
| GO:00016495 | Liver | Cirrhotic | osteoblast differentiation | 80/4634 | 229/18723 | 3.39e-04 | 2.91e-03 | 80 |
| GO:00067212 | Liver | Cirrhotic | terpenoid metabolic process | 38/4634 | 97/18723 | 1.16e-03 | 7.89e-03 | 38 |
| GO:00015035 | Liver | Cirrhotic | ossification | 127/4634 | 408/18723 | 1.89e-03 | 1.19e-02 | 127 |
| GO:004244511 | Liver | Cirrhotic | hormone metabolic process | 73/4634 | 218/18723 | 2.22e-03 | 1.36e-02 | 73 |
| GO:00343085 | Liver | Cirrhotic | primary alcohol metabolic process | 37/4634 | 102/18723 | 6.17e-03 | 3.07e-02 | 37 |
| GO:012025411 | Liver | Cirrhotic | olefinic compound metabolic process | 51/4634 | 153/18723 | 1.03e-02 | 4.61e-02 | 51 |
| GO:000606621 | Liver | HCC | alcohol metabolic process | 208/7958 | 353/18723 | 2.80e-10 | 9.50e-09 | 208 |
| GO:000672011 | Liver | HCC | isoprenoid metabolic process | 65/7958 | 116/18723 | 2.23e-03 | 1.11e-02 | 65 |
| GO:000164911 | Liver | HCC | osteoblast differentiation | 115/7958 | 229/18723 | 1.08e-02 | 3.99e-02 | 115 |
| GO:003430812 | Liver | HCC | primary alcohol metabolic process | 55/7958 | 102/18723 | 1.30e-02 | 4.67e-02 | 55 |
| GO:00060667 | Oral cavity | OSCC | alcohol metabolic process | 179/7305 | 353/18723 | 4.54e-06 | 5.21e-05 | 179 |
| GO:000150310 | Oral cavity | OSCC | ossification | 203/7305 | 408/18723 | 5.54e-06 | 6.19e-05 | 203 |
| GO:000164910 | Oral cavity | OSCC | osteoblast differentiation | 118/7305 | 229/18723 | 7.51e-05 | 5.85e-04 | 118 |
| GO:00067203 | Oral cavity | OSCC | isoprenoid metabolic process | 59/7305 | 116/18723 | 6.18e-03 | 2.33e-02 | 59 |
| GO:000606613 | Oral cavity | LP | alcohol metabolic process | 111/4623 | 353/18723 | 2.24e-03 | 1.62e-02 | 111 |
| Page: 1 2 |
| Pathway ID | Tissue | Disease Stage | Description | Gene Ratio | Bg Ratio | pvalue | p.adjust | qvalue | Count |
| Page: 1 |
Top |
Cell-cell communication analysis |
| Identification of potential cell-cell interactions between two cell types and their ligand-receptor pairs for different disease states |
| Ligand | Receptor | LRpair | Pathway | Tissue | Disease Stage |
| Page: 1 |
Top |
Single-cell gene regulatory network inference analysis |
| Find out the significant the regulons (TFs) and the target genes of each regulon across cell types for different disease states |
| TF | Cell Type | Tissue | Disease Stage | Target Gene | RSS | Regulon Activity |
| ∗The dot plots of a searched regulon are shown for all cell subpopulations in each disease state of each tissue based on the regulon specific score inferred using pySCENIC and by calculating the average expression. |
| Page: 1 |
Top |
Somatic mutation of malignant transformation related genes |
| Annotation of somatic variants for genes involved in malignant transformation |
| Hugo Symbol | Variant Class | Variant Classification | dbSNP RS | HGVSc | HGVSp | HGVSp Short | SWISSPROT | BIOTYPE | SIFT | PolyPhen | Tumor Sample Barcode | Tissue | Histology | Sex | Age | Stage | Therapy Types | Drugs | Outcome |
| RDH14 | SNV | Missense_Mutation | c.578N>G | p.Lys193Arg | p.K193R | Q9HBH5 | protein_coding | tolerated(0.15) | benign(0.247) | TCGA-A2-A0YJ-01 | Breast | breast invasive carcinoma | Female | <65 | III/IV | Chemotherapy | cytoxan | PD | |
| RDH14 | SNV | Missense_Mutation | c.948G>C | p.Met316Ile | p.M316I | Q9HBH5 | protein_coding | tolerated(0.09) | benign(0.054) | TCGA-EW-A1PH-01 | Breast | breast invasive carcinoma | Female | <65 | I/II | Chemotherapy | cyclophosphamide | SD | |
| RDH14 | SNV | Missense_Mutation | novel | c.775N>G | p.His259Asp | p.H259D | Q9HBH5 | protein_coding | tolerated(0.24) | benign(0) | TCGA-C5-A2LZ-01 | Cervix | cervical & endocervical cancer | Female | >=65 | III/IV | Unknown | Unknown | PD |
| RDH14 | SNV | Missense_Mutation | novel | c.575N>G | p.Ser192Cys | p.S192C | Q9HBH5 | protein_coding | deleterious(0) | probably_damaging(0.999) | TCGA-UC-A7PG-06 | Cervix | cervical & endocervical cancer | Female | <65 | III/IV | Chemotherapy | cisplatin | PD |
| RDH14 | SNV | Missense_Mutation | c.604N>G | p.Phe202Val | p.F202V | Q9HBH5 | protein_coding | deleterious(0) | possibly_damaging(0.796) | TCGA-AA-A010-01 | Colorectum | colon adenocarcinoma | Female | <65 | I/II | Chemotherapy | folinic | CR | |
| RDH14 | SNV | Missense_Mutation | c.467N>T | p.Gly156Val | p.G156V | Q9HBH5 | protein_coding | deleterious(0) | probably_damaging(1) | TCGA-G4-6628-01 | Colorectum | colon adenocarcinoma | Male | >=65 | I/II | Unknown | Unknown | SD | |
| RDH14 | SNV | Missense_Mutation | c.664N>A | p.Leu222Met | p.L222M | Q9HBH5 | protein_coding | deleterious(0) | probably_damaging(1) | TCGA-AG-3726-01 | Colorectum | rectum adenocarcinoma | Female | <65 | I/II | Unknown | Unknown | SD | |
| RDH14 | insertion | In_Frame_Ins | novel | c.711_712insCAA | p.Gly237_Thr238insGln | p.G237_T238insQ | Q9HBH5 | protein_coding | TCGA-AM-5820-01 | Colorectum | colon adenocarcinoma | Female | <65 | I/II | Unknown | Unknown | SD | ||
| RDH14 | SNV | Missense_Mutation | rs201424633 | c.592N>A | p.Gly198Arg | p.G198R | Q9HBH5 | protein_coding | deleterious(0) | probably_damaging(0.995) | TCGA-A5-A0G2-01 | Endometrium | uterine corpus endometrioid carcinoma | Female | <65 | III/IV | Unknown | Unknown | SD |
| RDH14 | SNV | Missense_Mutation | c.852N>T | p.Gln284His | p.Q284H | Q9HBH5 | protein_coding | deleterious(0.01) | probably_damaging(0.999) | TCGA-AP-A051-01 | Endometrium | uterine corpus endometrioid carcinoma | Female | >=65 | I/II | Unknown | Unknown | SD |
| Page: 1 2 3 |
Top |
Related drugs of malignant transformation related genes |
| Identification of chemicals and drugs interact with genes involved in malignant transfromation |
| (DGIdb 4.0) |
| Entrez ID | Symbol | Category | Interaction Types | Drug Claim Name | Drug Name | PMIDs |
| Page: 1 |

Copyright 2023-Present -The University of Texas Health Science Center at Houston |