
|
|||||
|
 | |
| |
| |
| |
| |
| |
|
Gene: RDH13 |
Gene summary for RDH13 |
| Gene information | Species | Human | Gene symbol | RDH13 | Gene ID | 112724 |
| Gene name | retinol dehydrogenase 13 | |
| Gene Alias | SDR7C3 | |
| Cytomap | 19q13.42 | |
| Gene Type | protein-coding | GO ID | GO:0001523 | UniProtAcc | A0A024R4M8 |
Top |
Malignant transformation analysis |
| Identification of the aberrant gene expression in precancerous and cancerous lesions by comparing the gene expression of stem-like cells in diseased tissues with normal stem cells |
| Entrez ID | Symbol | Replicates | Species | Organ | Tissue | Adj P-value | Log2FC | Malignancy |
| 112724 | RDH13 | LZE4T | Human | Esophagus | ESCC | 3.20e-03 | 1.21e-01 | 0.0811 |
| 112724 | RDH13 | LZE5T | Human | Esophagus | ESCC | 9.84e-04 | 2.39e-01 | 0.0514 |
| 112724 | RDH13 | LZE7T | Human | Esophagus | ESCC | 2.32e-05 | 1.90e-01 | 0.0667 |
| 112724 | RDH13 | LZE8T | Human | Esophagus | ESCC | 2.39e-05 | 1.03e-01 | 0.067 |
| 112724 | RDH13 | LZE24D1 | Human | Esophagus | HGIN | 1.47e-02 | 4.44e-01 | 0.054 |
| 112724 | RDH13 | LZE24T | Human | Esophagus | ESCC | 1.62e-10 | 3.07e-01 | 0.0596 |
| 112724 | RDH13 | LZE21T | Human | Esophagus | ESCC | 2.50e-04 | 2.12e-01 | 0.0655 |
| 112724 | RDH13 | P1T-E | Human | Esophagus | ESCC | 7.99e-12 | 4.84e-01 | 0.0875 |
| 112724 | RDH13 | P2T-E | Human | Esophagus | ESCC | 4.78e-06 | 3.37e-02 | 0.1177 |
| 112724 | RDH13 | P4T-E | Human | Esophagus | ESCC | 4.87e-10 | 1.94e-01 | 0.1323 |
| 112724 | RDH13 | P5T-E | Human | Esophagus | ESCC | 3.90e-19 | 3.51e-01 | 0.1327 |
| 112724 | RDH13 | P8T-E | Human | Esophagus | ESCC | 1.13e-28 | 4.75e-01 | 0.0889 |
| 112724 | RDH13 | P9T-E | Human | Esophagus | ESCC | 2.97e-04 | 5.97e-02 | 0.1131 |
| 112724 | RDH13 | P10T-E | Human | Esophagus | ESCC | 4.57e-06 | 1.87e-01 | 0.116 |
| 112724 | RDH13 | P11T-E | Human | Esophagus | ESCC | 4.78e-06 | 3.61e-01 | 0.1426 |
| 112724 | RDH13 | P12T-E | Human | Esophagus | ESCC | 5.90e-08 | 1.65e-01 | 0.1122 |
| 112724 | RDH13 | P15T-E | Human | Esophagus | ESCC | 4.38e-08 | 5.78e-02 | 0.1149 |
| 112724 | RDH13 | P16T-E | Human | Esophagus | ESCC | 2.58e-09 | 6.81e-02 | 0.1153 |
| 112724 | RDH13 | P17T-E | Human | Esophagus | ESCC | 3.25e-05 | 1.33e-01 | 0.1278 |
| 112724 | RDH13 | P20T-E | Human | Esophagus | ESCC | 4.22e-23 | 3.33e-01 | 0.1124 |
| Page: 1 2 3 4 |
| Tissue | Expression Dynamics | Abbreviation |
| Esophagus |  | ESCC: Esophageal squamous cell carcinoma |
| HGIN: High-grade intraepithelial neoplasias | ||
| LGIN: Low-grade intraepithelial neoplasias | ||
| Oral Cavity | 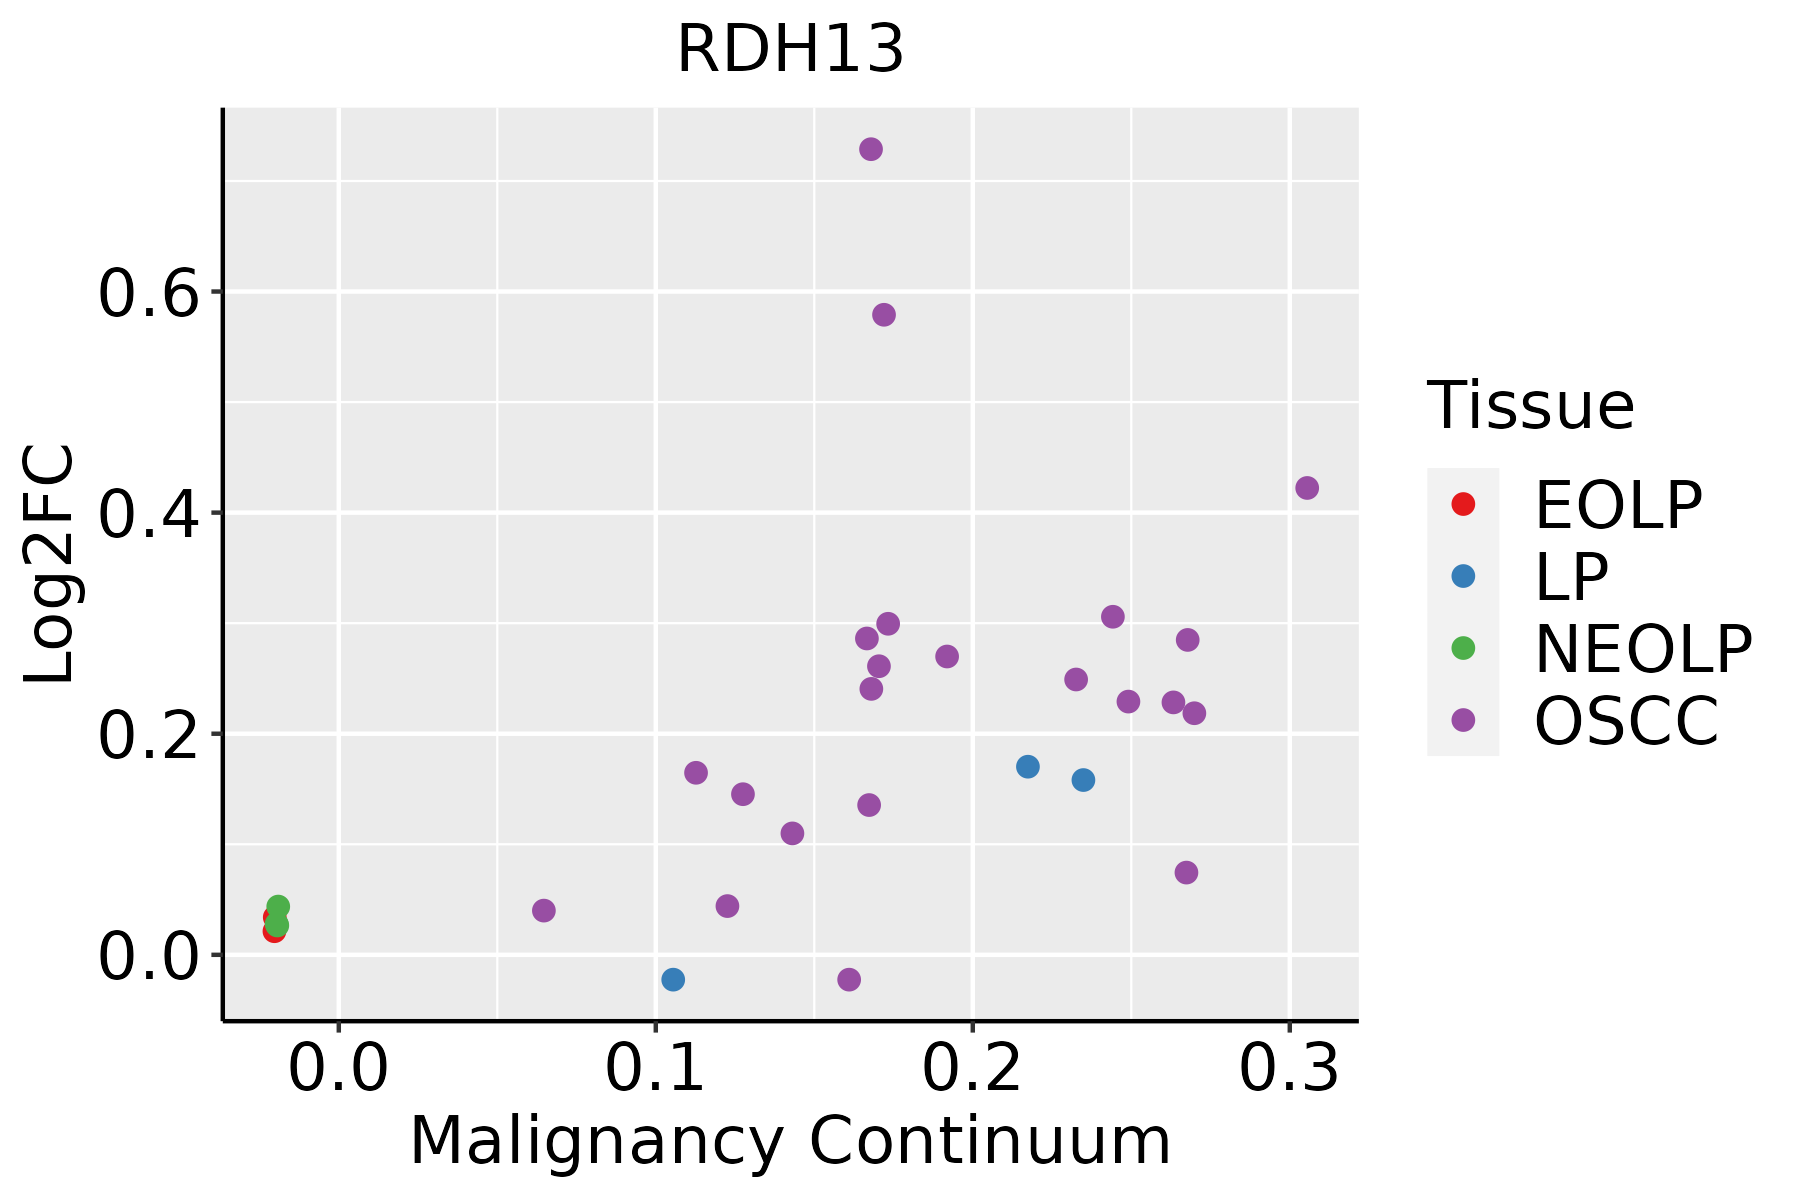 | EOLP: Erosive Oral lichen planus |
| LP: leukoplakia | ||
| NEOLP: Non-erosive oral lichen planus | ||
| OSCC: Oral squamous cell carcinoma |
| ∗log2FC in expression of this searched gene in stem-like cells from each diseased tissue sample relative to stem-like cells in normal samples in each tissue plotted against the malignancy continuum. Samples are colored based on if they are from different disease stage. |
Top |
Malignant transformation related pathway analysis |
| Find out the enriched GO biological processes and KEGG pathways involved in transition from healthy to precancer to cancer |
| Tissue | Disease Stage | Enriched GO biological Processes |
| Colorectum | AD |  |
| Colorectum | SER |  |
| Colorectum | MSS |  |
| Colorectum | MSI-H |  |
| Colorectum | FAP |  |
| ∗Top 15 enriched GO BP terms are showed in the bar plot of each disease state in each tissue. Each row represents a significant GO biological process which is colored according to the -log10(p.adjust). |
| Page: 1 2 3 4 5 6 7 8 9 |
| GO ID | Tissue | Disease Stage | Description | Gene Ratio | Bg Ratio | pvalue | p.adjust | Count |
| GO:000931419 | Esophagus | ESCC | response to radiation | 277/8552 | 456/18723 | 4.42e-11 | 1.43e-09 | 277 |
| GO:00060668 | Esophagus | ESCC | alcohol metabolic process | 202/8552 | 353/18723 | 7.32e-06 | 7.26e-05 | 202 |
| GO:000941611 | Esophagus | ESCC | response to light stimulus | 183/8552 | 320/18723 | 2.03e-05 | 1.76e-04 | 183 |
| GO:00060818 | Esophagus | ESCC | cellular aldehyde metabolic process | 40/8552 | 60/18723 | 8.30e-04 | 4.28e-03 | 40 |
| GO:000931416 | Oral cavity | OSCC | response to radiation | 241/7305 | 456/18723 | 9.76e-10 | 2.40e-08 | 241 |
| GO:00060667 | Oral cavity | OSCC | alcohol metabolic process | 179/7305 | 353/18723 | 4.54e-06 | 5.21e-05 | 179 |
| GO:00094164 | Oral cavity | OSCC | response to light stimulus | 159/7305 | 320/18723 | 5.98e-05 | 4.92e-04 | 159 |
| GO:00060817 | Oral cavity | OSCC | cellular aldehyde metabolic process | 36/7305 | 60/18723 | 7.94e-04 | 4.27e-03 | 36 |
| GO:00067203 | Oral cavity | OSCC | isoprenoid metabolic process | 59/7305 | 116/18723 | 6.18e-03 | 2.33e-02 | 59 |
| Page: 1 |
| Pathway ID | Tissue | Disease Stage | Description | Gene Ratio | Bg Ratio | pvalue | p.adjust | qvalue | Count |
| hsa012405 | Esophagus | ESCC | Biosynthesis of cofactors | 97/4205 | 153/8465 | 3.88e-04 | 1.35e-03 | 6.94e-04 | 97 |
| hsa0124012 | Esophagus | ESCC | Biosynthesis of cofactors | 97/4205 | 153/8465 | 3.88e-04 | 1.35e-03 | 6.94e-04 | 97 |
| hsa012404 | Oral cavity | OSCC | Biosynthesis of cofactors | 88/3704 | 153/8465 | 3.84e-04 | 1.20e-03 | 6.12e-04 | 88 |
| hsa0124011 | Oral cavity | OSCC | Biosynthesis of cofactors | 88/3704 | 153/8465 | 3.84e-04 | 1.20e-03 | 6.12e-04 | 88 |
| Page: 1 |
Top |
Cell-cell communication analysis |
| Identification of potential cell-cell interactions between two cell types and their ligand-receptor pairs for different disease states |
| Ligand | Receptor | LRpair | Pathway | Tissue | Disease Stage |
| Page: 1 |
Top |
Single-cell gene regulatory network inference analysis |
| Find out the significant the regulons (TFs) and the target genes of each regulon across cell types for different disease states |
| TF | Cell Type | Tissue | Disease Stage | Target Gene | RSS | Regulon Activity |
| ∗The dot plots of a searched regulon are shown for all cell subpopulations in each disease state of each tissue based on the regulon specific score inferred using pySCENIC and by calculating the average expression. |
| Page: 1 |
Top |
Somatic mutation of malignant transformation related genes |
| Annotation of somatic variants for genes involved in malignant transformation |
| Hugo Symbol | Variant Class | Variant Classification | dbSNP RS | HGVSc | HGVSp | HGVSp Short | SWISSPROT | BIOTYPE | SIFT | PolyPhen | Tumor Sample Barcode | Tissue | Histology | Sex | Age | Stage | Therapy Types | Drugs | Outcome |
| RDH13 | SNV | Missense_Mutation | rs752343665 | c.760G>A | p.Gly254Arg | p.G254R | Q8NBN7 | protein_coding | tolerated(0.54) | benign(0.005) | TCGA-PE-A5DC-01 | Breast | breast invasive carcinoma | Female | >=65 | III/IV | Unknown | Unknown | SD |
| RDH13 | deletion | Frame_Shift_Del | novel | c.913delN | p.Val305TrpfsTer15 | p.V305Wfs*15 | Q8NBN7 | protein_coding | TCGA-D8-A27V-01 | Breast | breast invasive carcinoma | Female | <65 | I/II | Hormone Therapy | tamoxiphen | SD | ||
| RDH13 | SNV | Missense_Mutation | c.491C>T | p.Ser164Leu | p.S164L | Q8NBN7 | protein_coding | deleterious(0) | possibly_damaging(0.572) | TCGA-Q1-A5R2-01 | Cervix | cervical & endocervical cancer | Female | <65 | I/II | Chemotherapy | cisplatin | PR | |
| RDH13 | SNV | Missense_Mutation | c.749N>A | p.Ser250Asn | p.S250N | Q8NBN7 | protein_coding | tolerated(0.47) | benign(0.001) | TCGA-A6-2686-01 | Colorectum | colon adenocarcinoma | Female | >=65 | I/II | Unknown | Unknown | SD | |
| RDH13 | SNV | Missense_Mutation | rs747477243 | c.722N>T | p.Thr241Met | p.T241M | Q8NBN7 | protein_coding | tolerated(0.58) | probably_damaging(0.959) | TCGA-AZ-4315-01 | Colorectum | colon adenocarcinoma | Male | <65 | I/II | Unknown | Unknown | SD |
| RDH13 | SNV | Missense_Mutation | c.319N>C | p.Phe107Leu | p.F107L | Q8NBN7 | protein_coding | deleterious(0.05) | probably_damaging(0.936) | TCGA-CK-4951-01 | Colorectum | colon adenocarcinoma | Female | >=65 | I/II | Unknown | Unknown | PD | |
| RDH13 | SNV | Missense_Mutation | rs375198967 | c.622N>A | p.Val208Ile | p.V208I | Q8NBN7 | protein_coding | tolerated(0.4) | benign(0.017) | TCGA-A5-A1OF-01 | Endometrium | uterine corpus endometrioid carcinoma | Female | <65 | I/II | Unknown | Unknown | SD |
| RDH13 | SNV | Missense_Mutation | rs759505965 | c.127N>A | p.Val43Met | p.V43M | Q8NBN7 | protein_coding | deleterious(0) | probably_damaging(0.911) | TCGA-AP-A059-01 | Endometrium | uterine corpus endometrioid carcinoma | Female | >=65 | I/II | Unknown | Unknown | SD |
| RDH13 | SNV | Missense_Mutation | rs547681726 | c.163G>A | p.Ala55Thr | p.A55T | Q8NBN7 | protein_coding | deleterious(0.01) | probably_damaging(0.999) | TCGA-AP-A0LM-01 | Endometrium | uterine corpus endometrioid carcinoma | Female | <65 | III/IV | Chemotherapy | cisplatin | SD |
| RDH13 | SNV | Missense_Mutation | rs753148836 | c.412G>A | p.Gly138Ser | p.G138S | Q8NBN7 | protein_coding | deleterious(0) | probably_damaging(0.93) | TCGA-AX-A06F-01 | Endometrium | uterine corpus endometrioid carcinoma | Female | <65 | III/IV | Chemotherapy | carboplatin | SD |
| Page: 1 2 3 4 |
Top |
Related drugs of malignant transformation related genes |
| Identification of chemicals and drugs interact with genes involved in malignant transfromation |
| (DGIdb 4.0) |
| Entrez ID | Symbol | Category | Interaction Types | Drug Claim Name | Drug Name | PMIDs |
| Page: 1 |

Copyright 2023-Present -The University of Texas Health Science Center at Houston |