
|
|||||
|
 | |
| |
| |
| |
| |
| |
|
Gene: RDH11 |
Gene summary for RDH11 |
| Gene information | Species | Human | Gene symbol | RDH11 | Gene ID | 51109 |
| Gene name | retinol dehydrogenase 11 | |
| Gene Alias | ARSDR1 | |
| Cytomap | 14q24.1 | |
| Gene Type | protein-coding | GO ID | GO:0001523 | UniProtAcc | Q8TC12 |
Top |
Malignant transformation analysis |
| Identification of the aberrant gene expression in precancerous and cancerous lesions by comparing the gene expression of stem-like cells in diseased tissues with normal stem cells |
| Entrez ID | Symbol | Replicates | Species | Organ | Tissue | Adj P-value | Log2FC | Malignancy |
| 51109 | RDH11 | LZE2T | Human | Esophagus | ESCC | 1.19e-02 | 4.61e-01 | 0.082 |
| 51109 | RDH11 | LZE4T | Human | Esophagus | ESCC | 3.40e-13 | 4.83e-01 | 0.0811 |
| 51109 | RDH11 | LZE7T | Human | Esophagus | ESCC | 3.38e-06 | 2.53e-01 | 0.0667 |
| 51109 | RDH11 | LZE8T | Human | Esophagus | ESCC | 1.75e-04 | 4.29e-02 | 0.067 |
| 51109 | RDH11 | LZE20T | Human | Esophagus | ESCC | 8.41e-04 | 2.24e-01 | 0.0662 |
| 51109 | RDH11 | LZE24T | Human | Esophagus | ESCC | 7.21e-11 | 3.43e-01 | 0.0596 |
| 51109 | RDH11 | LZE21T | Human | Esophagus | ESCC | 4.74e-02 | 4.01e-01 | 0.0655 |
| 51109 | RDH11 | P1T-E | Human | Esophagus | ESCC | 1.91e-03 | 1.31e-01 | 0.0875 |
| 51109 | RDH11 | P2T-E | Human | Esophagus | ESCC | 2.26e-27 | 4.17e-01 | 0.1177 |
| 51109 | RDH11 | P4T-E | Human | Esophagus | ESCC | 4.69e-35 | 9.19e-01 | 0.1323 |
| 51109 | RDH11 | P5T-E | Human | Esophagus | ESCC | 9.92e-13 | 2.94e-01 | 0.1327 |
| 51109 | RDH11 | P8T-E | Human | Esophagus | ESCC | 1.27e-18 | 3.48e-01 | 0.0889 |
| 51109 | RDH11 | P9T-E | Human | Esophagus | ESCC | 3.03e-13 | 2.50e-01 | 0.1131 |
| 51109 | RDH11 | P10T-E | Human | Esophagus | ESCC | 1.24e-42 | 8.47e-01 | 0.116 |
| 51109 | RDH11 | P11T-E | Human | Esophagus | ESCC | 6.64e-08 | 4.72e-01 | 0.1426 |
| 51109 | RDH11 | P12T-E | Human | Esophagus | ESCC | 7.11e-43 | 8.72e-01 | 0.1122 |
| 51109 | RDH11 | P15T-E | Human | Esophagus | ESCC | 1.32e-54 | 1.23e+00 | 0.1149 |
| 51109 | RDH11 | P16T-E | Human | Esophagus | ESCC | 2.41e-37 | 7.73e-01 | 0.1153 |
| 51109 | RDH11 | P17T-E | Human | Esophagus | ESCC | 1.80e-05 | 3.75e-01 | 0.1278 |
| 51109 | RDH11 | P19T-E | Human | Esophagus | ESCC | 3.19e-11 | 5.98e-01 | 0.1662 |
| Page: 1 2 3 4 5 6 7 |
| Tissue | Expression Dynamics | Abbreviation |
| Esophagus | 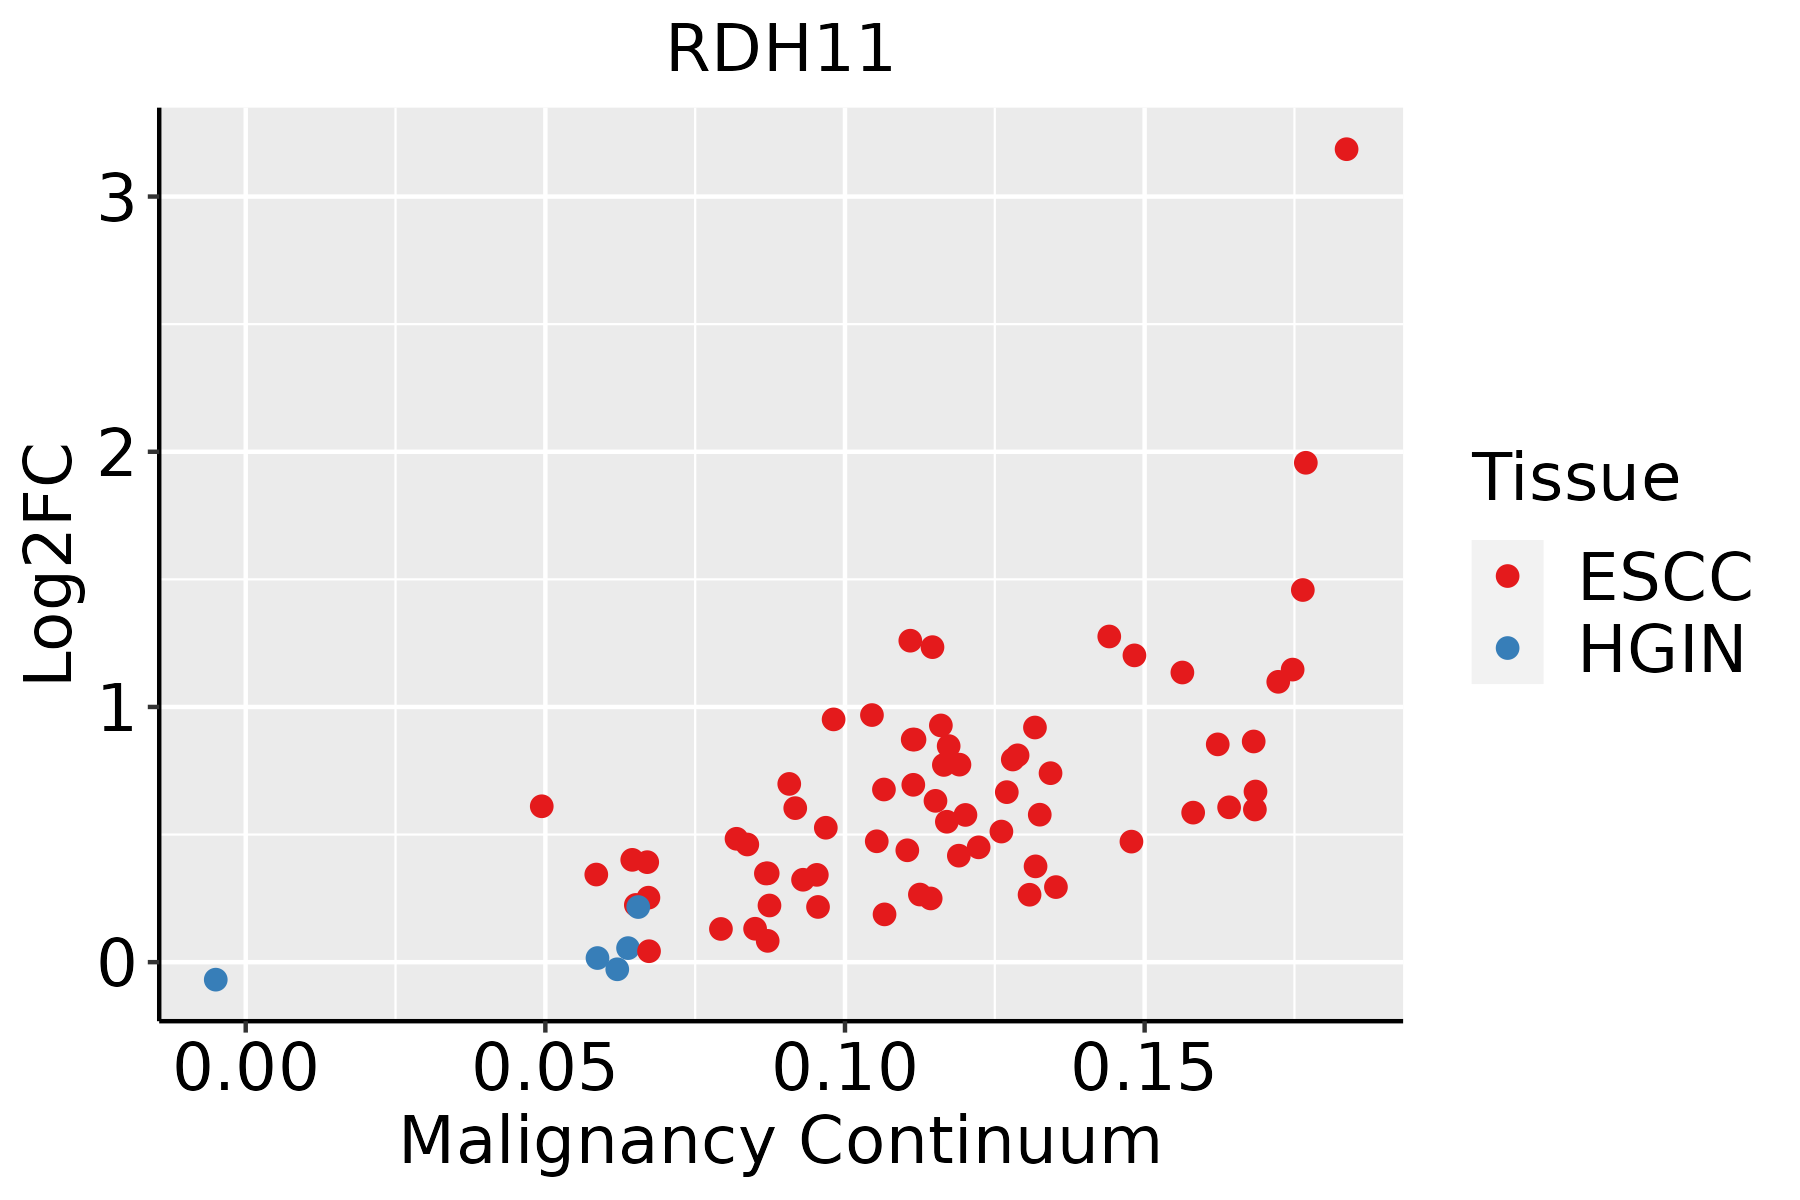 | ESCC: Esophageal squamous cell carcinoma |
| HGIN: High-grade intraepithelial neoplasias | ||
| LGIN: Low-grade intraepithelial neoplasias | ||
| Liver |  | HCC: Hepatocellular carcinoma |
| NAFLD: Non-alcoholic fatty liver disease | ||
| Oral Cavity |  | EOLP: Erosive Oral lichen planus |
| LP: leukoplakia | ||
| NEOLP: Non-erosive oral lichen planus | ||
| OSCC: Oral squamous cell carcinoma | ||
| Prostate | 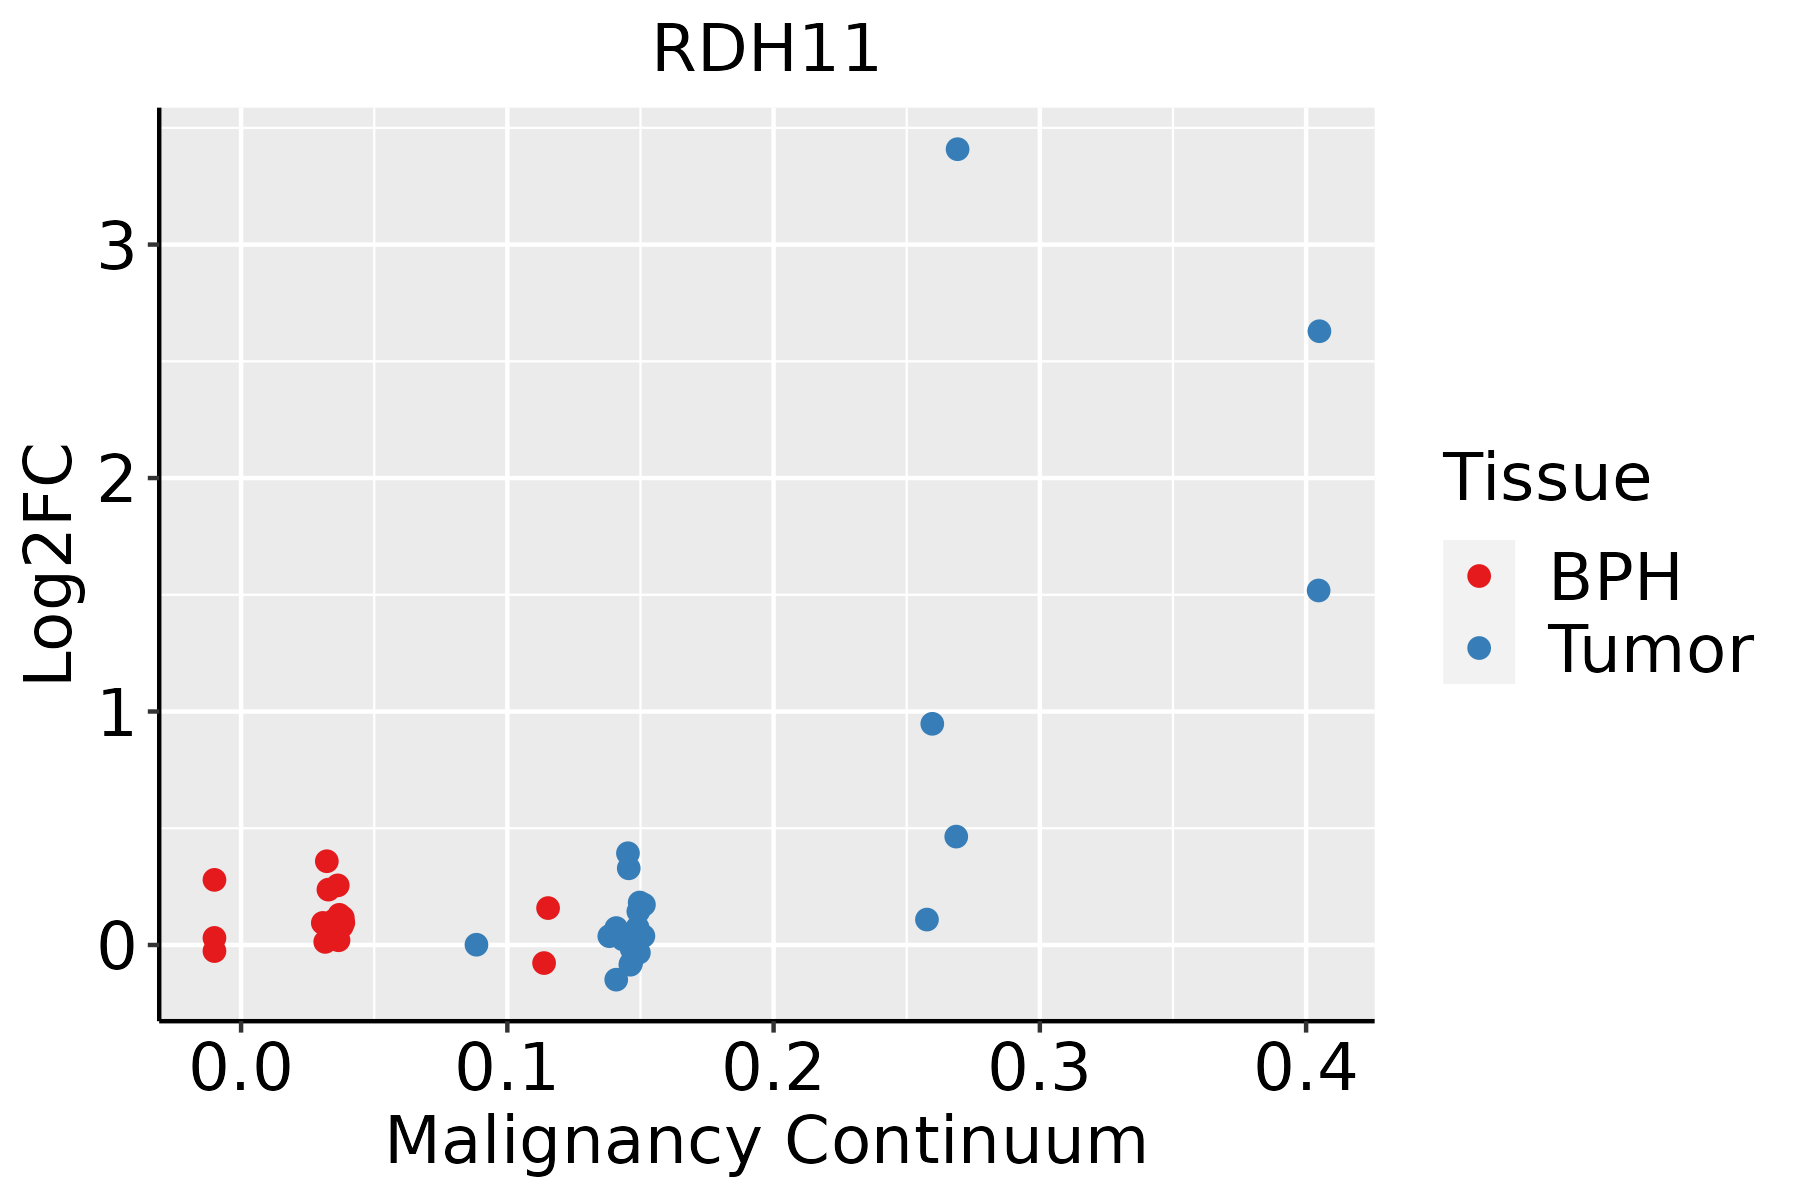 | BPH: Benign Prostatic Hyperplasia |
| Skin | 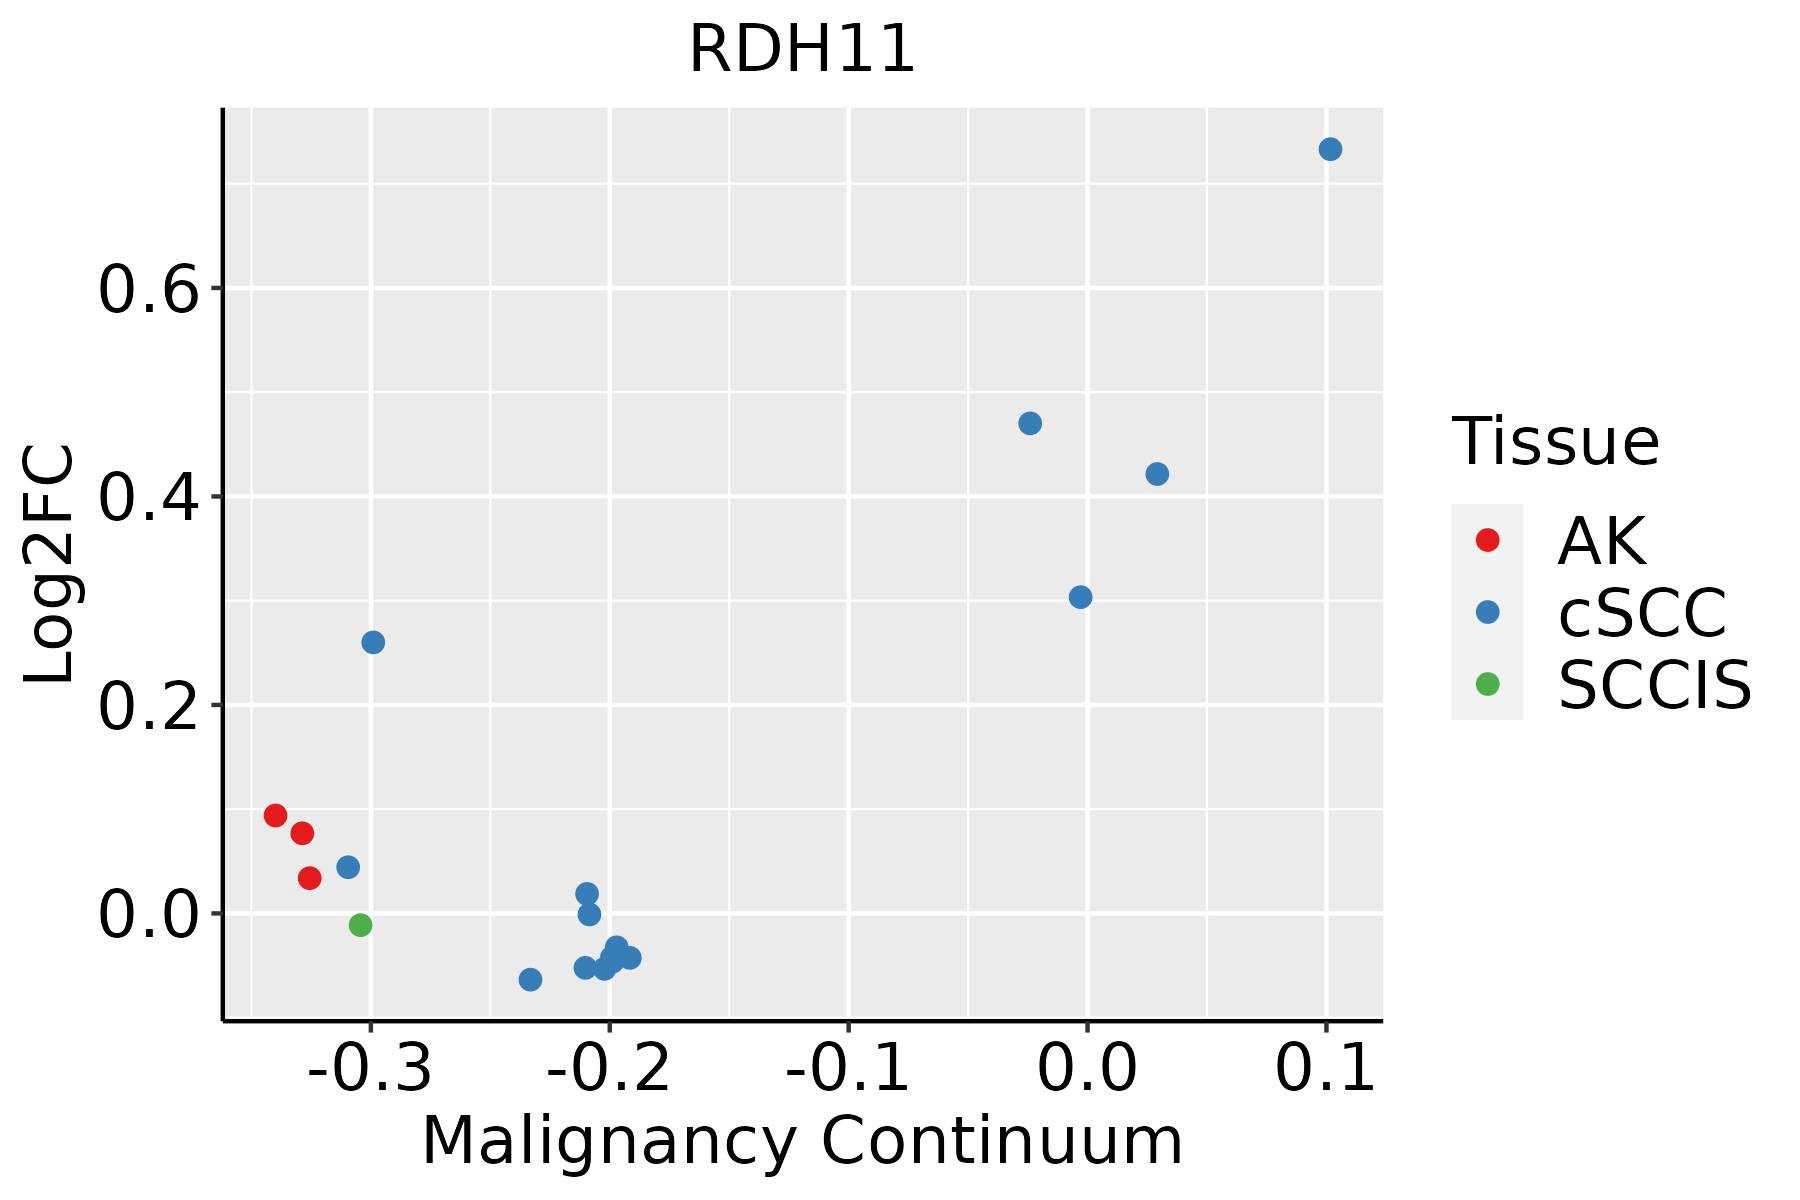 | AK: Actinic keratosis |
| cSCC: Cutaneous squamous cell carcinoma | ||
| SCCIS:squamous cell carcinoma in situ | ||
| Thyroid |  | ATC: Anaplastic thyroid cancer |
| HT: Hashimoto's thyroiditis | ||
| PTC: Papillary thyroid cancer |
| ∗log2FC in expression of this searched gene in stem-like cells from each diseased tissue sample relative to stem-like cells in normal samples in each tissue plotted against the malignancy continuum. Samples are colored based on if they are from different disease stage. |
Top |
Malignant transformation related pathway analysis |
| Find out the enriched GO biological processes and KEGG pathways involved in transition from healthy to precancer to cancer |
| Tissue | Disease Stage | Enriched GO biological Processes |
| Colorectum | AD |  |
| Colorectum | SER |  |
| Colorectum | MSS |  |
| Colorectum | MSI-H |  |
| Colorectum | FAP |  |
| ∗Top 15 enriched GO BP terms are showed in the bar plot of each disease state in each tissue. Each row represents a significant GO biological process which is colored according to the -log10(p.adjust). |
| Page: 1 2 3 4 5 6 7 8 9 |
| GO ID | Tissue | Disease Stage | Description | Gene Ratio | Bg Ratio | pvalue | p.adjust | Count |
| GO:00060668 | Esophagus | ESCC | alcohol metabolic process | 202/8552 | 353/18723 | 7.32e-06 | 7.26e-05 | 202 |
| GO:000963620 | Esophagus | ESCC | response to toxic substance | 150/8552 | 262/18723 | 1.00e-04 | 7.12e-04 | 150 |
| GO:00060818 | Esophagus | ESCC | cellular aldehyde metabolic process | 40/8552 | 60/18723 | 8.30e-04 | 4.28e-03 | 40 |
| GO:1990748110 | Esophagus | ESCC | cellular detoxification | 70/8552 | 116/18723 | 1.02e-03 | 5.17e-03 | 70 |
| GO:0097237110 | Esophagus | ESCC | cellular response to toxic substance | 72/8552 | 124/18723 | 3.65e-03 | 1.49e-02 | 72 |
| GO:000606612 | Liver | Cirrhotic | alcohol metabolic process | 141/4634 | 353/18723 | 1.57e-10 | 8.03e-09 | 141 |
| GO:000963612 | Liver | Cirrhotic | response to toxic substance | 104/4634 | 262/18723 | 5.63e-08 | 1.74e-06 | 104 |
| GO:00987547 | Liver | Cirrhotic | detoxification | 60/4634 | 152/18723 | 4.09e-05 | 4.86e-04 | 60 |
| GO:00972377 | Liver | Cirrhotic | cellular response to toxic substance | 50/4634 | 124/18723 | 9.20e-05 | 9.79e-04 | 50 |
| GO:19907487 | Liver | Cirrhotic | cellular detoxification | 47/4634 | 116/18723 | 1.28e-04 | 1.26e-03 | 47 |
| GO:00060815 | Liver | Cirrhotic | cellular aldehyde metabolic process | 28/4634 | 60/18723 | 1.83e-04 | 1.71e-03 | 28 |
| GO:00067202 | Liver | Cirrhotic | isoprenoid metabolic process | 46/4634 | 116/18723 | 2.71e-04 | 2.41e-03 | 46 |
| GO:00067212 | Liver | Cirrhotic | terpenoid metabolic process | 38/4634 | 97/18723 | 1.16e-03 | 7.89e-03 | 38 |
| GO:004244511 | Liver | Cirrhotic | hormone metabolic process | 73/4634 | 218/18723 | 2.22e-03 | 1.36e-02 | 73 |
| GO:01100966 | Liver | Cirrhotic | cellular response to aldehyde | 8/4634 | 13/18723 | 5.27e-03 | 2.70e-02 | 8 |
| GO:00343085 | Liver | Cirrhotic | primary alcohol metabolic process | 37/4634 | 102/18723 | 6.17e-03 | 3.07e-02 | 37 |
| GO:012025411 | Liver | Cirrhotic | olefinic compound metabolic process | 51/4634 | 153/18723 | 1.03e-02 | 4.61e-02 | 51 |
| GO:000606621 | Liver | HCC | alcohol metabolic process | 208/7958 | 353/18723 | 2.80e-10 | 9.50e-09 | 208 |
| GO:000963622 | Liver | HCC | response to toxic substance | 153/7958 | 262/18723 | 1.37e-07 | 2.58e-06 | 153 |
| GO:199074812 | Liver | HCC | cellular detoxification | 70/7958 | 116/18723 | 7.87e-05 | 7.02e-04 | 70 |
| Page: 1 2 3 4 |
| Pathway ID | Tissue | Disease Stage | Description | Gene Ratio | Bg Ratio | pvalue | p.adjust | qvalue | Count |
| hsa012405 | Esophagus | ESCC | Biosynthesis of cofactors | 97/4205 | 153/8465 | 3.88e-04 | 1.35e-03 | 6.94e-04 | 97 |
| hsa0124012 | Esophagus | ESCC | Biosynthesis of cofactors | 97/4205 | 153/8465 | 3.88e-04 | 1.35e-03 | 6.94e-04 | 97 |
| hsa01240 | Liver | Cirrhotic | Biosynthesis of cofactors | 66/2530 | 153/8465 | 3.11e-04 | 1.99e-03 | 1.23e-03 | 66 |
| hsa012401 | Liver | Cirrhotic | Biosynthesis of cofactors | 66/2530 | 153/8465 | 3.11e-04 | 1.99e-03 | 1.23e-03 | 66 |
| hsa012402 | Liver | HCC | Biosynthesis of cofactors | 103/4020 | 153/8465 | 4.67e-07 | 5.05e-06 | 2.81e-06 | 103 |
| hsa012403 | Liver | HCC | Biosynthesis of cofactors | 103/4020 | 153/8465 | 4.67e-07 | 5.05e-06 | 2.81e-06 | 103 |
| hsa012404 | Oral cavity | OSCC | Biosynthesis of cofactors | 88/3704 | 153/8465 | 3.84e-04 | 1.20e-03 | 6.12e-04 | 88 |
| hsa0124011 | Oral cavity | OSCC | Biosynthesis of cofactors | 88/3704 | 153/8465 | 3.84e-04 | 1.20e-03 | 6.12e-04 | 88 |
| hsa0124021 | Oral cavity | LP | Biosynthesis of cofactors | 57/2418 | 153/8465 | 1.17e-02 | 3.91e-02 | 2.52e-02 | 57 |
| hsa0124031 | Oral cavity | LP | Biosynthesis of cofactors | 57/2418 | 153/8465 | 1.17e-02 | 3.91e-02 | 2.52e-02 | 57 |
| Page: 1 |
Top |
Cell-cell communication analysis |
| Identification of potential cell-cell interactions between two cell types and their ligand-receptor pairs for different disease states |
| Ligand | Receptor | LRpair | Pathway | Tissue | Disease Stage |
| Page: 1 |
Top |
Single-cell gene regulatory network inference analysis |
| Find out the significant the regulons (TFs) and the target genes of each regulon across cell types for different disease states |
| TF | Cell Type | Tissue | Disease Stage | Target Gene | RSS | Regulon Activity |
| ∗The dot plots of a searched regulon are shown for all cell subpopulations in each disease state of each tissue based on the regulon specific score inferred using pySCENIC and by calculating the average expression. |
| Page: 1 |
Top |
Somatic mutation of malignant transformation related genes |
| Annotation of somatic variants for genes involved in malignant transformation |
| Hugo Symbol | Variant Class | Variant Classification | dbSNP RS | HGVSc | HGVSp | HGVSp Short | SWISSPROT | BIOTYPE | SIFT | PolyPhen | Tumor Sample Barcode | Tissue | Histology | Sex | Age | Stage | Therapy Types | Drugs | Outcome |
| RDH11 | SNV | Missense_Mutation | c.244N>A | p.Ala82Thr | p.A82T | Q8TC12 | protein_coding | tolerated(0.09) | possibly_damaging(0.627) | TCGA-BH-A0HF-01 | Breast | breast invasive carcinoma | Female | >=65 | I/II | Hormone Therapy | arimidex | SD | |
| RDH11 | SNV | Missense_Mutation | c.388N>A | p.Val130Met | p.V130M | Q8TC12 | protein_coding | deleterious(0.01) | probably_damaging(0.997) | TCGA-BH-A0HQ-01 | Breast | breast invasive carcinoma | Female | <65 | I/II | Hormone Therapy | arimidex | SD | |
| RDH11 | SNV | Missense_Mutation | novel | c.9N>C | p.Glu3Asp | p.E3D | Q8TC12 | protein_coding | tolerated(0.64) | benign(0.006) | TCGA-GI-A2C9-01 | Breast | breast invasive carcinoma | Female | <65 | I/II | Unspecific | SD | |
| RDH11 | insertion | Frame_Shift_Ins | novel | c.870_871insATGCCTACGCTTGACAAACACCTGTTGTCAACAAG | p.Trp291MetfsTer23 | p.W291Mfs*23 | Q8TC12 | protein_coding | TCGA-A8-A0A4-01 | Breast | breast invasive carcinoma | Female | >=65 | I/II | Hormone Therapy | tamoxiphen | CR | ||
| RDH11 | SNV | Missense_Mutation | rs150964554 | c.200N>A | p.Arg67Gln | p.R67Q | Q8TC12 | protein_coding | deleterious(0.01) | probably_damaging(0.972) | TCGA-AZ-4315-01 | Colorectum | colon adenocarcinoma | Male | <65 | I/II | Unknown | Unknown | SD |
| RDH11 | SNV | Missense_Mutation | c.82N>A | p.Leu28Met | p.L28M | Q8TC12 | protein_coding | tolerated(0.55) | benign(0.264) | TCGA-CK-4951-01 | Colorectum | colon adenocarcinoma | Female | >=65 | I/II | Unknown | Unknown | PD | |
| RDH11 | SNV | Missense_Mutation | novel | c.49C>A | p.Leu17Met | p.L17M | Q8TC12 | protein_coding | deleterious(0.04) | probably_damaging(0.996) | TCGA-AG-A002-01 | Colorectum | rectum adenocarcinoma | Male | <65 | I/II | Unknown | Unknown | SD |
| RDH11 | SNV | Missense_Mutation | novel | c.398G>A | p.Cys133Tyr | p.C133Y | Q8TC12 | protein_coding | deleterious(0.01) | probably_damaging(0.958) | TCGA-A5-A0G2-01 | Endometrium | uterine corpus endometrioid carcinoma | Female | <65 | III/IV | Unknown | Unknown | SD |
| RDH11 | SNV | Missense_Mutation | novel | c.191G>T | p.Arg64Ile | p.R64I | Q8TC12 | protein_coding | deleterious(0) | probably_damaging(1) | TCGA-A5-A0G2-01 | Endometrium | uterine corpus endometrioid carcinoma | Female | <65 | III/IV | Unknown | Unknown | SD |
| RDH11 | SNV | Missense_Mutation | rs745962202 | c.513N>T | p.Arg171Ser | p.R171S | Q8TC12 | protein_coding | deleterious(0) | probably_damaging(1) | TCGA-AJ-A3IA-01 | Endometrium | uterine corpus endometrioid carcinoma | Female | >=65 | I/II | Unknown | Unknown | SD |
| Page: 1 2 3 |
Top |
Related drugs of malignant transformation related genes |
| Identification of chemicals and drugs interact with genes involved in malignant transfromation |
| (DGIdb 4.0) |
| Entrez ID | Symbol | Category | Interaction Types | Drug Claim Name | Drug Name | PMIDs |
| Page: 1 |

Copyright 2023-Present -The University of Texas Health Science Center at Houston |