
|
|||||
|
 | |
| |
| |
| |
| |
| |
|
Gene: RCOR3 |
Gene summary for RCOR3 |
| Gene information | Species | Human | Gene symbol | RCOR3 | Gene ID | 55758 |
| Gene name | REST corepressor 3 | |
| Gene Alias | RCOR3 | |
| Cytomap | 1q32.2-q32.3 | |
| Gene Type | protein-coding | GO ID | GO:0006139 | UniProtAcc | Q9P2K3 |
Top |
Malignant transformation analysis |
| Identification of the aberrant gene expression in precancerous and cancerous lesions by comparing the gene expression of stem-like cells in diseased tissues with normal stem cells |
| Entrez ID | Symbol | Replicates | Species | Organ | Tissue | Adj P-value | Log2FC | Malignancy |
| 55758 | RCOR3 | LZE2T | Human | Esophagus | ESCC | 8.19e-10 | 6.55e-01 | 0.082 |
| 55758 | RCOR3 | LZE4T | Human | Esophagus | ESCC | 3.76e-17 | 5.70e-01 | 0.0811 |
| 55758 | RCOR3 | LZE7T | Human | Esophagus | ESCC | 1.99e-14 | 6.43e-01 | 0.0667 |
| 55758 | RCOR3 | LZE8T | Human | Esophagus | ESCC | 1.61e-04 | 8.54e-02 | 0.067 |
| 55758 | RCOR3 | LZE24T | Human | Esophagus | ESCC | 1.94e-12 | 2.97e-01 | 0.0596 |
| 55758 | RCOR3 | P1T-E | Human | Esophagus | ESCC | 4.75e-15 | 5.46e-01 | 0.0875 |
| 55758 | RCOR3 | P2T-E | Human | Esophagus | ESCC | 2.36e-32 | 4.62e-01 | 0.1177 |
| 55758 | RCOR3 | P4T-E | Human | Esophagus | ESCC | 6.37e-38 | 7.97e-01 | 0.1323 |
| 55758 | RCOR3 | P5T-E | Human | Esophagus | ESCC | 7.08e-28 | 4.95e-01 | 0.1327 |
| 55758 | RCOR3 | P8T-E | Human | Esophagus | ESCC | 8.05e-21 | 2.63e-01 | 0.0889 |
| 55758 | RCOR3 | P9T-E | Human | Esophagus | ESCC | 7.78e-13 | 2.27e-01 | 0.1131 |
| 55758 | RCOR3 | P10T-E | Human | Esophagus | ESCC | 1.86e-28 | 4.08e-01 | 0.116 |
| 55758 | RCOR3 | P11T-E | Human | Esophagus | ESCC | 1.83e-10 | 3.96e-01 | 0.1426 |
| 55758 | RCOR3 | P12T-E | Human | Esophagus | ESCC | 1.37e-22 | 2.59e-01 | 0.1122 |
| 55758 | RCOR3 | P15T-E | Human | Esophagus | ESCC | 6.41e-29 | 5.52e-01 | 0.1149 |
| 55758 | RCOR3 | P16T-E | Human | Esophagus | ESCC | 3.66e-24 | 4.37e-01 | 0.1153 |
| 55758 | RCOR3 | P17T-E | Human | Esophagus | ESCC | 4.01e-08 | 2.18e-01 | 0.1278 |
| 55758 | RCOR3 | P19T-E | Human | Esophagus | ESCC | 9.26e-03 | 3.24e-01 | 0.1662 |
| 55758 | RCOR3 | P20T-E | Human | Esophagus | ESCC | 2.71e-18 | 4.31e-01 | 0.1124 |
| 55758 | RCOR3 | P21T-E | Human | Esophagus | ESCC | 5.90e-11 | 2.61e-01 | 0.1617 |
| Page: 1 2 3 4 5 6 |
| Tissue | Expression Dynamics | Abbreviation |
| Esophagus | 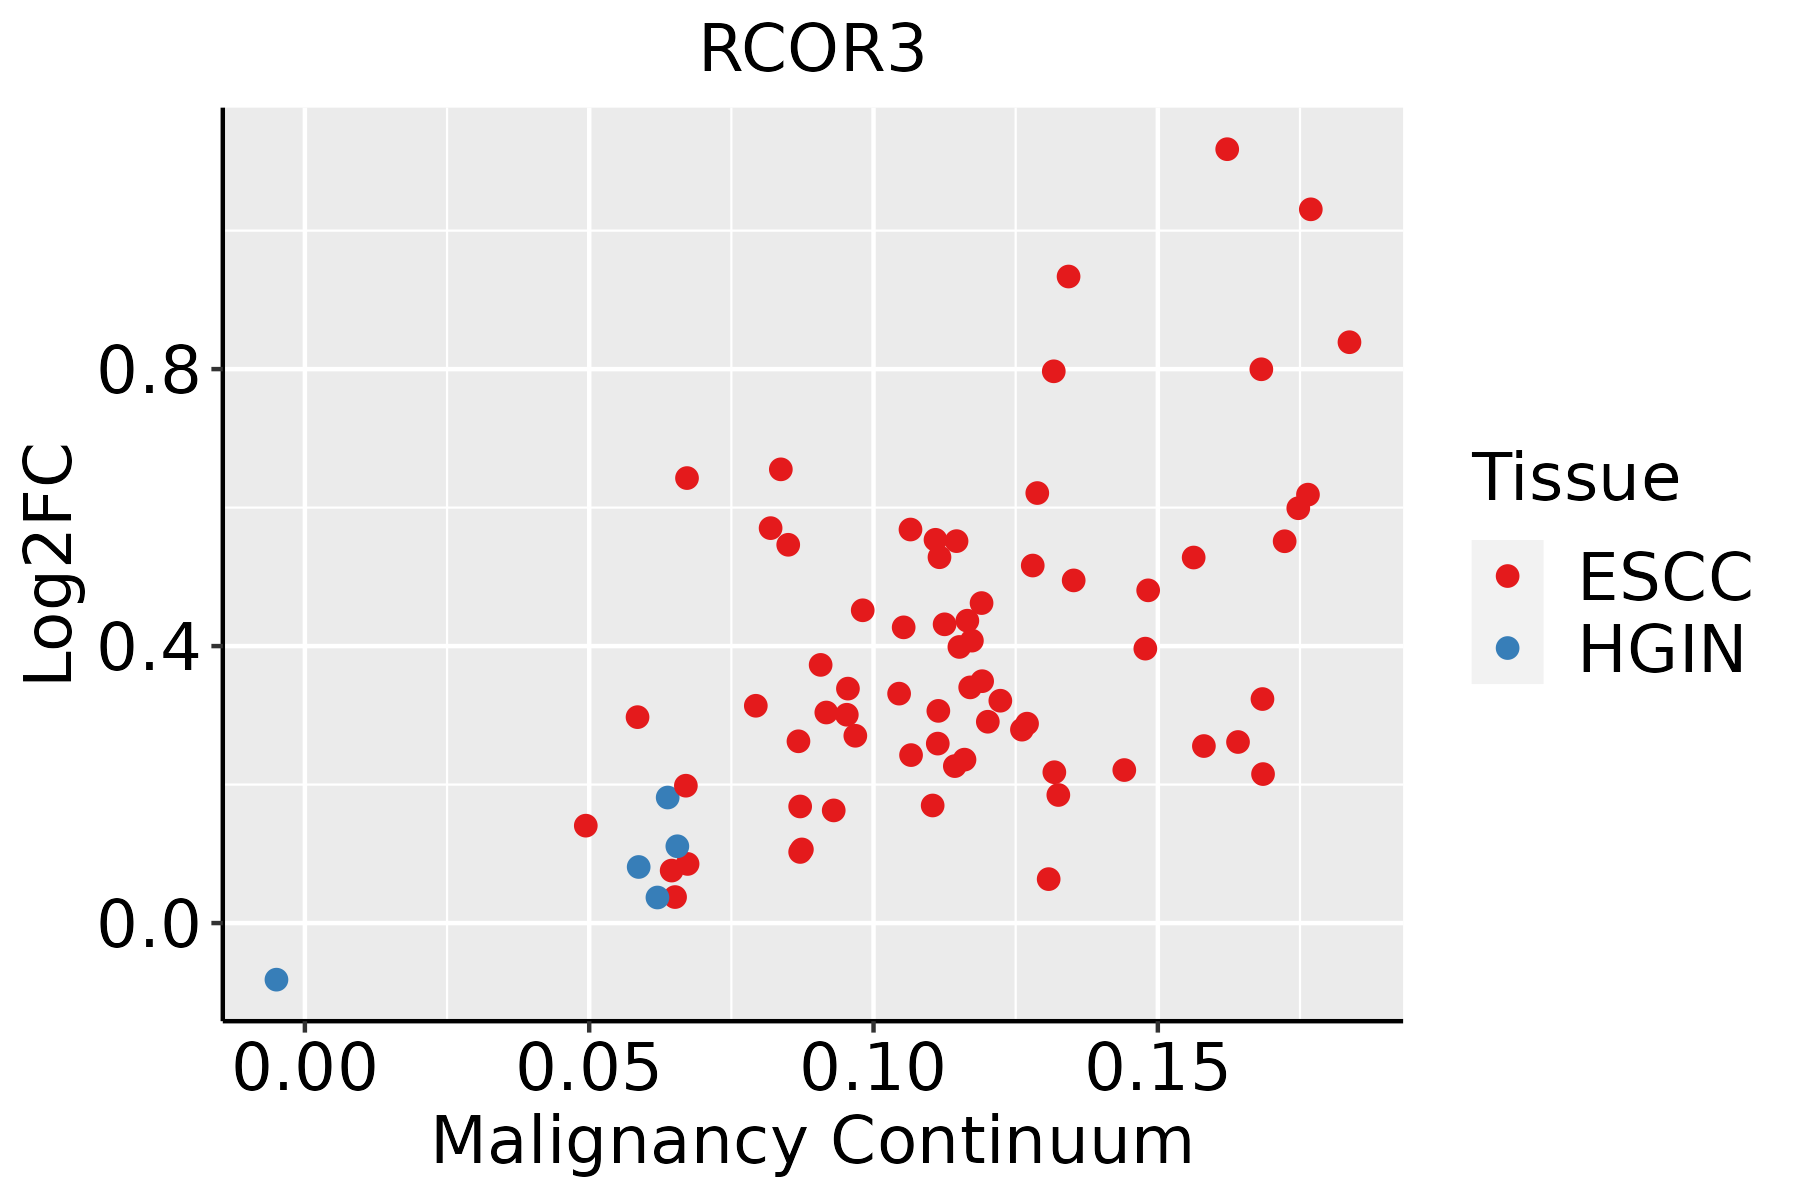 | ESCC: Esophageal squamous cell carcinoma |
| HGIN: High-grade intraepithelial neoplasias | ||
| LGIN: Low-grade intraepithelial neoplasias | ||
| Liver | 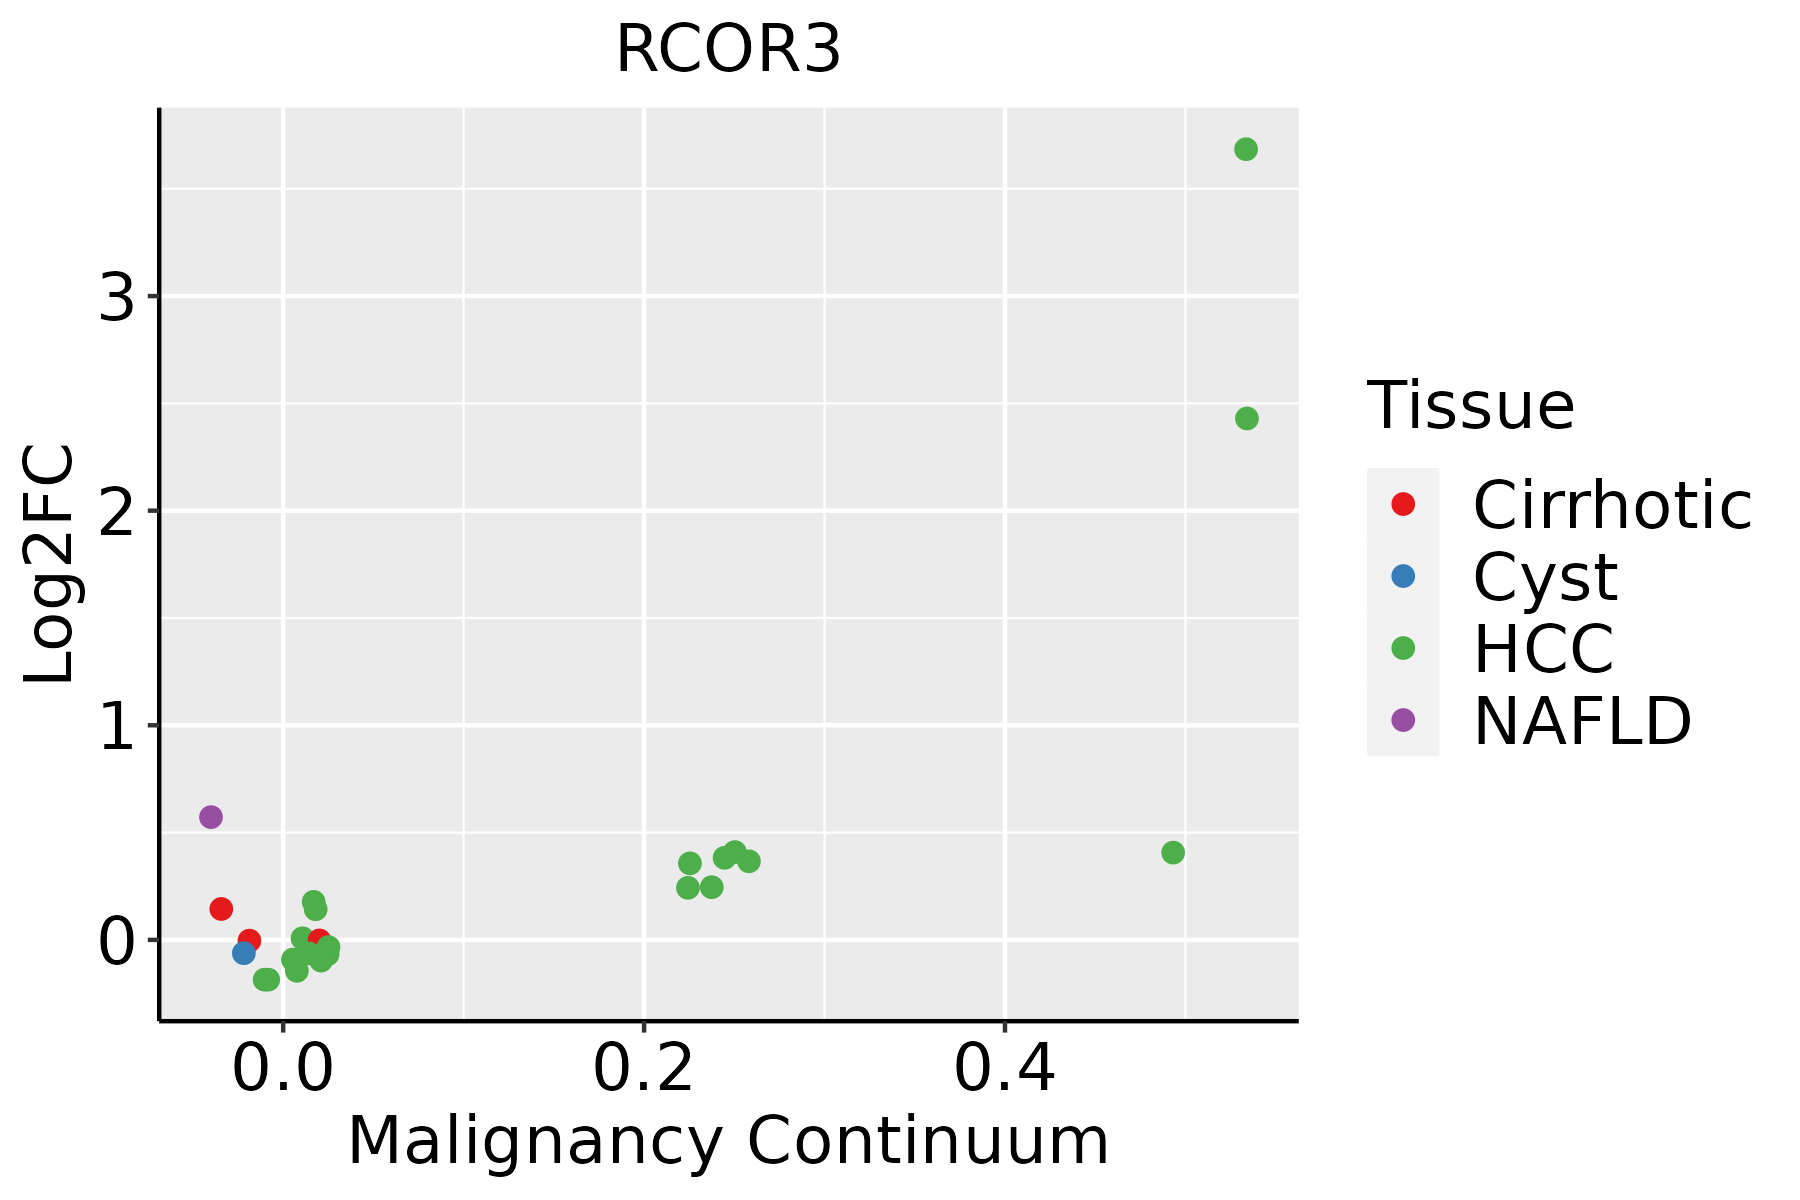 | HCC: Hepatocellular carcinoma |
| NAFLD: Non-alcoholic fatty liver disease | ||
| Lung | 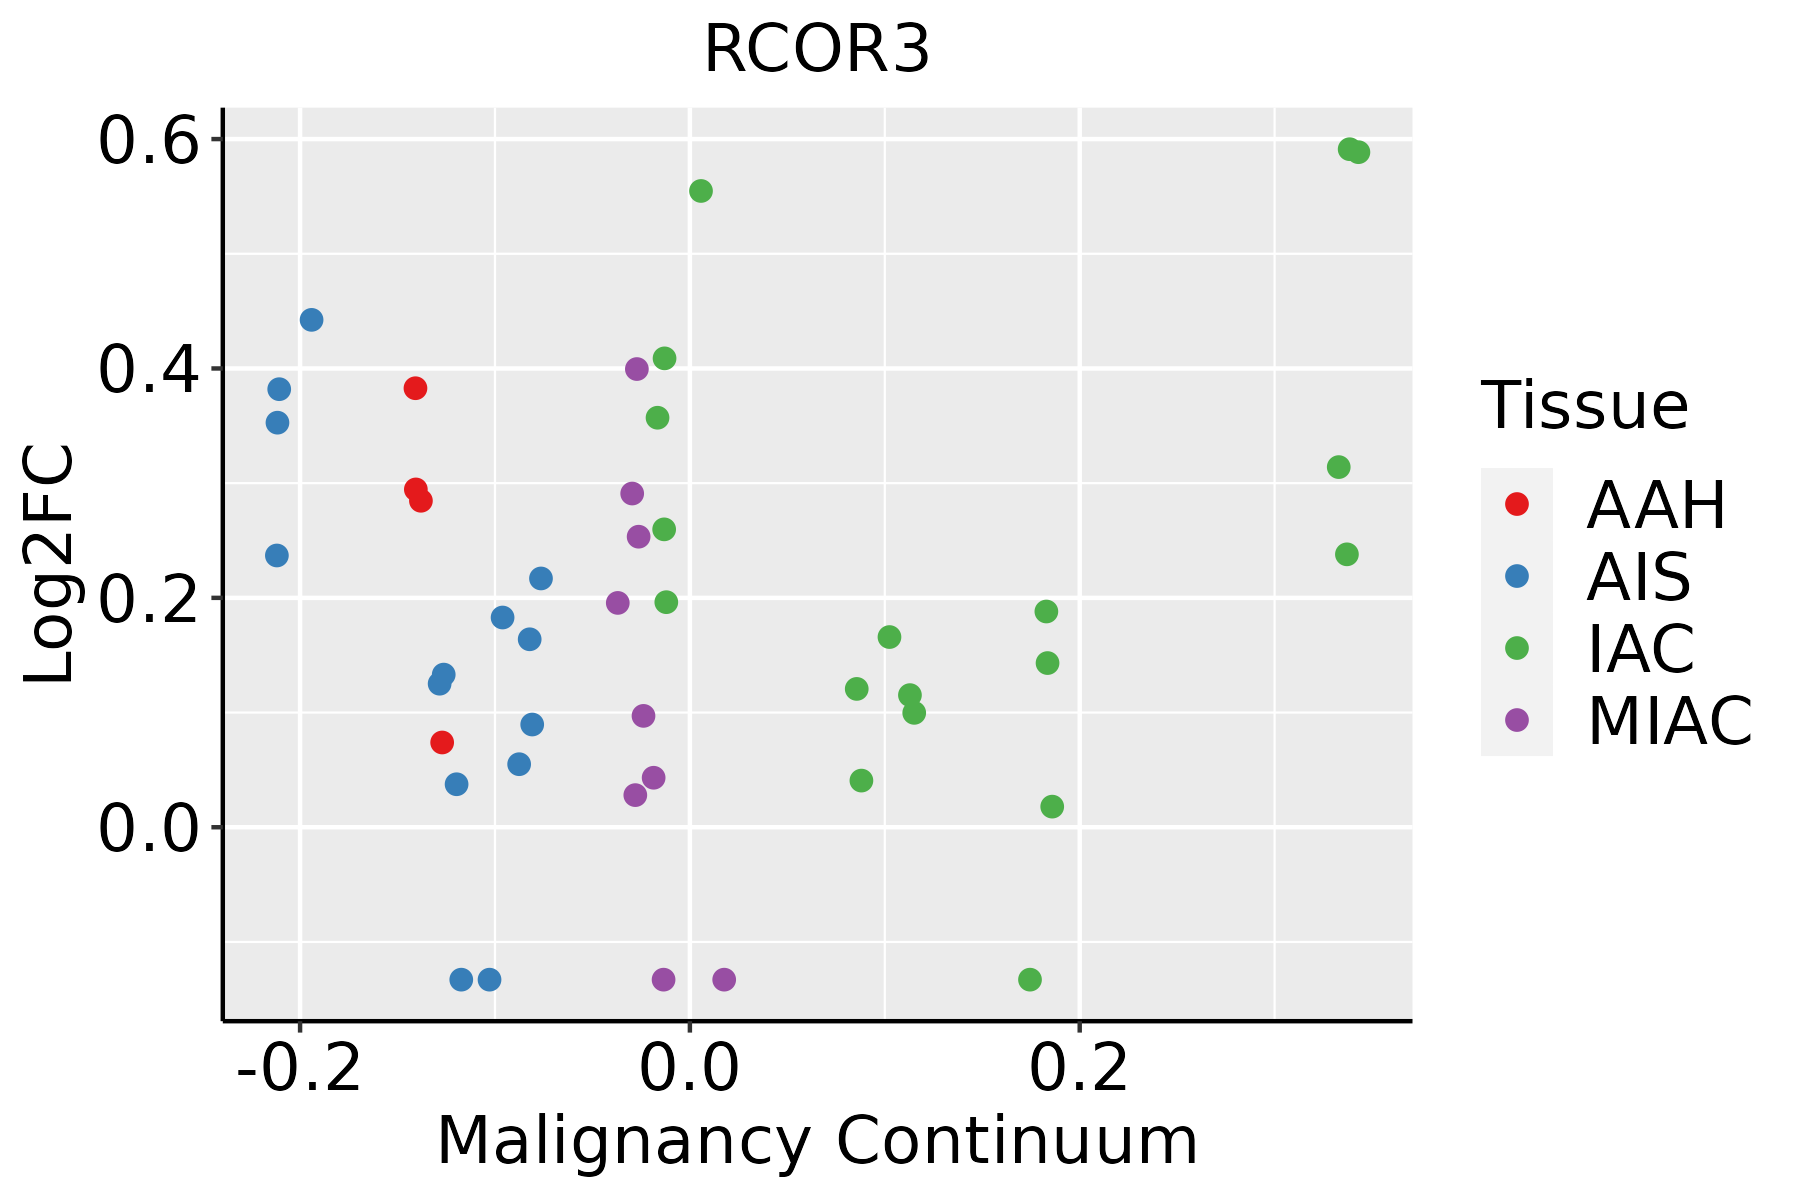 | AAH: Atypical adenomatous hyperplasia |
| AIS: Adenocarcinoma in situ | ||
| IAC: Invasive lung adenocarcinoma | ||
| MIA: Minimally invasive adenocarcinoma | ||
| Prostate | 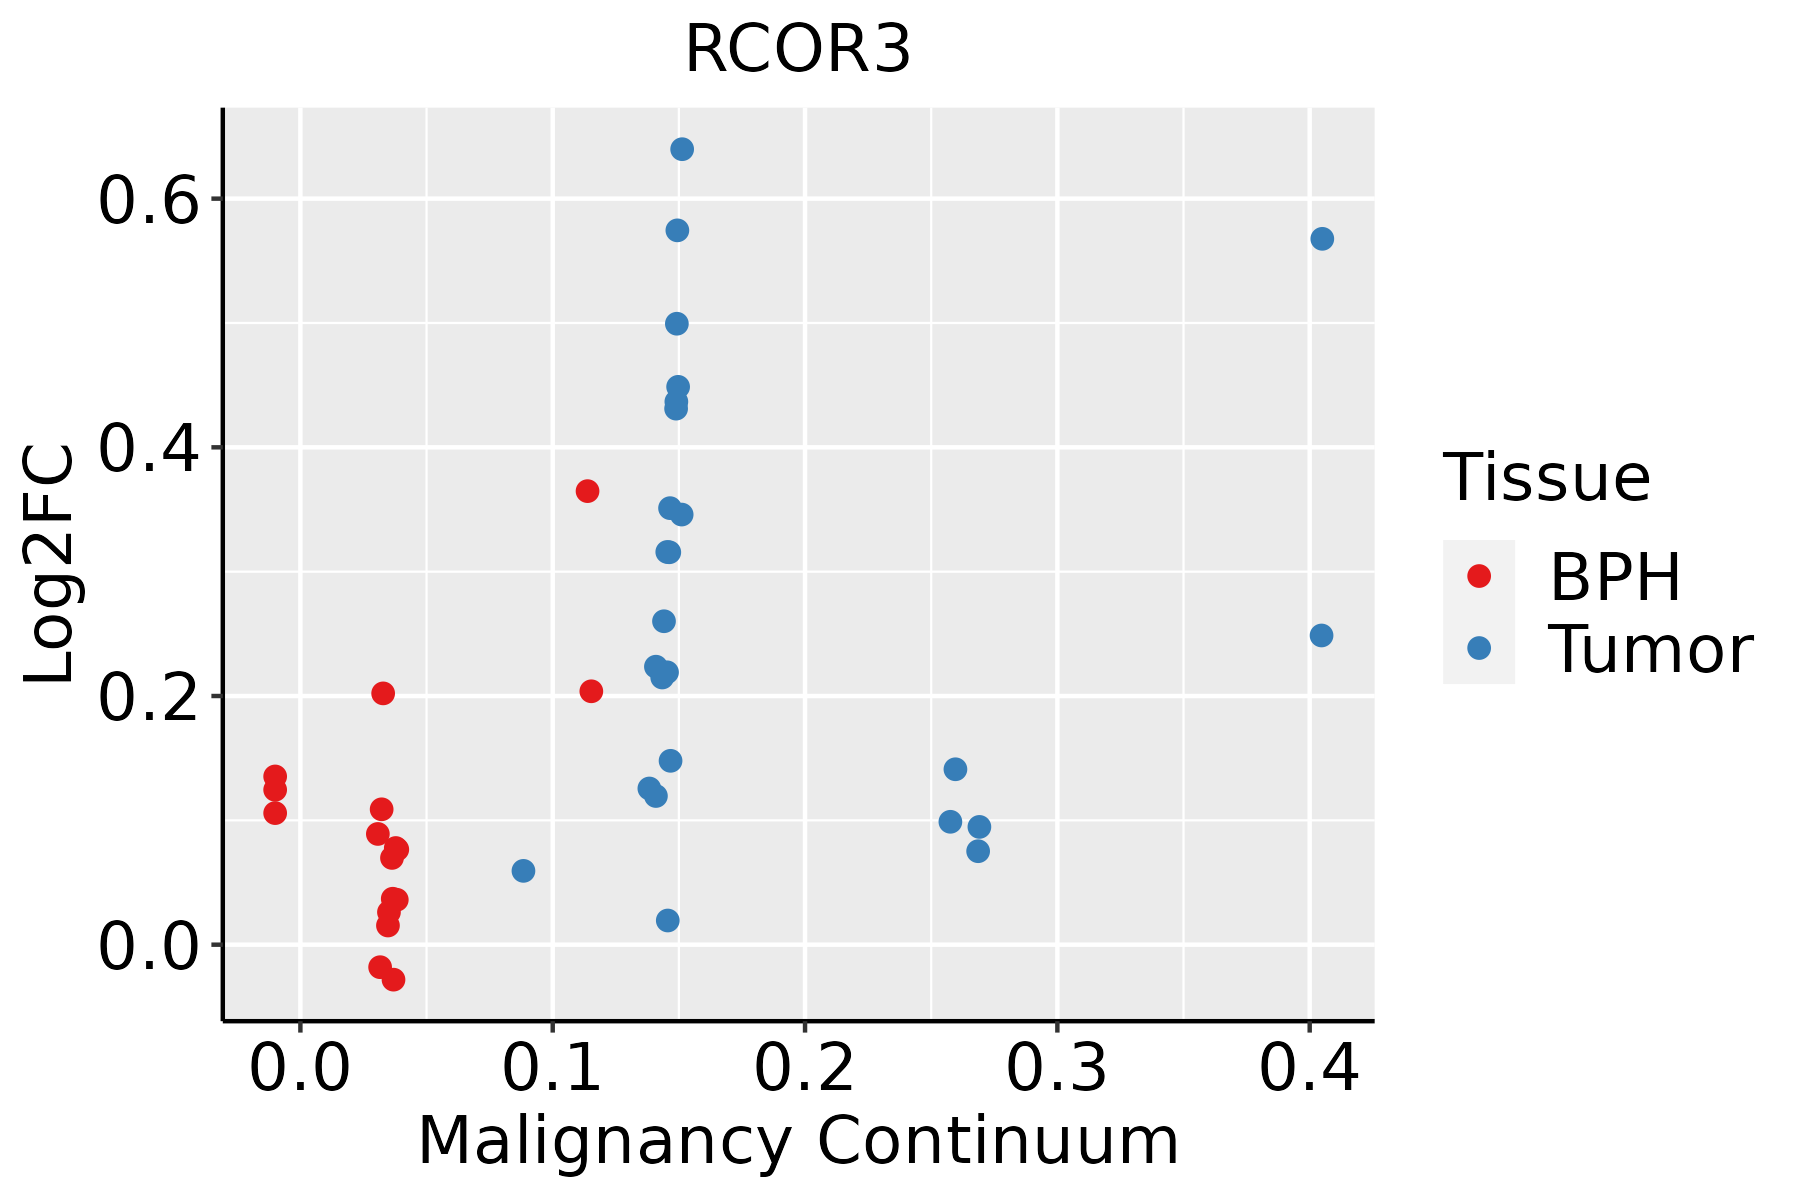 | BPH: Benign Prostatic Hyperplasia |
| Thyroid |  | ATC: Anaplastic thyroid cancer |
| HT: Hashimoto's thyroiditis | ||
| PTC: Papillary thyroid cancer |
| ∗log2FC in expression of this searched gene in stem-like cells from each diseased tissue sample relative to stem-like cells in normal samples in each tissue plotted against the malignancy continuum. Samples are colored based on if they are from different disease stage. |
Top |
Malignant transformation related pathway analysis |
| Find out the enriched GO biological processes and KEGG pathways involved in transition from healthy to precancer to cancer |
| Tissue | Disease Stage | Enriched GO biological Processes |
| Colorectum | AD |  |
| Colorectum | SER |  |
| Colorectum | MSS |  |
| Colorectum | MSI-H |  |
| Colorectum | FAP |  |
| ∗Top 15 enriched GO BP terms are showed in the bar plot of each disease state in each tissue. Each row represents a significant GO biological process which is colored according to the -log10(p.adjust). |
| Page: 1 2 3 4 5 6 7 8 9 |
| GO ID | Tissue | Disease Stage | Description | Gene Ratio | Bg Ratio | pvalue | p.adjust | Count |
| GO:001657015 | Esophagus | ESCC | histone modification | 323/8552 | 463/18723 | 2.61e-26 | 7.88e-24 | 323 |
| GO:00356015 | Esophagus | ESCC | protein deacylation | 79/8552 | 112/18723 | 8.30e-08 | 1.42e-06 | 79 |
| GO:00987325 | Esophagus | ESCC | macromolecule deacylation | 80/8552 | 116/18723 | 3.19e-07 | 4.50e-06 | 80 |
| GO:00165754 | Esophagus | ESCC | histone deacetylation | 60/8552 | 82/18723 | 3.85e-07 | 5.32e-06 | 60 |
| GO:00064765 | Esophagus | ESCC | protein deacetylation | 70/8552 | 101/18723 | 1.29e-06 | 1.58e-05 | 70 |
| GO:00165703 | Liver | NAFLD | histone modification | 90/1882 | 463/18723 | 5.74e-10 | 1.28e-07 | 90 |
| GO:0006476 | Liver | NAFLD | protein deacetylation | 19/1882 | 101/18723 | 5.29e-03 | 4.09e-02 | 19 |
| GO:001657021 | Liver | HCC | histone modification | 283/7958 | 463/18723 | 2.68e-16 | 2.33e-14 | 283 |
| GO:0098732 | Liver | HCC | macromolecule deacylation | 67/7958 | 116/18723 | 6.46e-04 | 3.99e-03 | 67 |
| GO:00356011 | Liver | HCC | protein deacylation | 64/7958 | 112/18723 | 1.23e-03 | 6.83e-03 | 64 |
| GO:00064761 | Liver | HCC | protein deacetylation | 55/7958 | 101/18723 | 1.01e-02 | 3.79e-02 | 55 |
| GO:00165704 | Lung | IAC | histone modification | 93/2061 | 463/18723 | 5.41e-09 | 8.03e-07 | 93 |
| GO:00064762 | Lung | IAC | protein deacetylation | 25/2061 | 101/18723 | 7.38e-05 | 1.55e-03 | 25 |
| GO:0016575 | Lung | IAC | histone deacetylation | 21/2061 | 82/18723 | 1.62e-04 | 2.92e-03 | 21 |
| GO:00356012 | Lung | IAC | protein deacylation | 25/2061 | 112/18723 | 4.18e-04 | 6.25e-03 | 25 |
| GO:00987322 | Lung | IAC | macromolecule deacylation | 25/2061 | 116/18723 | 7.26e-04 | 9.60e-03 | 25 |
| GO:001657012 | Lung | AIS | histone modification | 81/1849 | 463/18723 | 2.30e-07 | 2.16e-05 | 81 |
| GO:000647611 | Lung | AIS | protein deacetylation | 23/1849 | 101/18723 | 1.06e-04 | 2.54e-03 | 23 |
| GO:00165751 | Lung | AIS | histone deacetylation | 19/1849 | 82/18723 | 3.23e-04 | 5.84e-03 | 19 |
| GO:003560111 | Lung | AIS | protein deacylation | 23/1849 | 112/18723 | 5.25e-04 | 8.42e-03 | 23 |
| Page: 1 2 |
| Pathway ID | Tissue | Disease Stage | Description | Gene Ratio | Bg Ratio | pvalue | p.adjust | qvalue | Count |
| Page: 1 |
Top |
Cell-cell communication analysis |
| Identification of potential cell-cell interactions between two cell types and their ligand-receptor pairs for different disease states |
| Ligand | Receptor | LRpair | Pathway | Tissue | Disease Stage |
| Page: 1 |
Top |
Single-cell gene regulatory network inference analysis |
| Find out the significant the regulons (TFs) and the target genes of each regulon across cell types for different disease states |
| TF | Cell Type | Tissue | Disease Stage | Target Gene | RSS | Regulon Activity |
| ∗The dot plots of a searched regulon are shown for all cell subpopulations in each disease state of each tissue based on the regulon specific score inferred using pySCENIC and by calculating the average expression. |
| Page: 1 |
Top |
Somatic mutation of malignant transformation related genes |
| Annotation of somatic variants for genes involved in malignant transformation |
| Hugo Symbol | Variant Class | Variant Classification | dbSNP RS | HGVSc | HGVSp | HGVSp Short | SWISSPROT | BIOTYPE | SIFT | PolyPhen | Tumor Sample Barcode | Tissue | Histology | Sex | Age | Stage | Therapy Types | Drugs | Outcome |
| RCOR3 | SNV | Missense_Mutation | novel | c.1139G>T | p.Gly380Val | p.G380V | Q9P2K3 | protein_coding | tolerated(0.63) | possibly_damaging(0.881) | TCGA-A7-A56D-01 | Breast | breast invasive carcinoma | Female | >=65 | I/II | Hormone Therapy | arimidex | SD |
| RCOR3 | SNV | Missense_Mutation | rs773567709 | c.1340N>A | p.Arg447Gln | p.R447Q | Q9P2K3 | protein_coding | tolerated(0.6) | benign(0) | TCGA-B6-A0RM-01 | Breast | breast invasive carcinoma | Female | <65 | I/II | Unknown | Unknown | SD |
| RCOR3 | SNV | Missense_Mutation | c.1466N>T | p.Gln489Leu | p.Q489L | Q9P2K3 | protein_coding | tolerated(0.1) | benign(0.003) | TCGA-BH-A0WA-01 | Breast | breast invasive carcinoma | Female | >=65 | I/II | Unknown | Unknown | SD | |
| RCOR3 | SNV | Missense_Mutation | c.1263N>C | p.Glu421Asp | p.E421D | Q9P2K3 | protein_coding | tolerated(0.39) | benign(0) | TCGA-D8-A13Z-01 | Breast | breast invasive carcinoma | Female | <65 | I/II | Chemotherapy | doxorubicine | SD | |
| RCOR3 | SNV | Missense_Mutation | rs763801630 | c.1409N>C | p.Asn470Thr | p.N470T | Q9P2K3 | protein_coding | tolerated(0.38) | benign(0.402) | TCGA-E9-A227-01 | Breast | breast invasive carcinoma | Female | <65 | I/II | Chemotherapy | taxotere | CR |
| RCOR3 | SNV | Missense_Mutation | novel | c.173N>T | p.Gly58Val | p.G58V | Q9P2K3 | protein_coding | tolerated(0.15) | probably_damaging(0.999) | TCGA-EA-A556-01 | Cervix | cervical & endocervical cancer | Female | <65 | I/II | Unknown | Unknown | SD |
| RCOR3 | SNV | Missense_Mutation | novel | c.1312N>C | p.Glu438Gln | p.E438Q | Q9P2K3 | protein_coding | tolerated(0.16) | benign(0.192) | TCGA-VS-A8EL-01 | Cervix | cervical & endocervical cancer | Female | <65 | I/II | Chemotherapy | cisplatin | CR |
| RCOR3 | SNV | Missense_Mutation | rs768561869 | c.1451C>T | p.Pro484Leu | p.P484L | Q9P2K3 | protein_coding | deleterious(0) | probably_damaging(0.995) | TCGA-A6-2686-01 | Colorectum | colon adenocarcinoma | Female | >=65 | I/II | Unknown | Unknown | SD |
| RCOR3 | SNV | Missense_Mutation | c.1273G>A | p.Ala425Thr | p.A425T | Q9P2K3 | protein_coding | tolerated(0.6) | benign(0.003) | TCGA-AA-3684-01 | Colorectum | colon adenocarcinoma | Female | >=65 | III/IV | Unknown | Unknown | SD | |
| RCOR3 | SNV | Missense_Mutation | rs773567709 | c.1340N>A | p.Arg447Gln | p.R447Q | Q9P2K3 | protein_coding | tolerated(0.6) | benign(0) | TCGA-AA-3877-01 | Colorectum | colon adenocarcinoma | Female | >=65 | I/II | Unknown | Unknown | SD |
| Page: 1 2 3 4 5 6 7 |
Top |
Related drugs of malignant transformation related genes |
| Identification of chemicals and drugs interact with genes involved in malignant transfromation |
| (DGIdb 4.0) |
| Entrez ID | Symbol | Category | Interaction Types | Drug Claim Name | Drug Name | PMIDs |
| Page: 1 |

Copyright 2023-Present -The University of Texas Health Science Center at Houston |