
|
|||||
|
 | |
| |
| |
| |
| |
| |
|
Gene: RCOR1 |
Gene summary for RCOR1 |
| Gene information | Species | Human | Gene symbol | RCOR1 | Gene ID | 23186 |
| Gene name | REST corepressor 1 | |
| Gene Alias | COREST | |
| Cytomap | 14q32.31-q32.32 | |
| Gene Type | protein-coding | GO ID | GO:0002262 | UniProtAcc | Q9UKL0 |
Top |
Malignant transformation analysis |
| Identification of the aberrant gene expression in precancerous and cancerous lesions by comparing the gene expression of stem-like cells in diseased tissues with normal stem cells |
| Entrez ID | Symbol | Replicates | Species | Organ | Tissue | Adj P-value | Log2FC | Malignancy |
| 23186 | RCOR1 | CCI_1 | Human | Cervix | CC | 3.63e-17 | 1.43e+00 | 0.528 |
| 23186 | RCOR1 | CCI_2 | Human | Cervix | CC | 1.75e-06 | 8.39e-01 | 0.5249 |
| 23186 | RCOR1 | CCI_3 | Human | Cervix | CC | 1.26e-10 | 1.11e+00 | 0.516 |
| 23186 | RCOR1 | sample3 | Human | Cervix | CC | 1.59e-05 | 3.12e-01 | 0.1387 |
| 23186 | RCOR1 | T3 | Human | Cervix | CC | 1.46e-04 | 3.26e-01 | 0.1389 |
| 23186 | RCOR1 | HTA11_3410_2000001011 | Human | Colorectum | AD | 4.66e-17 | -6.26e-01 | 0.0155 |
| 23186 | RCOR1 | HTA11_7862_2000001011 | Human | Colorectum | AD | 1.96e-03 | -5.74e-01 | -0.0179 |
| 23186 | RCOR1 | HTA11_866_3004761011 | Human | Colorectum | AD | 2.95e-04 | -4.62e-01 | 0.096 |
| 23186 | RCOR1 | HTA11_7696_3000711011 | Human | Colorectum | AD | 2.42e-07 | -4.34e-01 | 0.0674 |
| 23186 | RCOR1 | HTA11_99999970781_79442 | Human | Colorectum | MSS | 2.72e-09 | -4.56e-01 | 0.294 |
| 23186 | RCOR1 | HTA11_99999971662_82457 | Human | Colorectum | MSS | 7.77e-18 | -5.88e-01 | 0.3859 |
| 23186 | RCOR1 | HTA11_99999973899_84307 | Human | Colorectum | MSS | 9.40e-09 | -7.56e-01 | 0.2585 |
| 23186 | RCOR1 | HTA11_99999974143_84620 | Human | Colorectum | MSS | 3.85e-19 | -6.48e-01 | 0.3005 |
| 23186 | RCOR1 | F007 | Human | Colorectum | FAP | 1.97e-02 | -3.23e-01 | 0.1176 |
| 23186 | RCOR1 | A002-C-010 | Human | Colorectum | FAP | 6.39e-03 | -3.23e-01 | 0.242 |
| 23186 | RCOR1 | A001-C-207 | Human | Colorectum | FAP | 6.93e-05 | -3.16e-01 | 0.1278 |
| 23186 | RCOR1 | A015-C-203 | Human | Colorectum | FAP | 2.12e-28 | -3.84e-01 | -0.1294 |
| 23186 | RCOR1 | A015-C-204 | Human | Colorectum | FAP | 2.27e-07 | -3.23e-01 | -0.0228 |
| 23186 | RCOR1 | A014-C-040 | Human | Colorectum | FAP | 1.86e-04 | -3.38e-01 | -0.1184 |
| 23186 | RCOR1 | A002-C-201 | Human | Colorectum | FAP | 6.38e-13 | -2.96e-01 | 0.0324 |
| Page: 1 2 3 4 5 6 7 8 9 |
| Tissue | Expression Dynamics | Abbreviation |
| Cervix |  | CC: Cervix cancer |
| HSIL_HPV: HPV-infected high-grade squamous intraepithelial lesions | ||
| N_HPV: HPV-infected normal cervix | ||
| Colorectum (GSE201348) |  | FAP: Familial adenomatous polyposis |
| CRC: Colorectal cancer | ||
| Colorectum (HTA11) |  | AD: Adenomas |
| SER: Sessile serrated lesions | ||
| MSI-H: Microsatellite-high colorectal cancer | ||
| MSS: Microsatellite stable colorectal cancer | ||
| Endometrium | 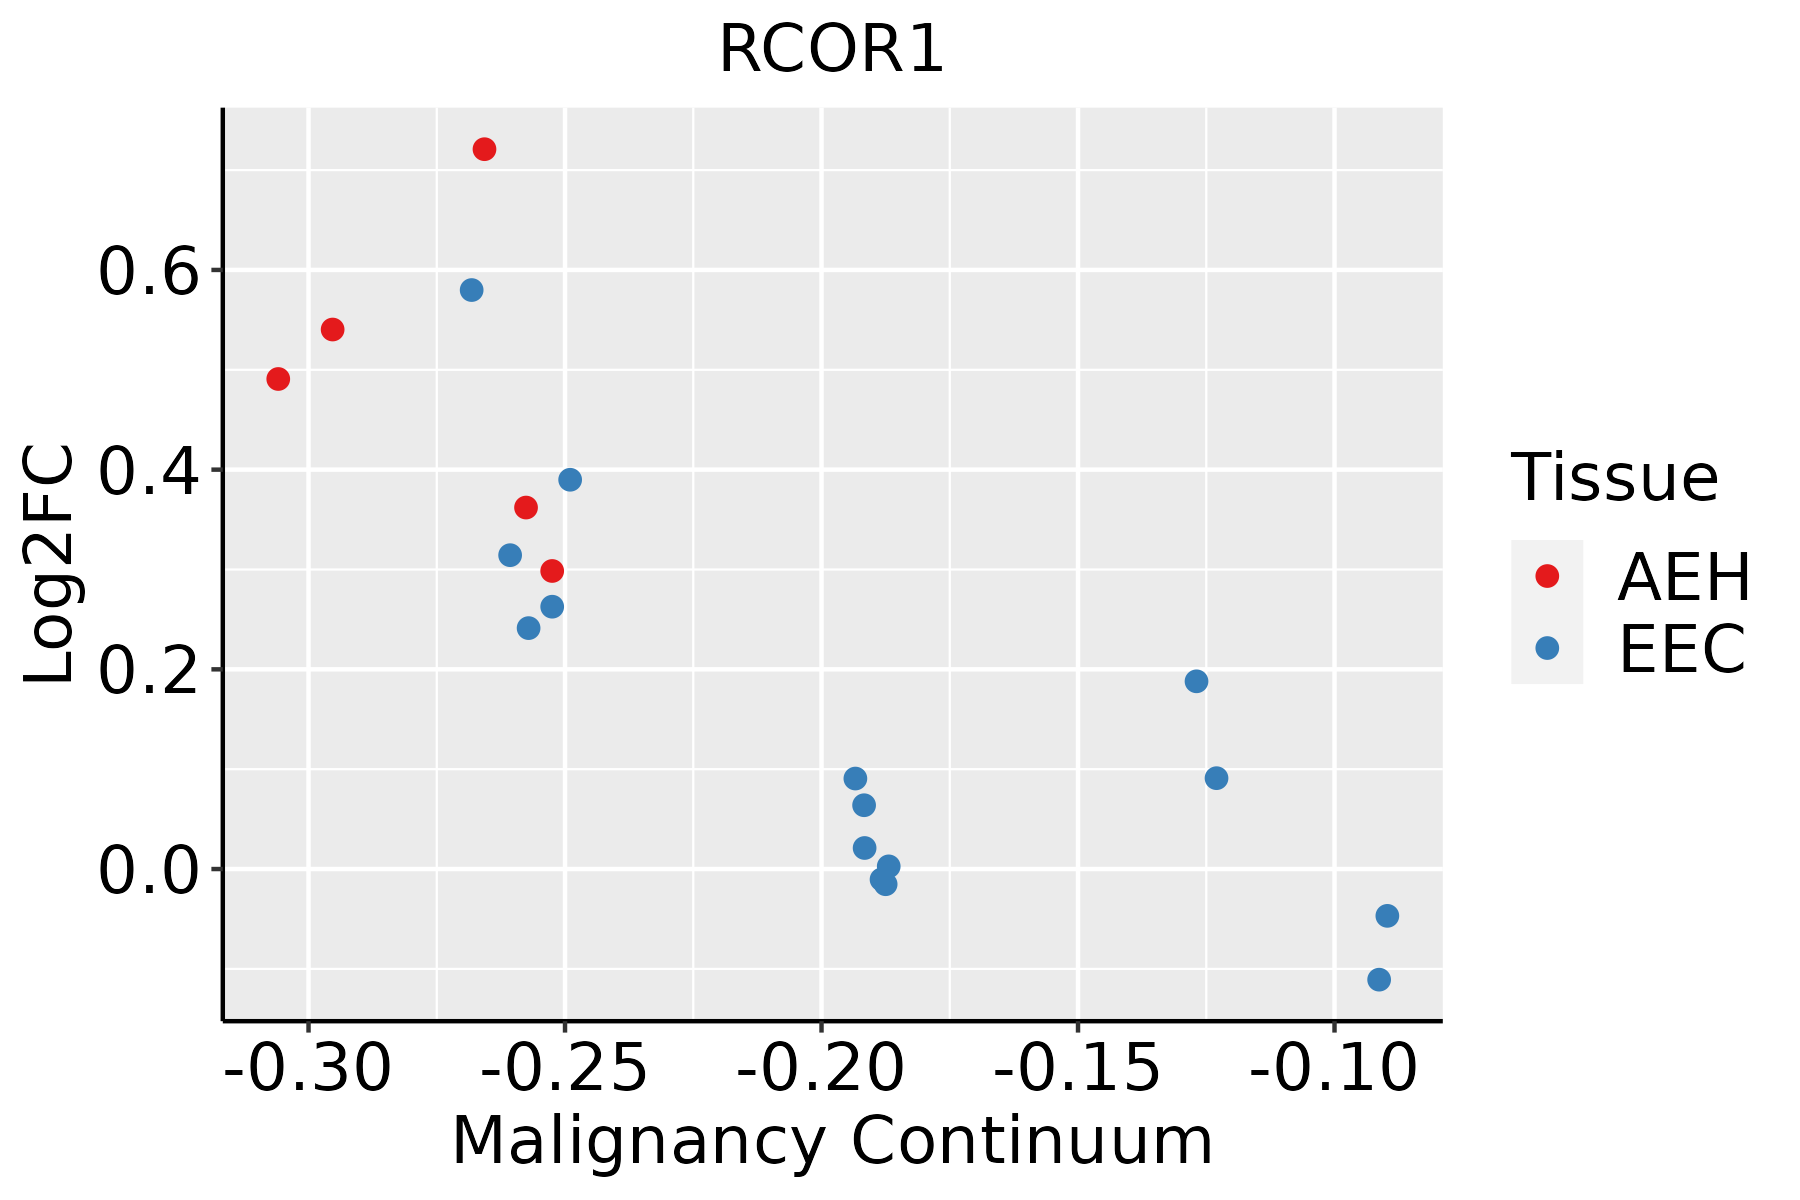 | AEH: Atypical endometrial hyperplasia |
| EEC: Endometrioid Cancer | ||
| Esophagus |  | ESCC: Esophageal squamous cell carcinoma |
| HGIN: High-grade intraepithelial neoplasias | ||
| LGIN: Low-grade intraepithelial neoplasias | ||
| GC | 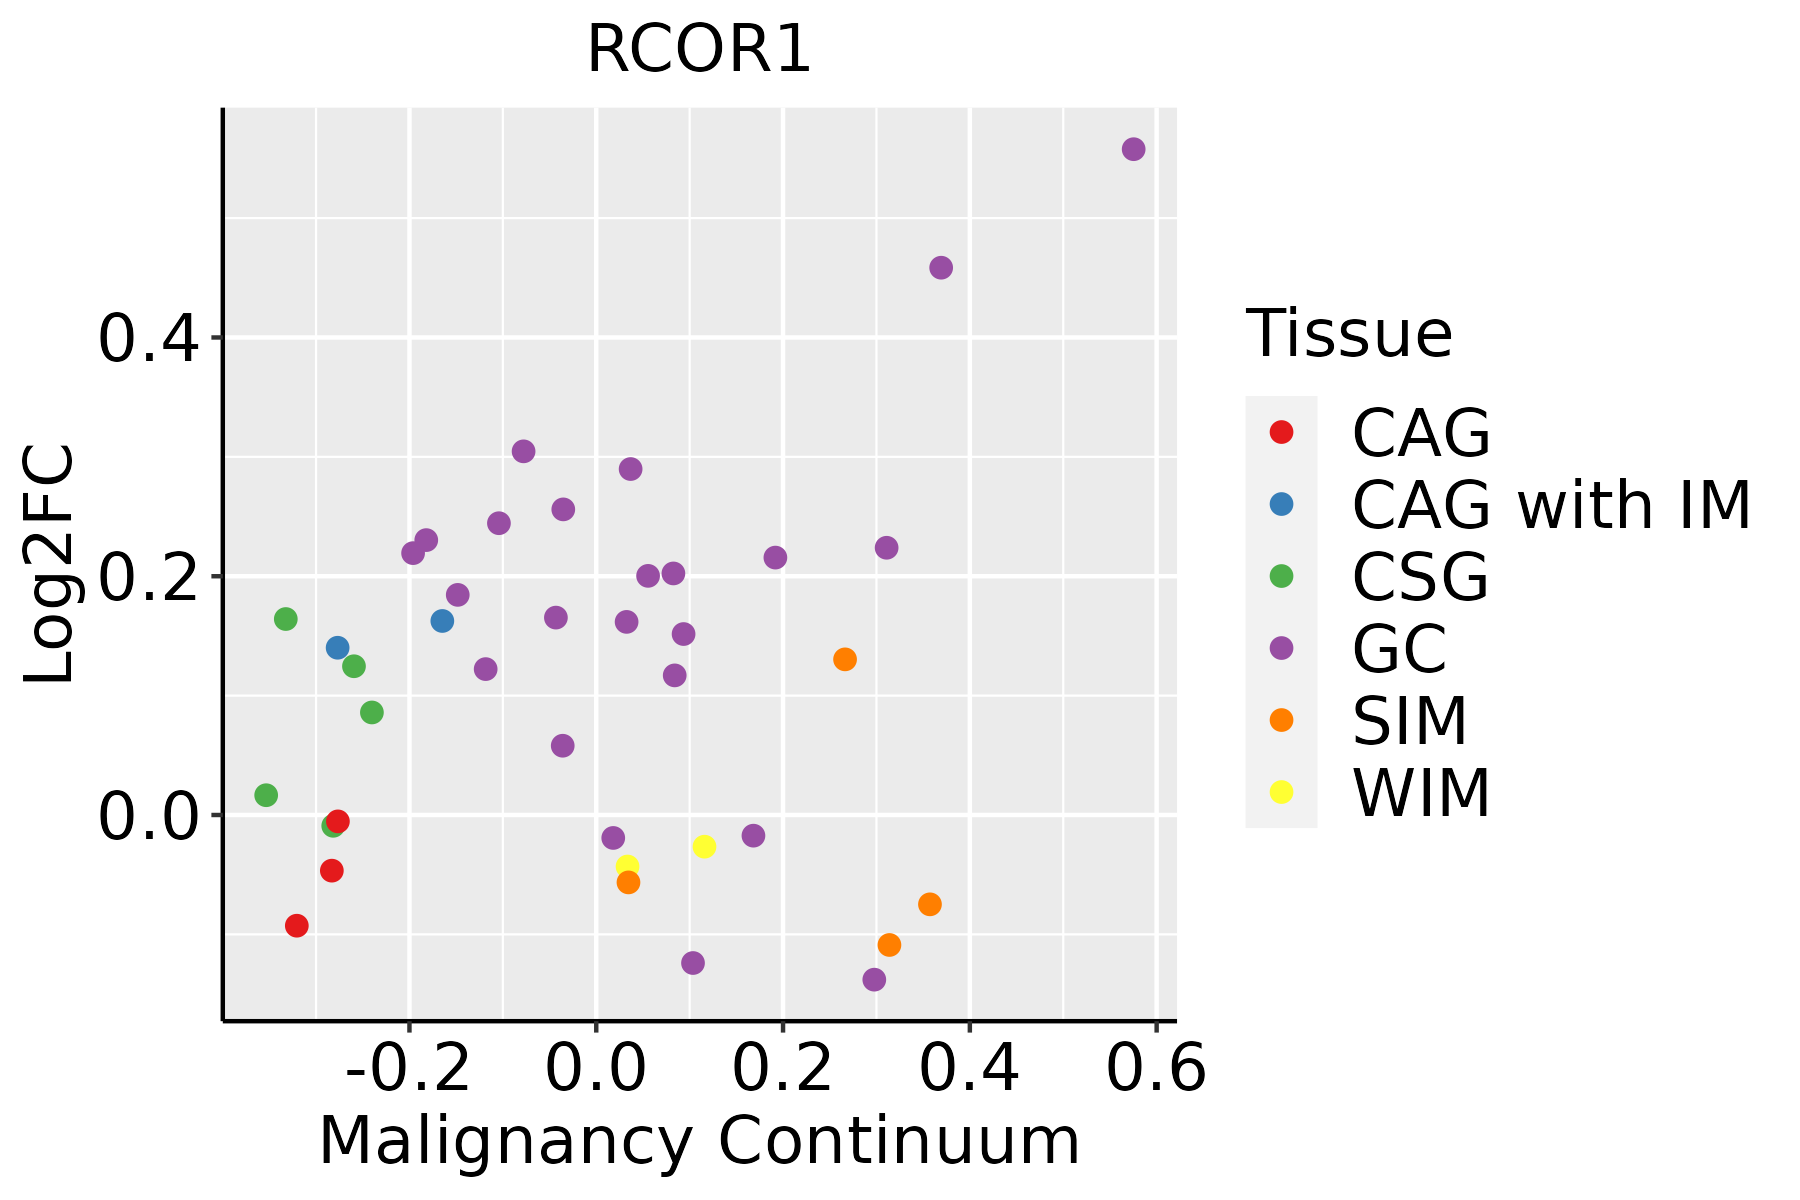 | CAG: Chronic atrophic gastritis |
| CAG with IM: Chronic atrophic gastritis with intestinal metaplasia | ||
| CSG: Chronic superficial gastritis | ||
| GC: Gastric cancer | ||
| SIM: Severe intestinal metaplasia | ||
| WIM: Wild intestinal metaplasia | ||
| Lung | 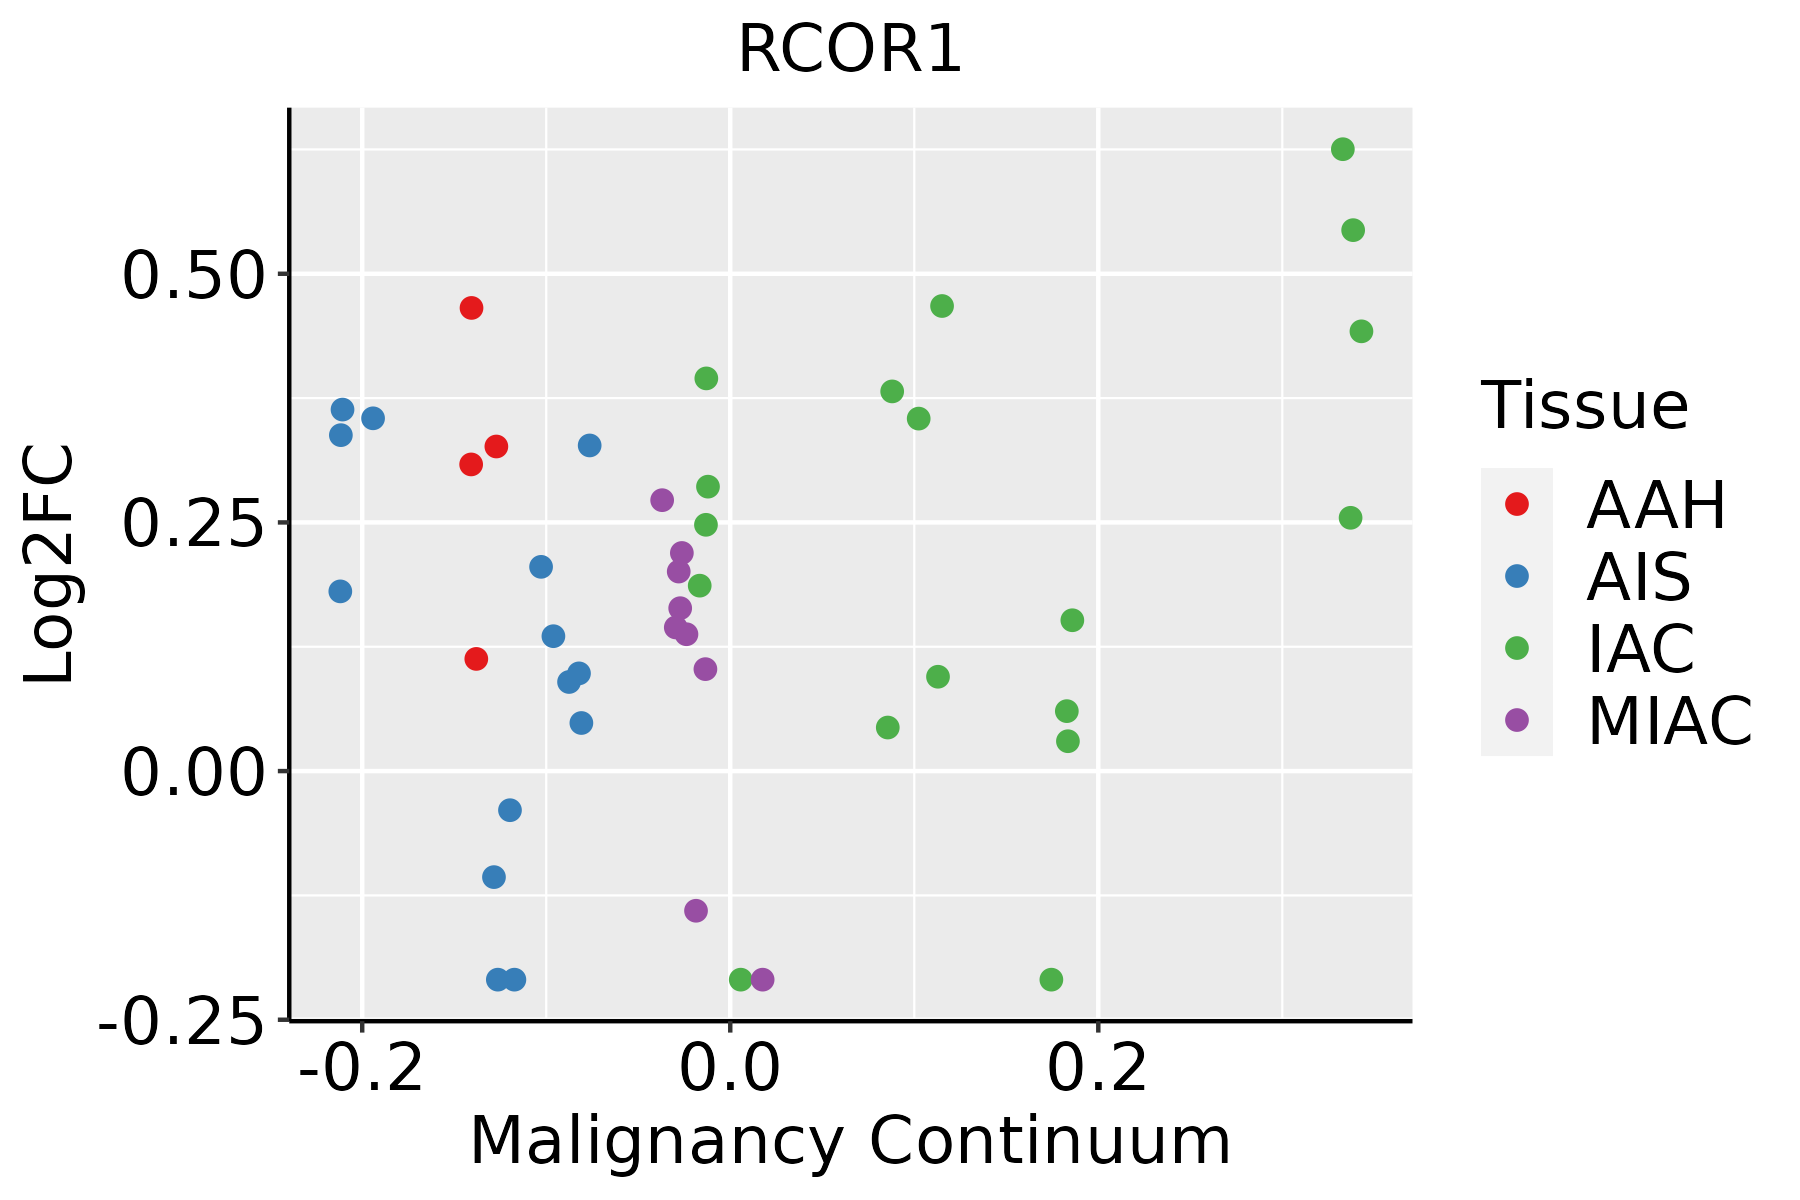 | AAH: Atypical adenomatous hyperplasia |
| AIS: Adenocarcinoma in situ | ||
| IAC: Invasive lung adenocarcinoma | ||
| MIA: Minimally invasive adenocarcinoma | ||
| Oral Cavity | 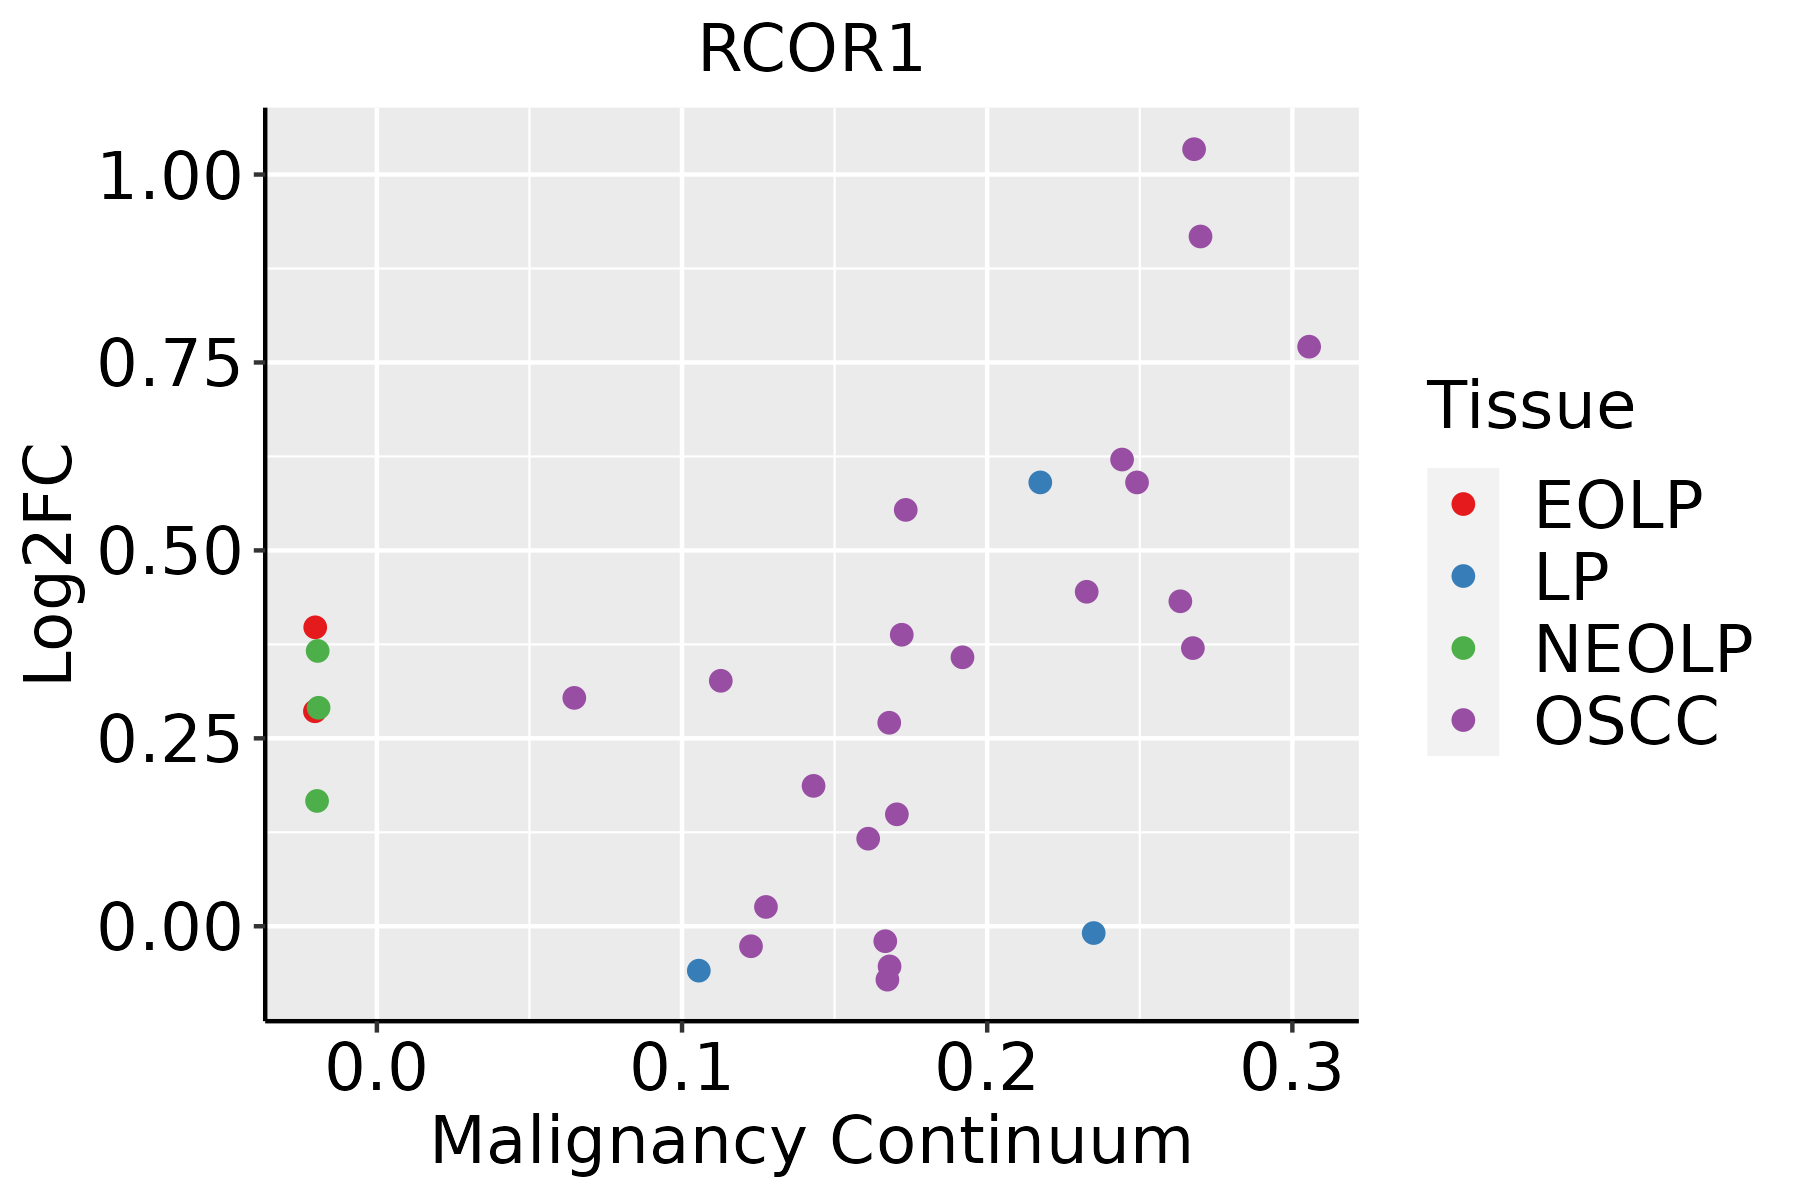 | EOLP: Erosive Oral lichen planus |
| LP: leukoplakia | ||
| NEOLP: Non-erosive oral lichen planus | ||
| OSCC: Oral squamous cell carcinoma | ||
| Skin |  | AK: Actinic keratosis |
| cSCC: Cutaneous squamous cell carcinoma | ||
| SCCIS:squamous cell carcinoma in situ |
| ∗log2FC in expression of this searched gene in stem-like cells from each diseased tissue sample relative to stem-like cells in normal samples in each tissue plotted against the malignancy continuum. Samples are colored based on if they are from different disease stage. |
Top |
Malignant transformation related pathway analysis |
| Find out the enriched GO biological processes and KEGG pathways involved in transition from healthy to precancer to cancer |
| Tissue | Disease Stage | Enriched GO biological Processes |
| Colorectum | AD |  |
| Colorectum | SER |  |
| Colorectum | MSS |  |
| Colorectum | MSI-H |  |
| Colorectum | FAP |  |
| ∗Top 15 enriched GO BP terms are showed in the bar plot of each disease state in each tissue. Each row represents a significant GO biological process which is colored according to the -log10(p.adjust). |
| Page: 1 2 3 4 5 6 7 8 9 |
| GO ID | Tissue | Disease Stage | Description | Gene Ratio | Bg Ratio | pvalue | p.adjust | Count |
| GO:003009910 | Cervix | CC | myeloid cell differentiation | 83/2311 | 381/18723 | 1.31e-07 | 6.42e-06 | 83 |
| GO:190370610 | Cervix | CC | regulation of hemopoiesis | 80/2311 | 367/18723 | 2.14e-07 | 9.55e-06 | 80 |
| GO:000226210 | Cervix | CC | myeloid cell homeostasis | 43/2311 | 157/18723 | 2.66e-07 | 1.12e-05 | 43 |
| GO:003410110 | Cervix | CC | erythrocyte homeostasis | 37/2311 | 129/18723 | 5.16e-07 | 1.93e-05 | 37 |
| GO:003021810 | Cervix | CC | erythrocyte differentiation | 34/2311 | 120/18723 | 2.00e-06 | 6.18e-05 | 34 |
| GO:004887210 | Cervix | CC | homeostasis of number of cells | 61/2311 | 272/18723 | 2.17e-06 | 6.55e-05 | 61 |
| GO:004563710 | Cervix | CC | regulation of myeloid cell differentiation | 48/2311 | 210/18723 | 1.49e-05 | 2.93e-04 | 48 |
| GO:00456397 | Cervix | CC | positive regulation of myeloid cell differentiation | 28/2311 | 103/18723 | 3.56e-05 | 5.70e-04 | 28 |
| GO:00165705 | Cervix | CC | histone modification | 84/2311 | 463/18723 | 1.70e-04 | 2.01e-03 | 84 |
| GO:0034101 | Colorectum | AD | erythrocyte homeostasis | 51/3918 | 129/18723 | 1.07e-06 | 3.59e-05 | 51 |
| GO:0030099 | Colorectum | AD | myeloid cell differentiation | 119/3918 | 381/18723 | 1.24e-06 | 4.01e-05 | 119 |
| GO:0002262 | Colorectum | AD | myeloid cell homeostasis | 57/3918 | 157/18723 | 6.17e-06 | 1.56e-04 | 57 |
| GO:0048872 | Colorectum | AD | homeostasis of number of cells | 87/3918 | 272/18723 | 1.16e-05 | 2.61e-04 | 87 |
| GO:0030218 | Colorectum | AD | erythrocyte differentiation | 45/3918 | 120/18723 | 2.22e-05 | 4.39e-04 | 45 |
| GO:1903706 | Colorectum | AD | regulation of hemopoiesis | 99/3918 | 367/18723 | 3.08e-03 | 2.28e-02 | 99 |
| GO:0045637 | Colorectum | AD | regulation of myeloid cell differentiation | 61/3918 | 210/18723 | 3.17e-03 | 2.35e-02 | 61 |
| GO:00341012 | Colorectum | MSS | erythrocyte homeostasis | 49/3467 | 129/18723 | 1.58e-07 | 7.19e-06 | 49 |
| GO:00300992 | Colorectum | MSS | myeloid cell differentiation | 110/3467 | 381/18723 | 4.48e-07 | 1.75e-05 | 110 |
| GO:00022622 | Colorectum | MSS | myeloid cell homeostasis | 55/3467 | 157/18723 | 6.35e-07 | 2.34e-05 | 55 |
| GO:00488722 | Colorectum | MSS | homeostasis of number of cells | 82/3467 | 272/18723 | 2.02e-06 | 6.28e-05 | 82 |
| Page: 1 2 3 4 5 6 7 8 9 |
| Pathway ID | Tissue | Disease Stage | Description | Gene Ratio | Bg Ratio | pvalue | p.adjust | qvalue | Count |
| hsa0501618 | Cervix | CC | Huntington disease | 94/1267 | 306/8465 | 8.49e-13 | 3.06e-11 | 1.81e-11 | 94 |
| hsa0501619 | Cervix | CC | Huntington disease | 94/1267 | 306/8465 | 8.49e-13 | 3.06e-11 | 1.81e-11 | 94 |
| hsa05016 | Colorectum | AD | Huntington disease | 147/2092 | 306/8465 | 1.93e-19 | 9.26e-18 | 5.91e-18 | 147 |
| hsa050161 | Colorectum | AD | Huntington disease | 147/2092 | 306/8465 | 1.93e-19 | 9.26e-18 | 5.91e-18 | 147 |
| hsa050164 | Colorectum | MSS | Huntington disease | 141/1875 | 306/8465 | 2.90e-21 | 1.62e-19 | 9.92e-20 | 141 |
| hsa050165 | Colorectum | MSS | Huntington disease | 141/1875 | 306/8465 | 2.90e-21 | 1.62e-19 | 9.92e-20 | 141 |
| hsa050168 | Colorectum | FAP | Huntington disease | 73/1404 | 306/8465 | 5.54e-04 | 3.93e-03 | 2.39e-03 | 73 |
| hsa050169 | Colorectum | FAP | Huntington disease | 73/1404 | 306/8465 | 5.54e-04 | 3.93e-03 | 2.39e-03 | 73 |
| hsa0501620 | Endometrium | AEH | Huntington disease | 118/1197 | 306/8465 | 3.00e-27 | 2.44e-25 | 1.78e-25 | 118 |
| hsa05016110 | Endometrium | AEH | Huntington disease | 118/1197 | 306/8465 | 3.00e-27 | 2.44e-25 | 1.78e-25 | 118 |
| hsa0501625 | Endometrium | EEC | Huntington disease | 120/1237 | 306/8465 | 3.86e-27 | 4.23e-25 | 3.15e-25 | 120 |
| hsa0501635 | Endometrium | EEC | Huntington disease | 120/1237 | 306/8465 | 3.86e-27 | 4.23e-25 | 3.15e-25 | 120 |
| hsa05016210 | Esophagus | ESCC | Huntington disease | 226/4205 | 306/8465 | 1.38e-18 | 8.72e-17 | 4.46e-17 | 226 |
| hsa0501638 | Esophagus | ESCC | Huntington disease | 226/4205 | 306/8465 | 1.38e-18 | 8.72e-17 | 4.46e-17 | 226 |
| hsa0501628 | Oral cavity | OSCC | Huntington disease | 204/3704 | 306/8465 | 1.70e-16 | 7.13e-15 | 3.63e-15 | 204 |
| hsa05016112 | Oral cavity | OSCC | Huntington disease | 204/3704 | 306/8465 | 1.70e-16 | 7.13e-15 | 3.63e-15 | 204 |
| hsa0501645 | Oral cavity | EOLP | Huntington disease | 69/1218 | 306/8465 | 6.32e-05 | 2.96e-04 | 1.75e-04 | 69 |
| hsa0501655 | Oral cavity | EOLP | Huntington disease | 69/1218 | 306/8465 | 6.32e-05 | 2.96e-04 | 1.75e-04 | 69 |
| hsa0501612 | Stomach | GC | Huntington disease | 69/708 | 306/8465 | 6.71e-15 | 2.68e-13 | 1.89e-13 | 69 |
| hsa0501613 | Stomach | GC | Huntington disease | 69/708 | 306/8465 | 6.71e-15 | 2.68e-13 | 1.89e-13 | 69 |
| Page: 1 2 |
Top |
Cell-cell communication analysis |
| Identification of potential cell-cell interactions between two cell types and their ligand-receptor pairs for different disease states |
| Ligand | Receptor | LRpair | Pathway | Tissue | Disease Stage |
| Page: 1 |
Top |
Single-cell gene regulatory network inference analysis |
| Find out the significant the regulons (TFs) and the target genes of each regulon across cell types for different disease states |
| TF | Cell Type | Tissue | Disease Stage | Target Gene | RSS | Regulon Activity |
| RCOR1 | AT2 | Lung | IAC | ZBTB16,EXT1,AUTS2, etc. | 1.84e-01 |  |
| RCOR1 | MSC.MVA | Oral cavity | OSCC | DSC2,MXD1,GGA3, etc. | 2.72e-01 |  |
| RCOR1 | CD8TRM | Pancreas | PDAC | ZSWIM6,SIK3,IQCN, etc. | 1.92e-01 |  |
| RCOR1 | CD8TCM | Thyroid | ATC | ZNF282,CFP,ARMCX5, etc. | 3.34e-01 |  |
| ∗The dot plots of a searched regulon are shown for all cell subpopulations in each disease state of each tissue based on the regulon specific score inferred using pySCENIC and by calculating the average expression. |
| Page: 1 |
Top |
Somatic mutation of malignant transformation related genes |
| Annotation of somatic variants for genes involved in malignant transformation |
| Hugo Symbol | Variant Class | Variant Classification | dbSNP RS | HGVSc | HGVSp | HGVSp Short | SWISSPROT | BIOTYPE | SIFT | PolyPhen | Tumor Sample Barcode | Tissue | Histology | Sex | Age | Stage | Therapy Types | Drugs | Outcome |
| RCOR1 | SNV | Missense_Mutation | c.481G>T | p.Gly161Trp | p.G161W | protein_coding | deleterious(0) | probably_damaging(0.998) | TCGA-A2-A0EM-01 | Breast | breast invasive carcinoma | Female | >=65 | I/II | Hormone Therapy | tamoxiphen | SD | ||
| RCOR1 | insertion | Nonsense_Mutation | novel | c.1033_1034insAGTGACCAGGAGGGAAAATGCA | p.Leu345Ter | p.L345* | protein_coding | TCGA-AO-A128-01 | Breast | breast invasive carcinoma | Female | <65 | I/II | Chemotherapy | doxorubicin | SD | |||
| RCOR1 | SNV | Missense_Mutation | c.862C>T | p.Pro288Ser | p.P288S | protein_coding | tolerated(0.39) | benign(0.39) | TCGA-FU-A3HY-01 | Cervix | cervical & endocervical cancer | Female | <65 | I/II | Chemotherapy | cisplatin | CR | ||
| RCOR1 | SNV | Missense_Mutation | novel | c.755N>G | p.Lys252Arg | p.K252R | protein_coding | tolerated(0.28) | possibly_damaging(0.458) | TCGA-CM-5348-01 | Colorectum | colon adenocarcinoma | Male | >=65 | III/IV | Unknown | Unknown | SD | |
| RCOR1 | SNV | Missense_Mutation | novel | c.926N>T | p.Ala309Val | p.A309V | protein_coding | tolerated(0.35) | possibly_damaging(0.793) | TCGA-G4-6320-01 | Colorectum | colon adenocarcinoma | Male | >=65 | III/IV | Chemotherapy | oxaliplatin | SD | |
| RCOR1 | SNV | Missense_Mutation | novel | c.1276A>C | p.Asn426His | p.N426H | protein_coding | deleterious(0.03) | possibly_damaging(0.904) | TCGA-AG-A002-01 | Colorectum | rectum adenocarcinoma | Male | <65 | I/II | Unknown | Unknown | SD | |
| RCOR1 | SNV | Missense_Mutation | rs781137761 | c.535G>A | p.Glu179Lys | p.E179K | protein_coding | deleterious(0) | possibly_damaging(0.739) | TCGA-AG-A01J-01 | Colorectum | rectum adenocarcinoma | Female | <65 | I/II | Unknown | Unknown | SD | |
| RCOR1 | SNV | Missense_Mutation | c.1289N>A | p.Arg430His | p.R430H | protein_coding | deleterious(0) | probably_damaging(0.998) | TCGA-EI-6882-01 | Colorectum | rectum adenocarcinoma | Male | <65 | I/II | Unknown | Unknown | SD | ||
| RCOR1 | SNV | Missense_Mutation | novel | c.1267T>G | p.Phe423Val | p.F423V | protein_coding | deleterious(0) | probably_damaging(0.999) | TCGA-A5-A1OF-01 | Endometrium | uterine corpus endometrioid carcinoma | Female | <65 | I/II | Unknown | Unknown | SD | |
| RCOR1 | SNV | Missense_Mutation | novel | c.743G>A | p.Arg248His | p.R248H | protein_coding | deleterious(0) | probably_damaging(0.999) | TCGA-AP-A051-01 | Endometrium | uterine corpus endometrioid carcinoma | Female | >=65 | I/II | Unknown | Unknown | SD |
| Page: 1 2 3 4 5 |
Top |
Related drugs of malignant transformation related genes |
| Identification of chemicals and drugs interact with genes involved in malignant transfromation |
| (DGIdb 4.0) |
| Entrez ID | Symbol | Category | Interaction Types | Drug Claim Name | Drug Name | PMIDs |
| Page: 1 |

Copyright 2023-Present -The University of Texas Health Science Center at Houston |